| Param | Original file | Final file |
|---|---|---|
| Filename | modeM0/AS1G06_086T02_9000000936_06785cztM0_level2.evt | modeM0/AS1G06_086T02_9000000936_06785cztM0_level2_quad_clean.evt |
| Size (bytes) | 214,309,440 | 45,020,160 |
| Size | 204.4 MB | 42.9 MB |
| Events in quadrant A | 1,435,277 | 287,855 |
| Events in quadrant B | 1,397,229 | 291,095 |
| Events in quadrant C | 1,345,164 | 287,591 |
| Events in quadrant D | 2,100,035 | 275,743 |
| Mode M9 | |||
|---|---|---|---|
| Quadrant | BADHDUFLAG | Total packets | Discarded packets |
| A | 0 | 5 | 1 |
| B | 0 | 4 | 0 |
| C | 0 | 4 | 0 |
| D | 0 | 4 | 0 |
| Mode M0 | |||
|---|---|---|---|
| Quadrant | BADHDUFLAG | Total packets | Discarded packets |
| A | 0 | 6523 | 84 |
| B | 0 | 6401 | 89 |
| C | 0 | 6378 | 104 |
| D | 0 | 8500 | 235 |
| Mode SS | |||
|---|---|---|---|
| Quadrant | BADHDUFLAG | Total packets | Discarded packets |
| A | 0 | 66 | 2 |
| B | 0 | 66 | 2 |
| C | 0 | 66 | 2 |
| D | 0 | 66 | 2 |
| Quadrant | Total seconds | Saturated seconds | Saturation percentage |
|---|---|---|---|
| A | 3102 | 47 | 1.515152% |
| B | 3102 | 31 | 0.999355% |
| C | 3096 | 25 | 0.807494% |
| D | 3097 | 136 | 4.391346% |
Noise dominated data is calculated using 1-second bins in cleaned event files. If a bin has >2000 counts, and if more than 50% of those come from <1% of pixels, then it is considered to be noise-dominated and hence unusable.
| Quadrant | # 1 sec bins | Bins with >0 counts | Bins with >2000 counts | High rate bins dominated by noise | Noise dominated (total time) | Noise dominated (detector-on time) | Marked lightcurve |
|---|---|---|---|---|---|---|---|
| A | 3152 | 3105 | 5 | 5 | 0.16% | 0.16% |  |
| B | 3154 | 3109 | 1 | 1 | 0.03% | 0.03% |  |
| C | 3154 | 3099 | 0 | 0 | 0.00% | 0.00% |  |
| D | 3154 | 3103 | 79 | 79 | 2.50% | 2.55% |  |
Top three noisy pixels from each quadrant. If the there are fewer than three noisy pixels in the level2.evt file, extra rows are filled as -1
| Pixel properties | Quadrant properties | ||||||
|---|---|---|---|---|---|---|---|
| Quadrant | DetID | PixID | Counts | Sigma | Mean | Median | Sigma |
| A | 8 | 15 | 93871 | 1287.92 | 347 | 340 | 72.6 |
| A | 0 | 47 | 3552 | 44.23 | 347 | 340 | 72.6 |
| A | 0 | 226 | 3318 | 41.01 | 347 | 340 | 72.6 |
| B | 12 | 111 | 7136 | 96.38 | 354 | 345 | 70.5 |
| B | 11 | 111 | 5493 | 73.06 | 354 | 345 | 70.5 |
| B | 0 | 228 | 5368 | 71.29 | 354 | 345 | 70.5 |
| C | 9 | 247 | 10424 | 124.76 | 340 | 342 | 80.8 |
| C | 12 | 4 | 3538 | 39.55 | 340 | 342 | 80.8 |
| C | 13 | 61 | 2611 | 28.08 | 340 | 342 | 80.8 |
| D | 2 | 63 | 456491 | 5416.5 | 333 | 322 | 84.2 |
| D | 8 | 195 | 230478 | 2732.85 | 333 | 322 | 84.2 |
| D | 2 | 152 | 100324 | 1187.41 | 333 | 322 | 84.2 |
Histogram calculated using DETX and DETY for each event in the final _common_clean file
| Quadrant A |  |
 |
Quadrant B |
|---|---|---|---|
| Quadrant D |  |
 |
Quadrant C |
| Plot type | Count rate plots | Images |
|---|---|---|
| Comparison with Poisson distribution Blue bars denote a histogram of data divided into 1 sec bins. Red curve is a Poisson curve with rate = median count rate of data. |
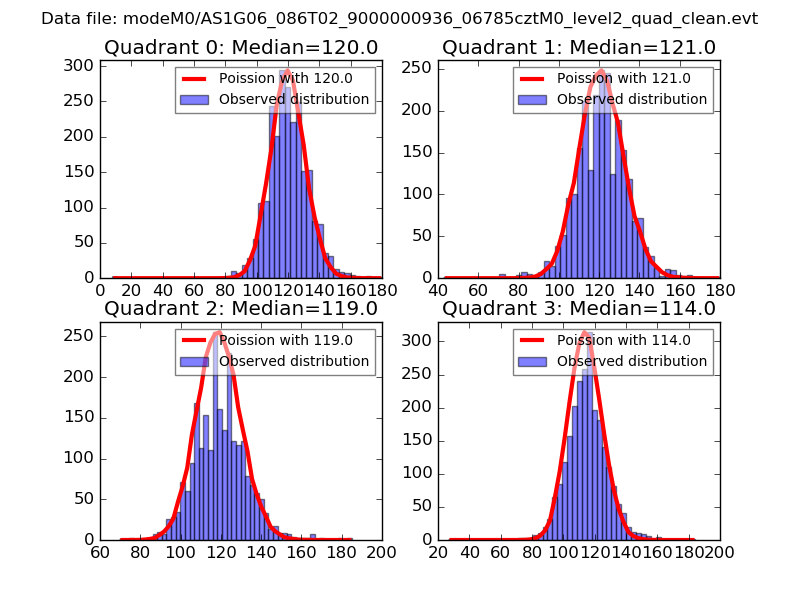 |
 |
| Quadrant-wise count rates Data is divided into 100 sec bins |
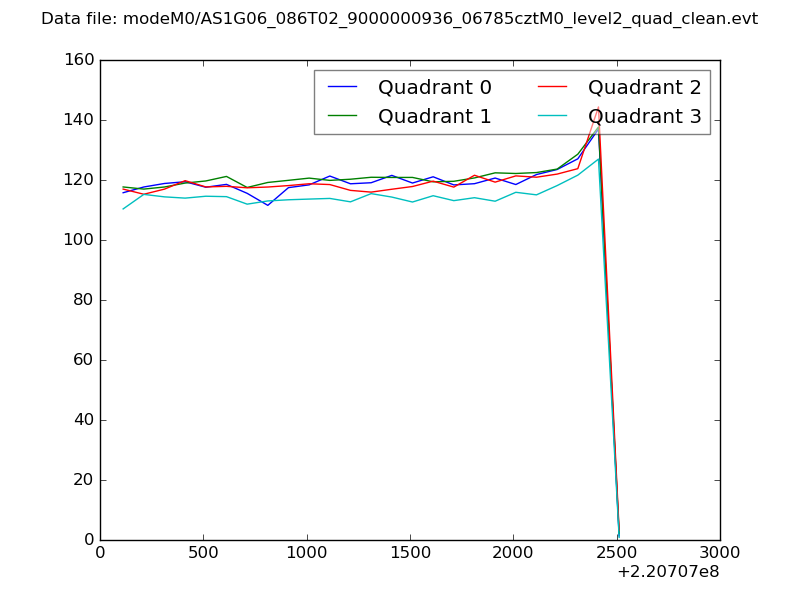 |
|
| Module-wise count rates for Quadrant A Data is divided into 100 sec bins |
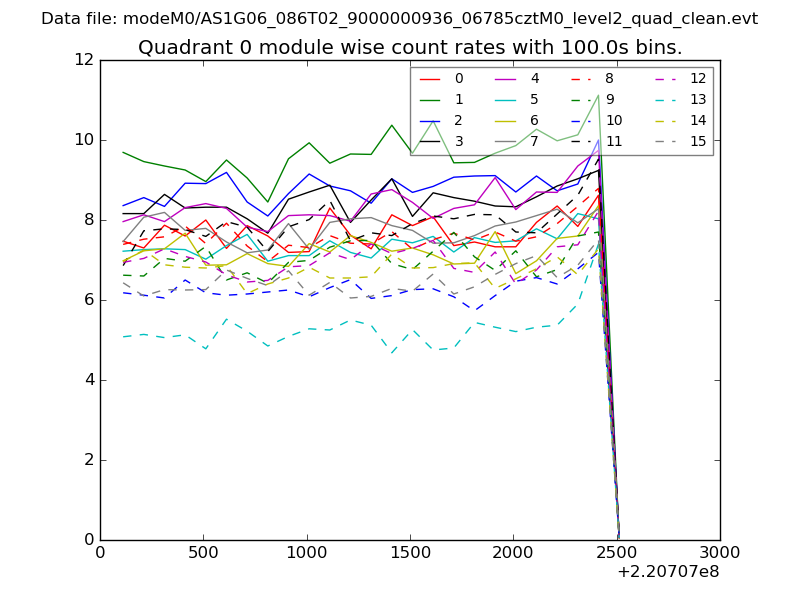 |
 |
| Module-wise count rates for Quadrant B Data is divided into 100 sec bins |
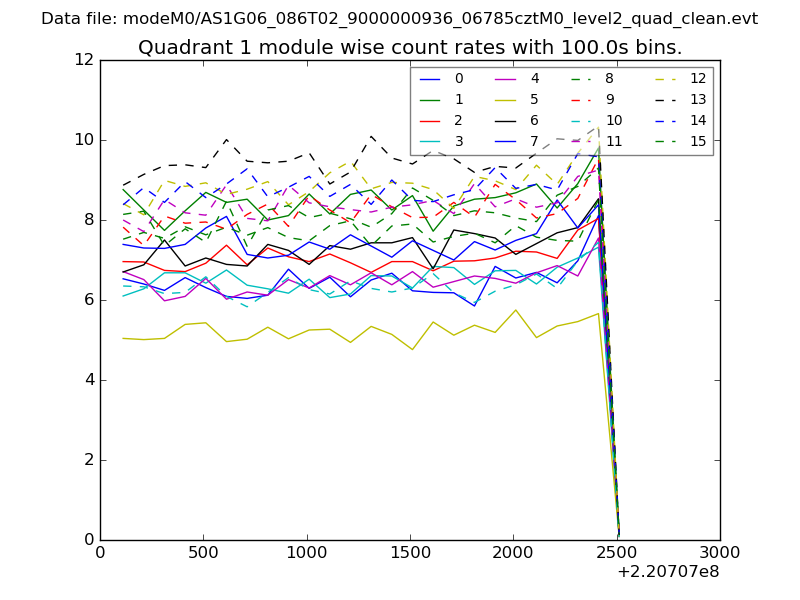 |
 |
| Module-wise count rates for Quadrant C Data is divided into 100 sec bins |
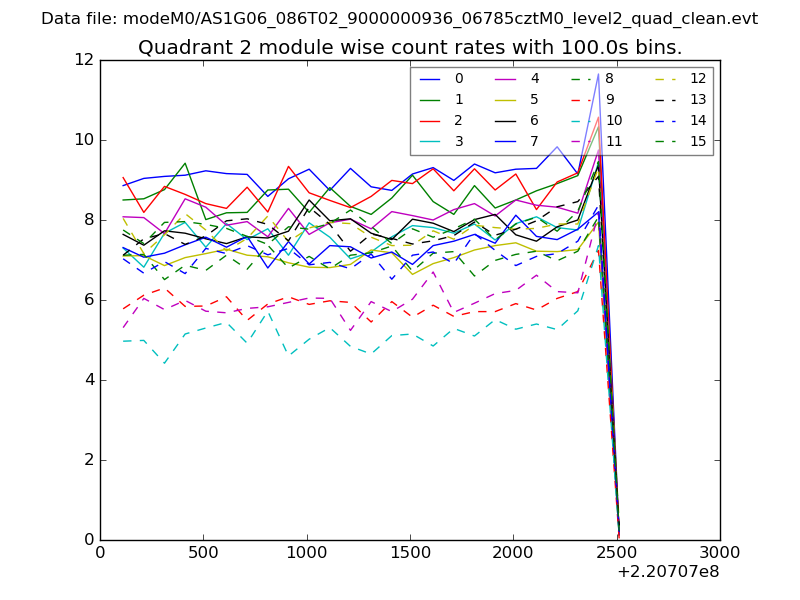 |
 |
| Module-wise count rates for Quadrant D Data is divided into 100 sec bins |
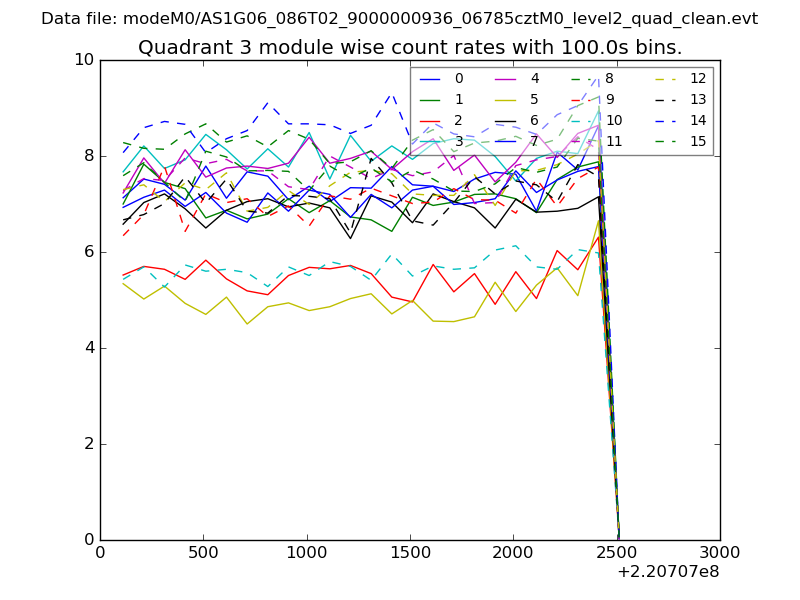 |
 |
| Parameter | Plot |
|---|---|
| CZT HV Monitor | 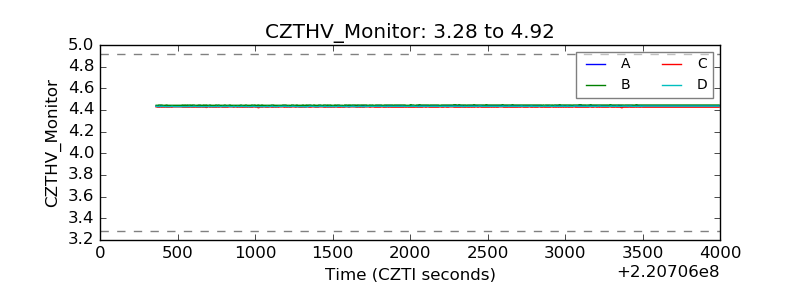 |
| D_VDD |  |
| Temperature 1 |  |
| Veto HV Monitor |  |
| Veto LLD |  |
| Alpha Counter | 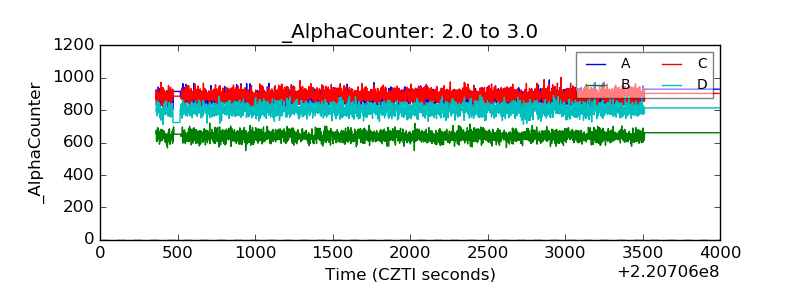 |
| _CPM_Rate | 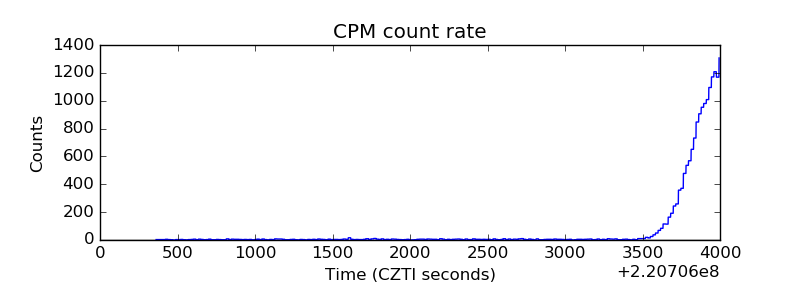 |
| CZT Counter |  |
| +2.5 Volts monitor |  |
| +5 Volts monitor |  |
| _ROLL_ROT | 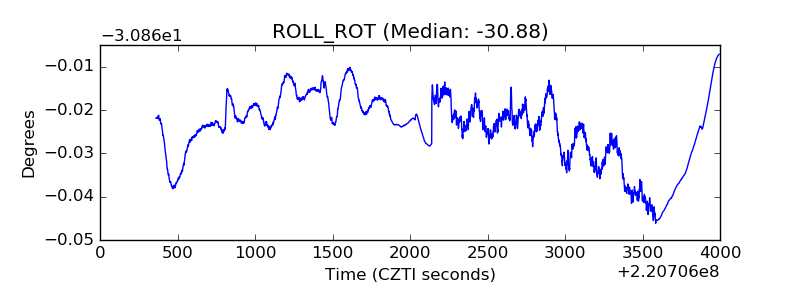 |
| _Roll_DEC | 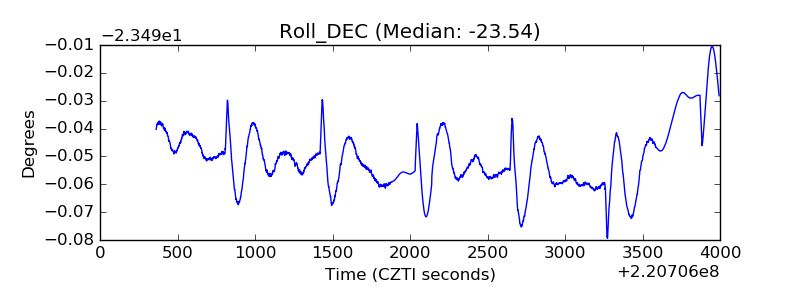 |
| _Roll_RA |  |
| Veto Counter | 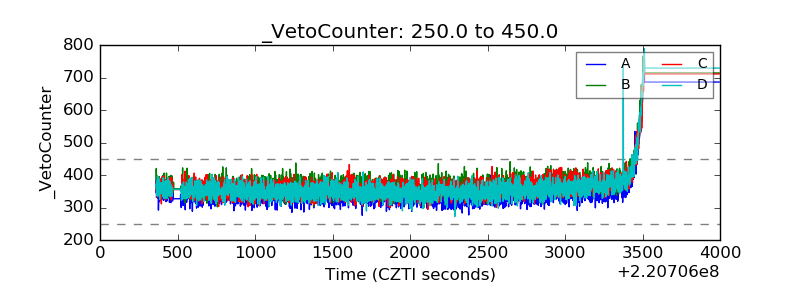 |