| Param | Original file | Final file |
|---|---|---|
| Filename | modeM0/AS1G06_086T02_9000000936_06786cztM0_level2.evt | modeM0/AS1G06_086T02_9000000936_06786cztM0_level2_quad_clean.evt |
| Size (bytes) | 2,542,302,720 | 360,768,960 |
| Size | 2.4 GB | 344.1 MB |
| Events in quadrant A | 15,430,298 | 2,200,941 |
| Events in quadrant B | 15,522,244 | 2,231,052 |
| Events in quadrant C | 15,714,046 | 2,186,410 |
| Events in quadrant D | 28,091,125 | 2,029,672 |
| Mode M9 | |||
|---|---|---|---|
| Quadrant | BADHDUFLAG | Total packets | Discarded packets |
| A | 0 | 52 | 0 |
| B | 0 | 52 | 0 |
| C | 0 | 52 | 0 |
| D | 0 | 52 | 0 |
| Mode M0 | |||
|---|---|---|---|
| Quadrant | BADHDUFLAG | Total packets | Discarded packets |
| A | 0 | 68666 | 7 |
| B | 0 | 68186 | 6 |
| C | 0 | 69337 | 6 |
| D | 0 | 105777 | 6 |
| Mode SS | |||
|---|---|---|---|
| Quadrant | BADHDUFLAG | Total packets | Discarded packets |
| A | 0 | 674 | 0 |
| B | 0 | 674 | 0 |
| C | 0 | 674 | 0 |
| D | 0 | 674 | 0 |
| Quadrant | Total seconds | Saturated seconds | Saturation percentage |
|---|---|---|---|
| A | 33153 | 296 | 0.892830% |
| B | 33153 | 264 | 0.796308% |
| C | 33153 | 381 | 1.149217% |
| D | 33153 | 3289 | 9.920671% |
Noise dominated data is calculated using 1-second bins in cleaned event files. If a bin has >2000 counts, and if more than 50% of those come from <1% of pixels, then it is considered to be noise-dominated and hence unusable.
| Quadrant | # 1 sec bins | Bins with >0 counts | Bins with >2000 counts | High rate bins dominated by noise | Noise dominated (total time) | Noise dominated (detector-on time) | Marked lightcurve |
|---|---|---|---|---|---|---|---|
| A | 38378 | 33159 | 17 | 17 | 0.04% | 0.05% | 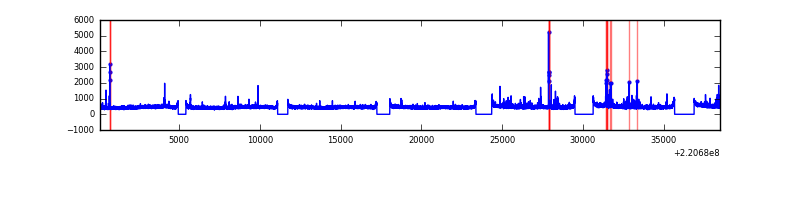 |
| B | 38378 | 33159 | 5 | 5 | 0.01% | 0.02% | 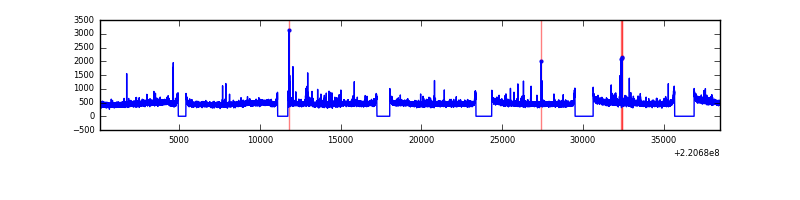 |
| C | 38378 | 33159 | 118 | 118 | 0.31% | 0.36% | 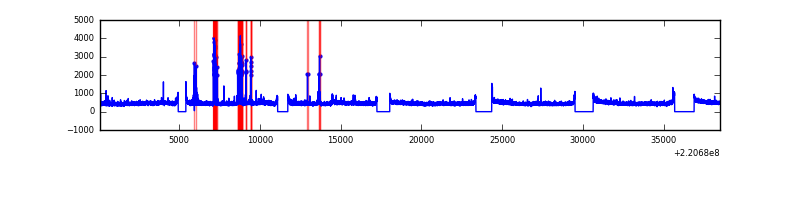 |
| D | 38378 | 33159 | 2742 | 2742 | 7.14% | 8.27% |  |
Top three noisy pixels from each quadrant. If the there are fewer than three noisy pixels in the level2.evt file, extra rows are filled as -1
| Pixel properties | Quadrant properties | ||||||
|---|---|---|---|---|---|---|---|
| Quadrant | DetID | PixID | Counts | Sigma | Mean | Median | Sigma |
| A | 8 | 15 | 287020 | 356.89 | 3902 | 3817 | 793.5 |
| A | 13 | 248 | 81487 | 97.88 | 3902 | 3817 | 793.5 |
| A | 15 | 239 | 47859 | 55.5 | 3902 | 3817 | 793.5 |
| B | 4 | 81 | 77696 | 99.36 | 3925 | 3832 | 743.4 |
| B | 12 | 111 | 76379 | 97.59 | 3925 | 3832 | 743.4 |
| B | 0 | 228 | 69646 | 88.54 | 3925 | 3832 | 743.4 |
| C | 9 | 247 | 764799 | 868.68 | 3799 | 3819 | 876.0 |
| C | 12 | 16 | 45322 | 47.38 | 3799 | 3819 | 876.0 |
| C | 9 | 16 | 34746 | 35.3 | 3799 | 3819 | 876.0 |
| D | 2 | 63 | 10451678 | 11559.36 | 3697 | 3581 | 903.9 |
| D | 8 | 195 | 1893091 | 2090.48 | 3697 | 3581 | 903.9 |
| D | 2 | 152 | 1182290 | 1304.08 | 3697 | 3581 | 903.9 |
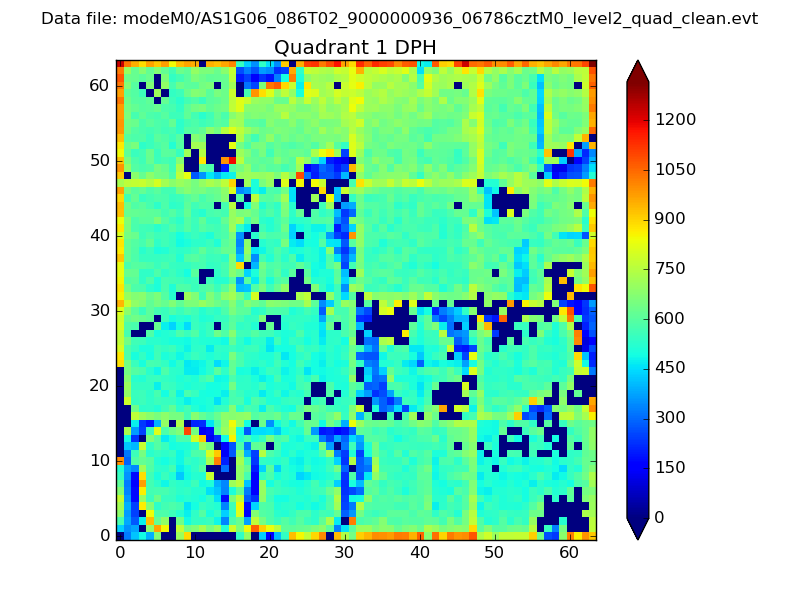
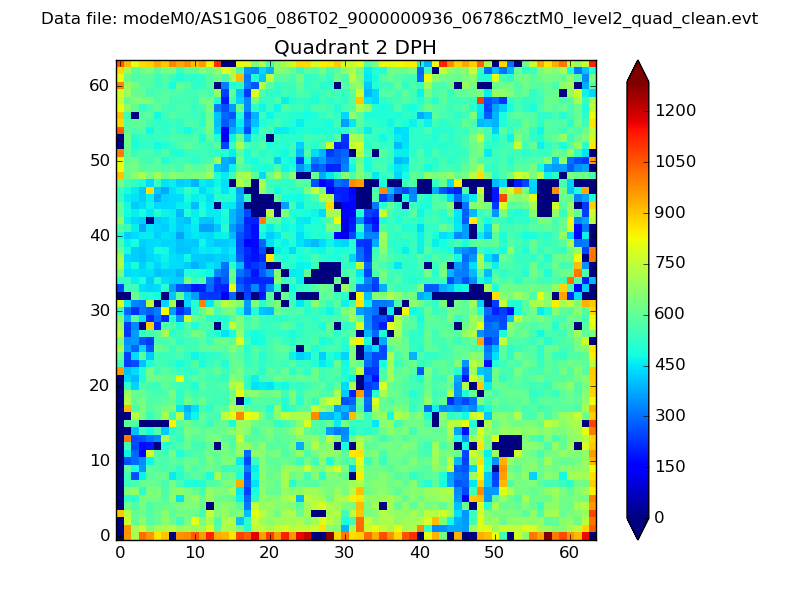
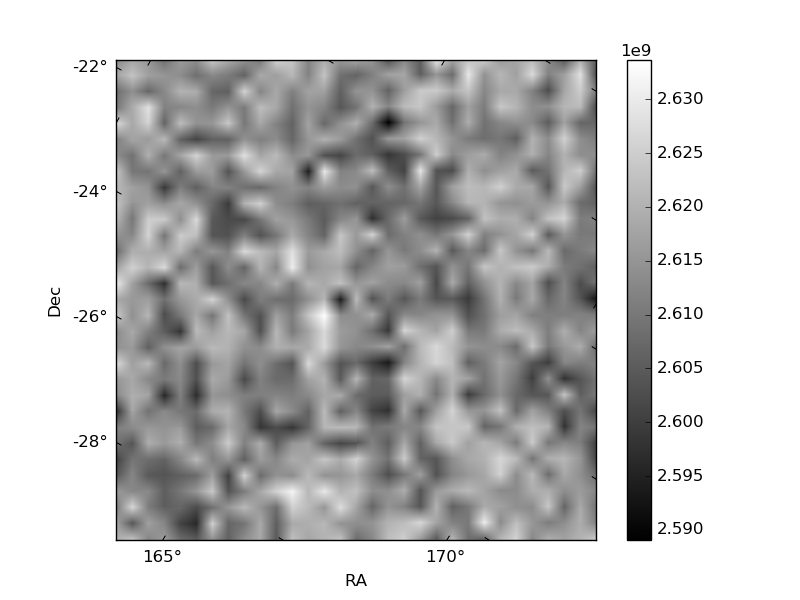
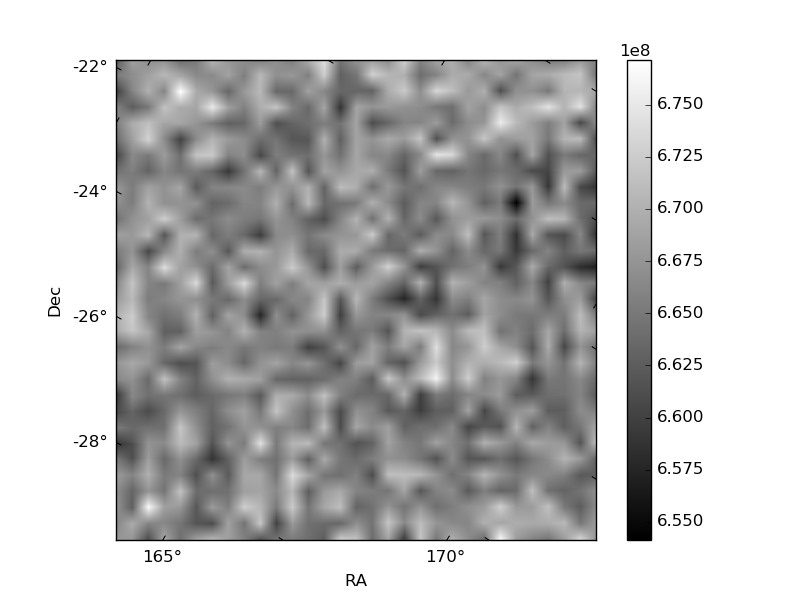
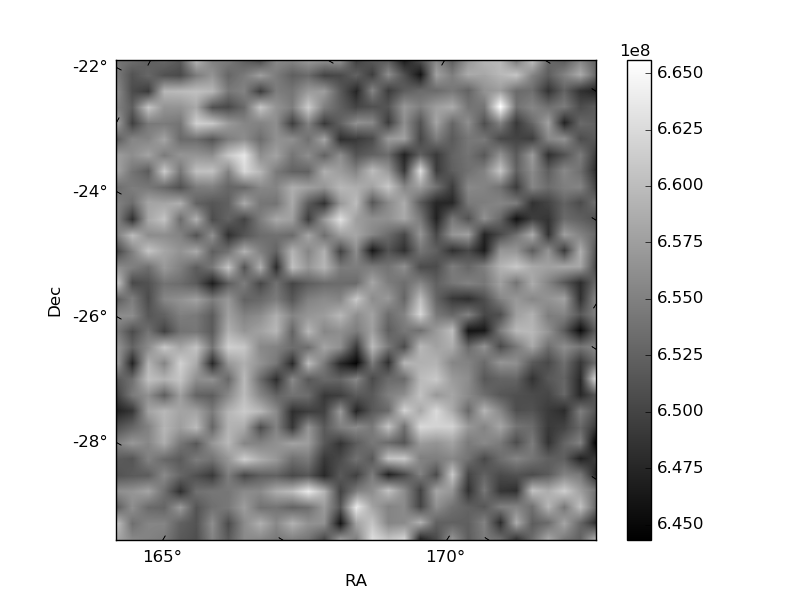
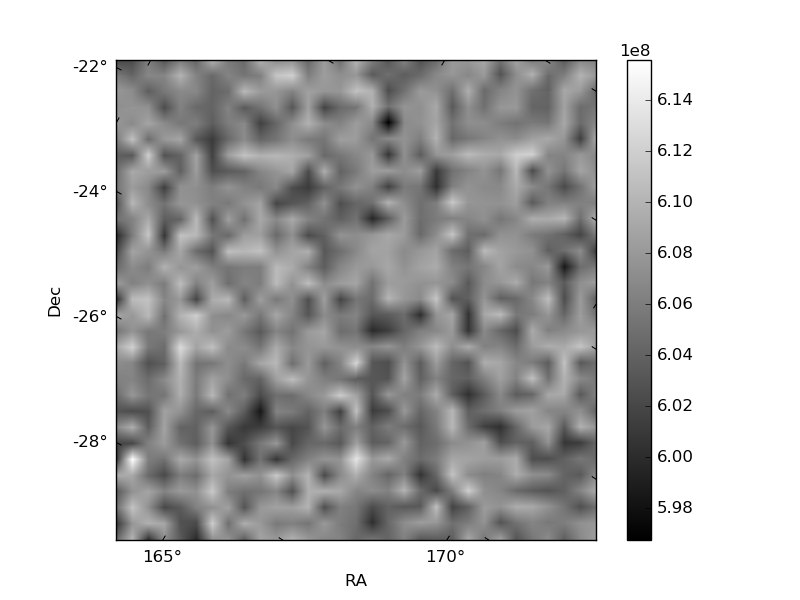
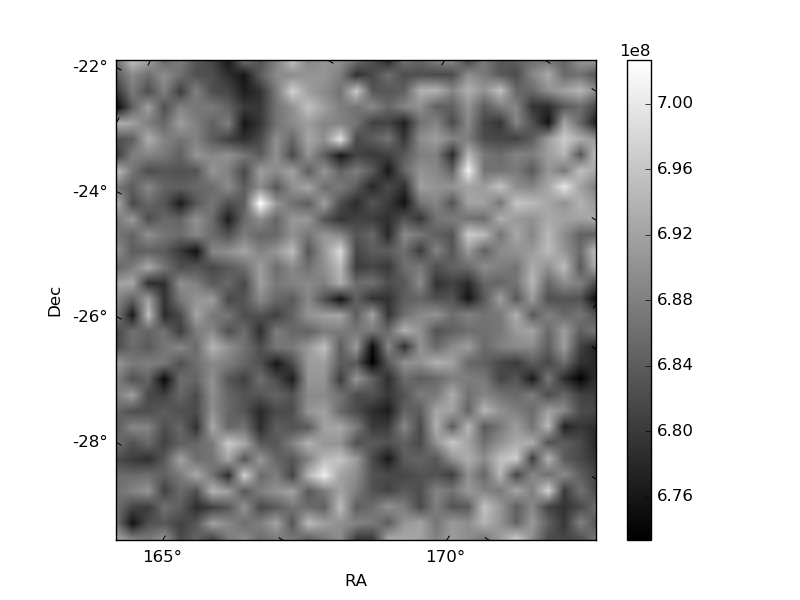
Histogram calculated using DETX and DETY for each event in the final _common_clean file
| Quadrant A | 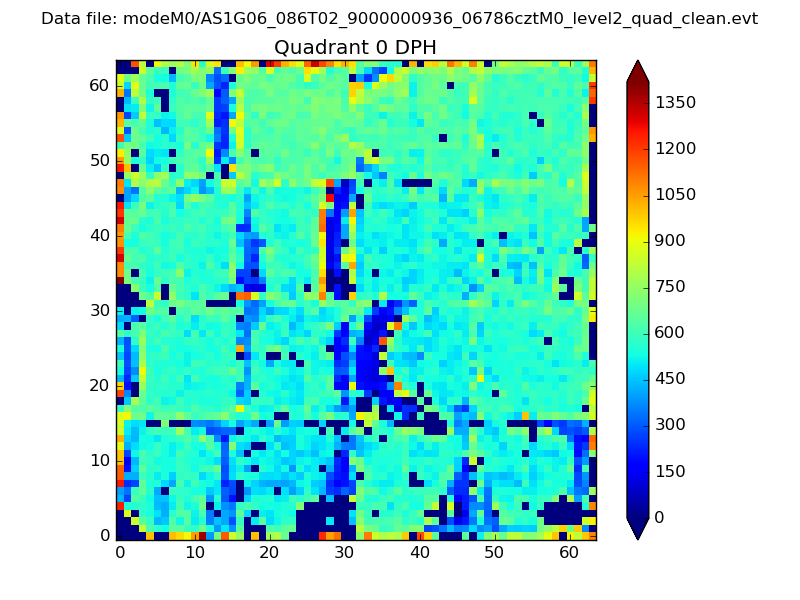 |
 |
Quadrant B |
|---|---|---|---|
| Quadrant D | 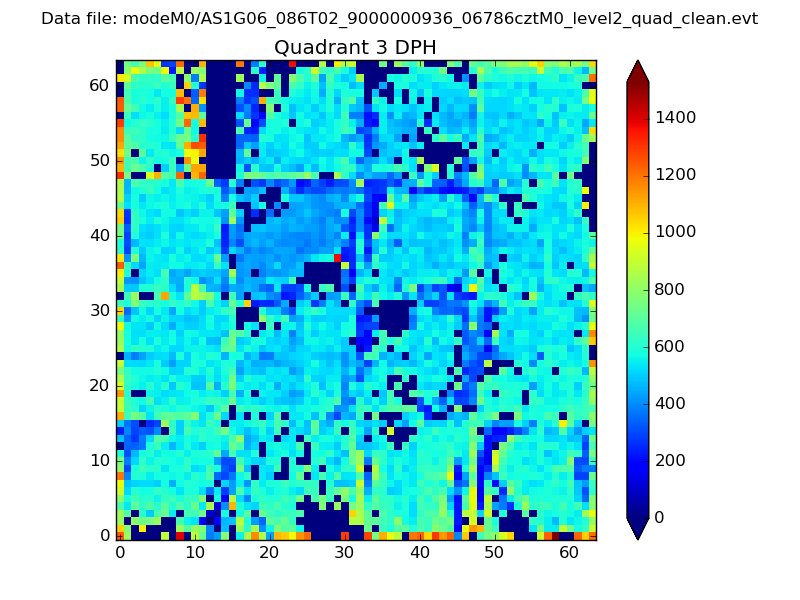 |
 |
Quadrant C |
| Plot type | Count rate plots | Images |
|---|---|---|
| Comparison with Poisson distribution Blue bars denote a histogram of data divided into 1 sec bins. Red curve is a Poisson curve with rate = median count rate of data. |
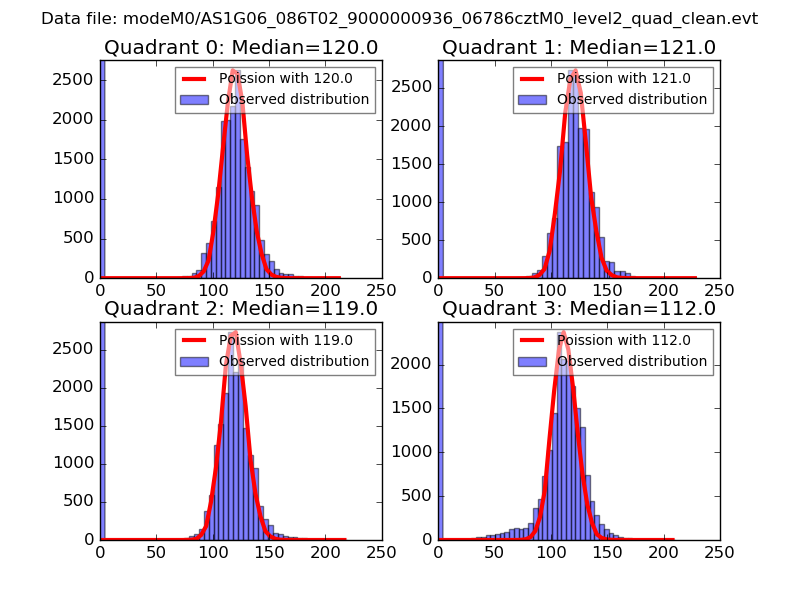 |
 |
| Quadrant-wise count rates Data is divided into 100 sec bins |
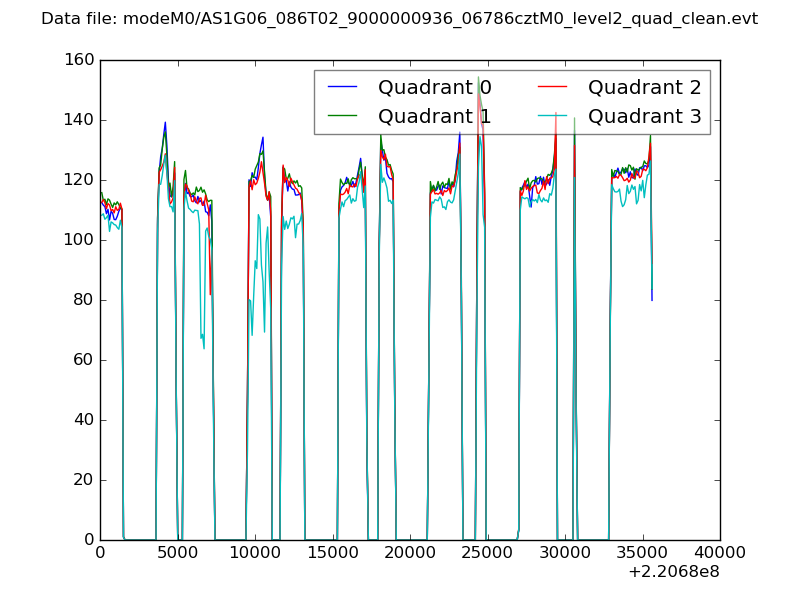 |
|
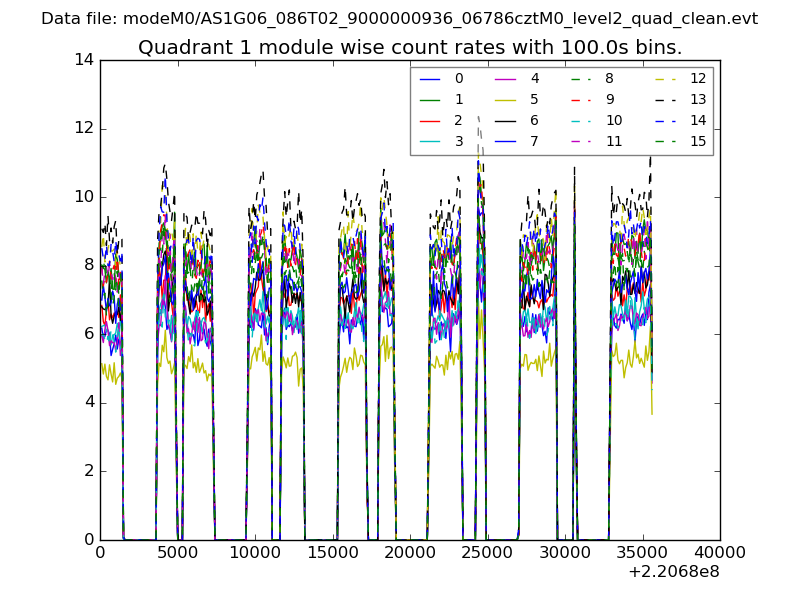
| Module-wise count rates for Quadrant A Data is divided into 100 sec bins |
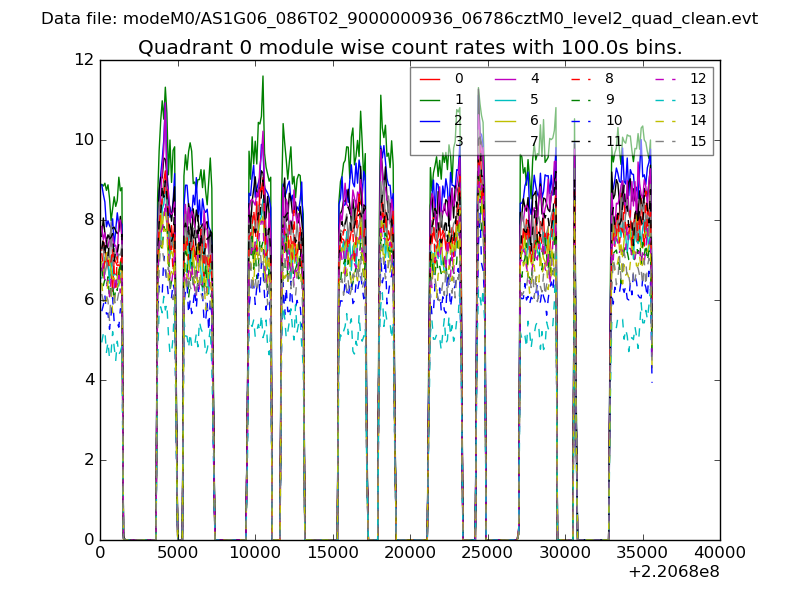 |
 |
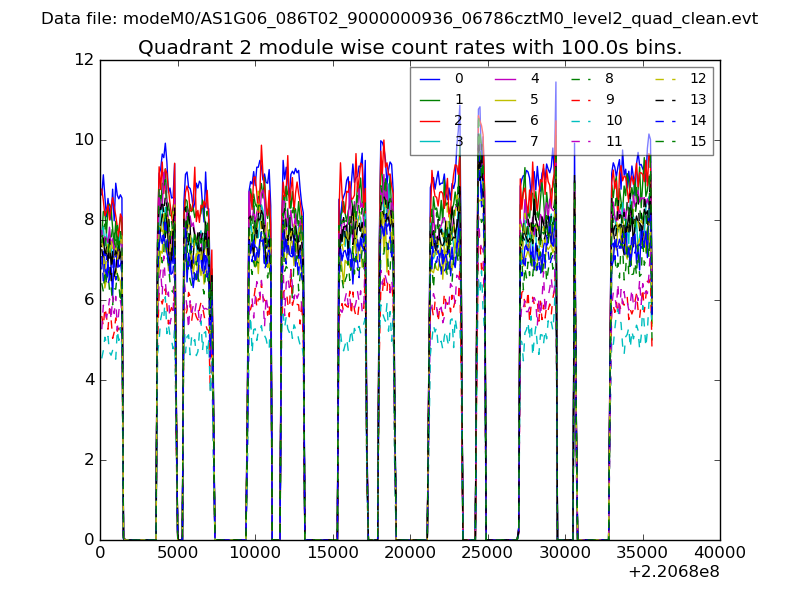
| Module-wise count rates for Quadrant B Data is divided into 100 sec bins |
 |
 |
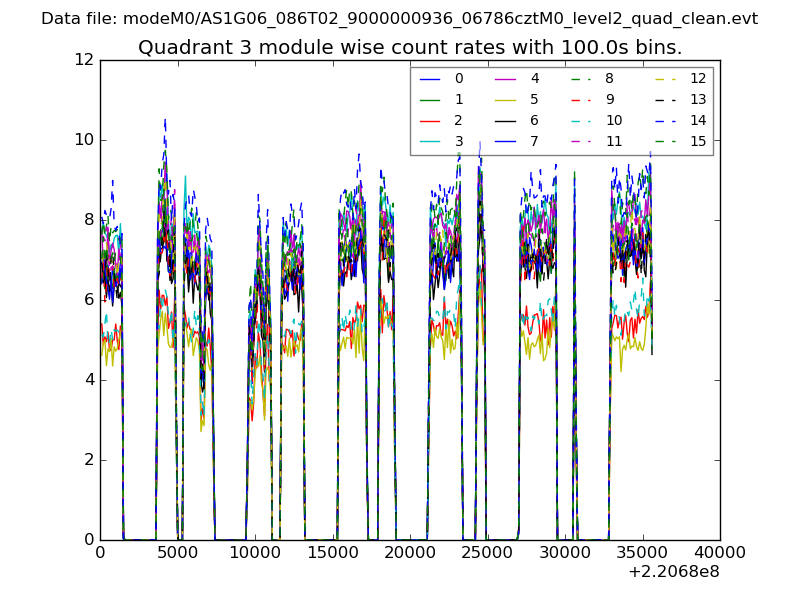
| Module-wise count rates for Quadrant C Data is divided into 100 sec bins |
 |
 |
| Module-wise count rates for Quadrant D Data is divided into 100 sec bins |
 |
 |
| Parameter | Plot |
|---|---|
| CZT HV Monitor | 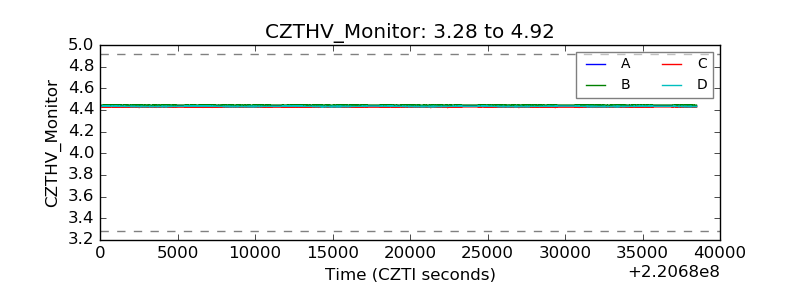 |
| D_VDD | 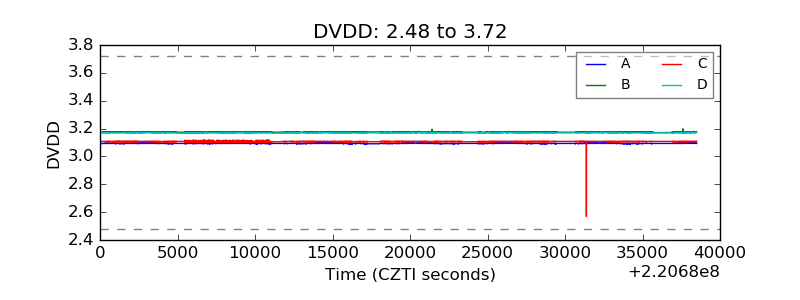 |
| Temperature 1 | 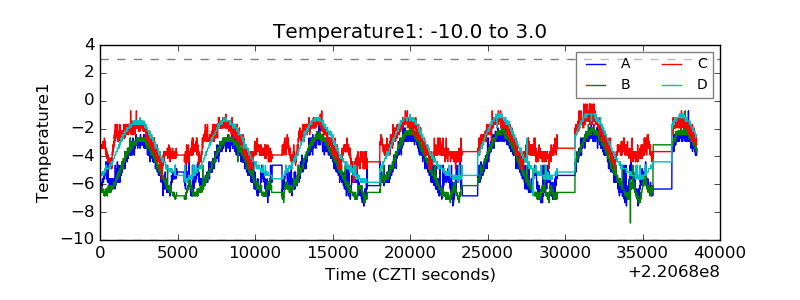 |
| Veto HV Monitor | 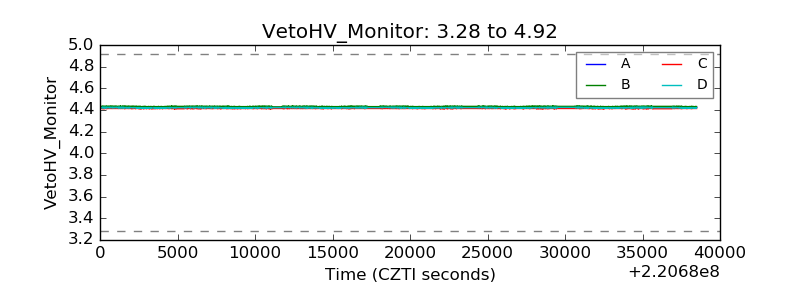 |
| Veto LLD | 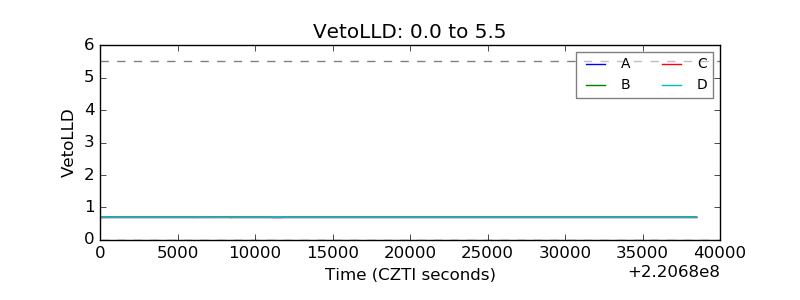 |
| Alpha Counter | 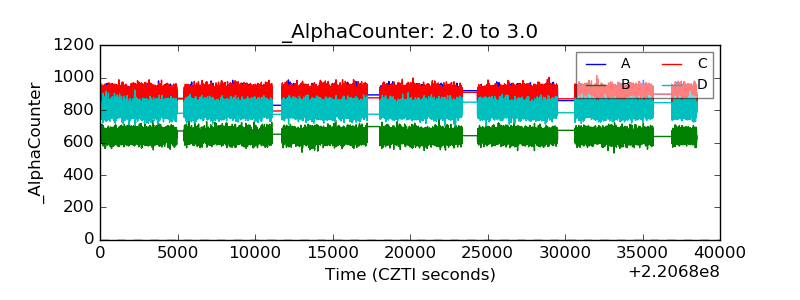 |
| _CPM_Rate | 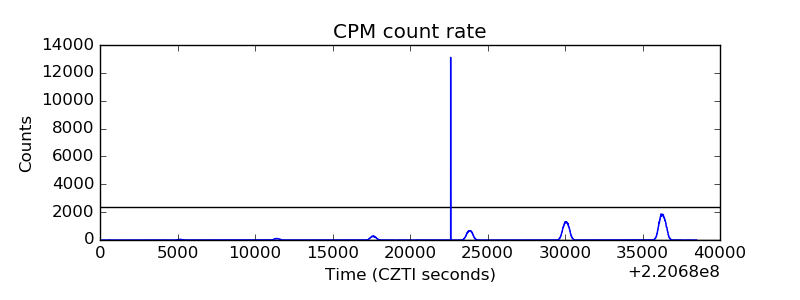 |
| CZT Counter | 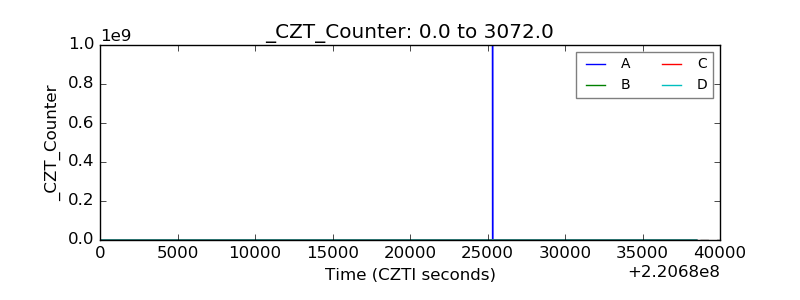 |
| +2.5 Volts monitor |  |
| +5 Volts monitor | 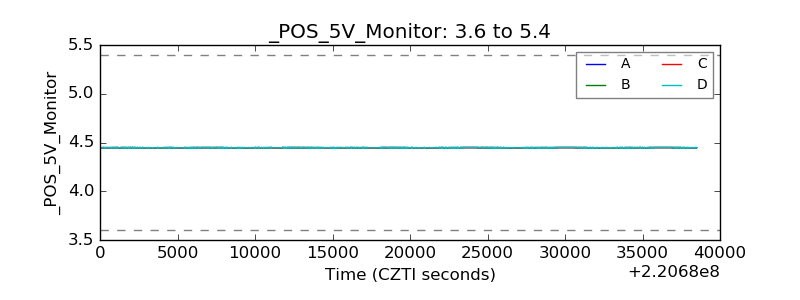 |
| _ROLL_ROT | 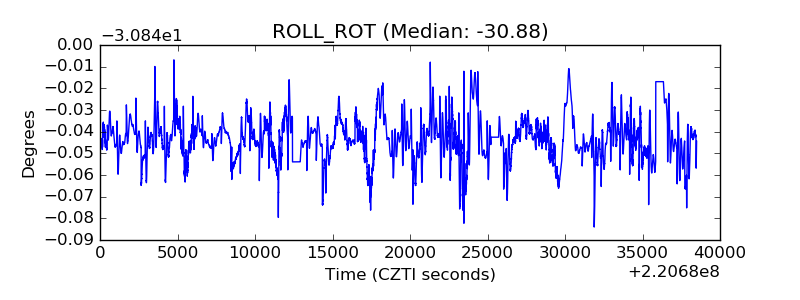 |
| _Roll_DEC | 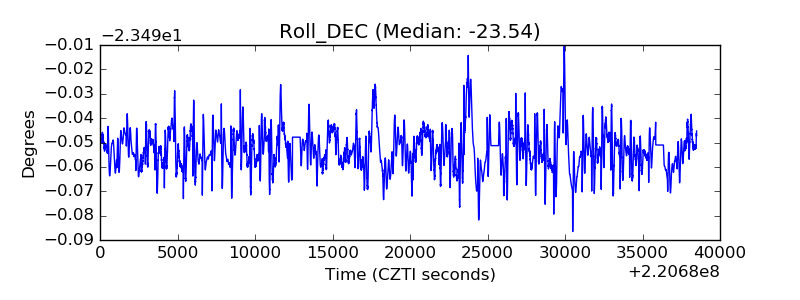 |
| _Roll_RA | 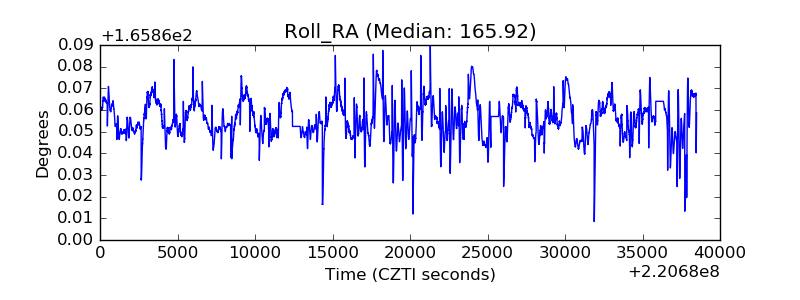 |
| Veto Counter | 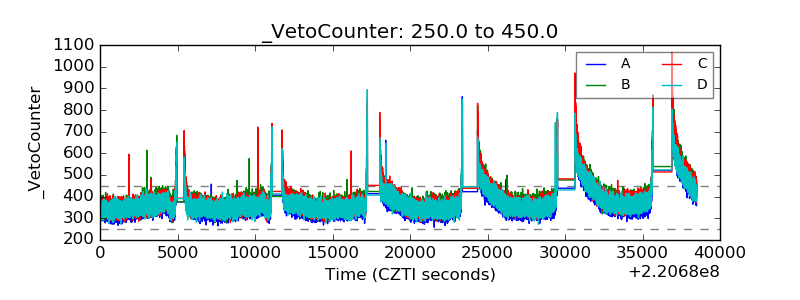 |