| Param | Original file | Final file |
|---|---|---|
| Filename | modeM0/AS1G06_086T02_9000000936_06792cztM0_level2.evt | modeM0/AS1G06_086T02_9000000936_06792cztM0_level2_quad_clean.evt |
| Size (bytes) | 605,675,520 | 107,516,160 |
| Size | 577.6 MB | 102.5 MB |
| Events in quadrant A | 4,255,345 | 661,086 |
| Events in quadrant B | 4,404,575 | 674,603 |
| Events in quadrant C | 4,281,960 | 659,681 |
| Events in quadrant D | 4,782,964 | 628,784 |
| Mode M9 | |||
|---|---|---|---|
| Quadrant | BADHDUFLAG | Total packets | Discarded packets |
| A | 0 | 9 | 0 |
| B | 0 | 9 | 0 |
| C | 0 | 9 | 0 |
| D | 0 | 9 | 0 |
| Mode M0 | |||
|---|---|---|---|
| Quadrant | BADHDUFLAG | Total packets | Discarded packets |
| A | 0 | 19037 | 3 |
| B | 0 | 19308 | 2 |
| C | 0 | 19097 | 2 |
| D | 0 | 20250 | 2 |
| Mode SS | |||
|---|---|---|---|
| Quadrant | BADHDUFLAG | Total packets | Discarded packets |
| A | 0 | 188 | 0 |
| B | 0 | 188 | 0 |
| C | 0 | 188 | 0 |
| D | 0 | 188 | 0 |
| Quadrant | Total seconds | Saturated seconds | Saturation percentage |
|---|---|---|---|
| A | 9109 | 84 | 0.922165% |
| B | 9109 | 120 | 1.317378% |
| C | 9109 | 53 | 0.581842% |
| D | 9109 | 96 | 1.053903% |
Noise dominated data is calculated using 1-second bins in cleaned event files. If a bin has >2000 counts, and if more than 50% of those come from <1% of pixels, then it is considered to be noise-dominated and hence unusable.
| Quadrant | # 1 sec bins | Bins with >0 counts | Bins with >2000 counts | High rate bins dominated by noise | Noise dominated (total time) | Noise dominated (detector-on time) | Marked lightcurve |
|---|---|---|---|---|---|---|---|
| A | 9999 | 9114 | 1 | 1 | 0.01% | 0.01% | 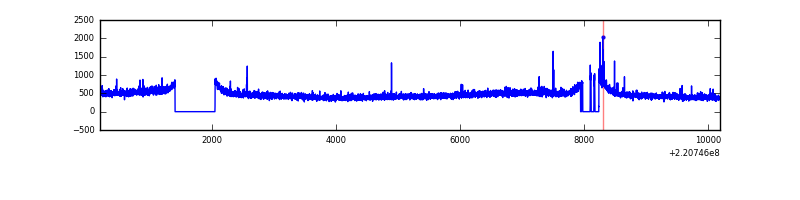 |
| B | 9999 | 9114 | 6 | 6 | 0.06% | 0.07% | 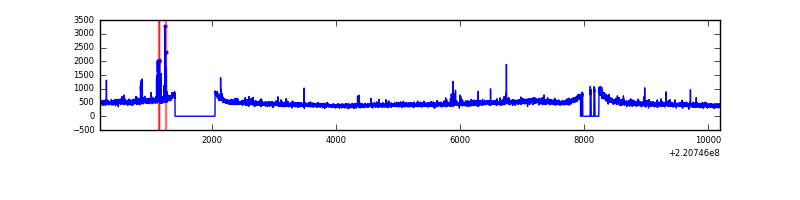 |
| C | 9999 | 9114 | 0 | 0 | 0.00% | 0.00% | 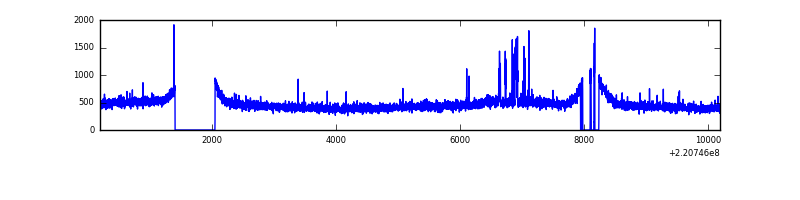 |
| D | 9999 | 9114 | 53 | 53 | 0.53% | 0.58% | 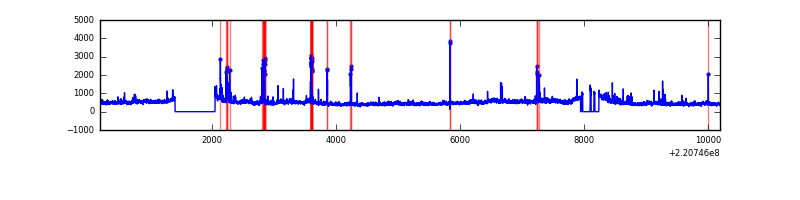 |
Top three noisy pixels from each quadrant. If the there are fewer than three noisy pixels in the level2.evt file, extra rows are filled as -1
| Pixel properties | Quadrant properties | ||||||
|---|---|---|---|---|---|---|---|
| Quadrant | DetID | PixID | Counts | Sigma | Mean | Median | Sigma |
| A | 8 | 15 | 26828 | 114.26 | 1088 | 1061 | 225.5 |
| A | 13 | 248 | 25149 | 106.82 | 1088 | 1061 | 225.5 |
| A | 0 | 226 | 10429 | 41.54 | 1088 | 1061 | 225.5 |
| B | 4 | 48 | 53773 | 248.03 | 1102 | 1075 | 212.5 |
| B | 4 | 81 | 28242 | 127.87 | 1102 | 1075 | 212.5 |
| B | 0 | 228 | 24793 | 111.63 | 1102 | 1075 | 212.5 |
| C | 12 | 16 | 74658 | 294.68 | 1061 | 1066 | 249.7 |
| C | 9 | 247 | 52486 | 205.9 | 1061 | 1066 | 249.7 |
| C | 13 | 61 | 8402 | 29.37 | 1061 | 1066 | 249.7 |
| D | 8 | 195 | 513313 | 1984.41 | 1052 | 1018 | 258.2 |
| D | 2 | 14 | 101408 | 388.87 | 1052 | 1018 | 258.2 |
| D | 13 | 169 | 100998 | 387.28 | 1052 | 1018 | 258.2 |
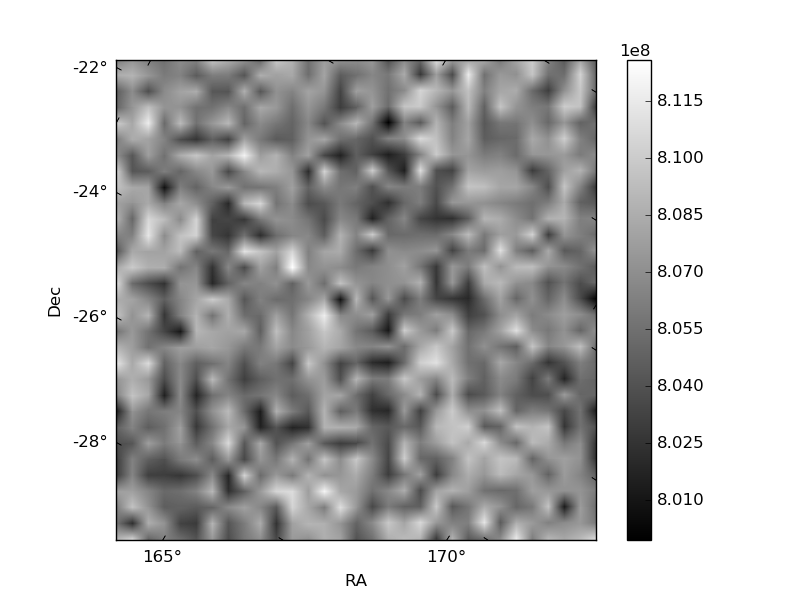
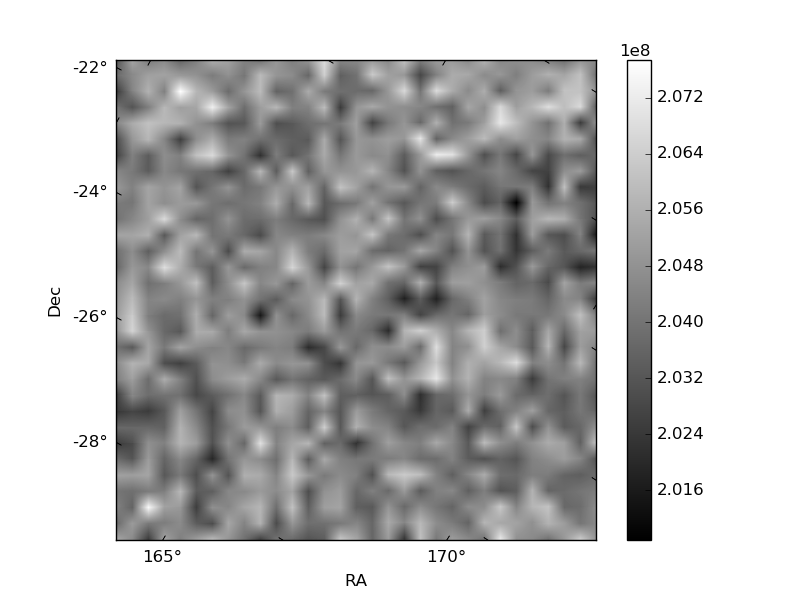
Histogram calculated using DETX and DETY for each event in the final _common_clean file
| Quadrant A | 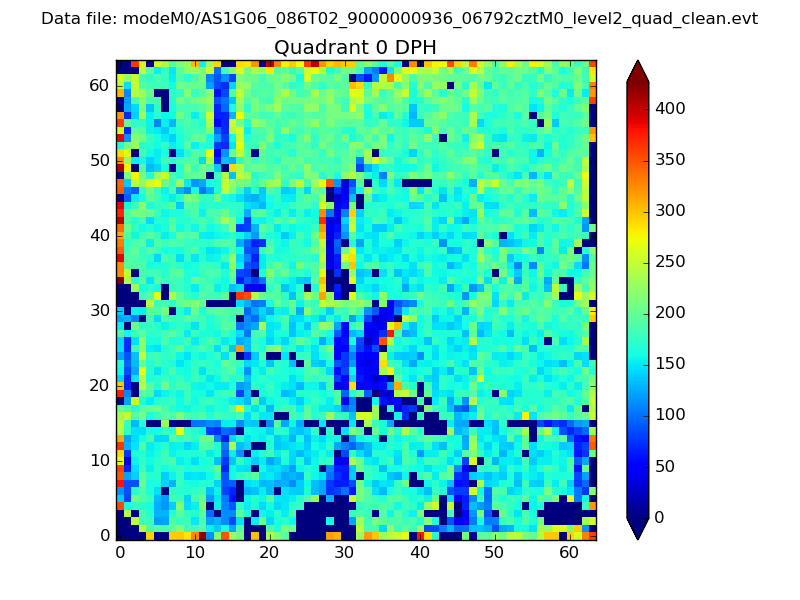 |
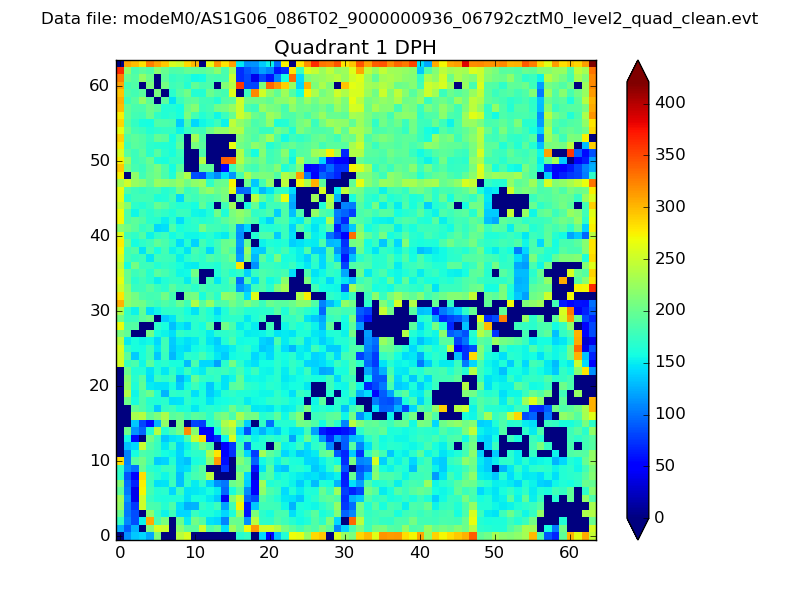 |
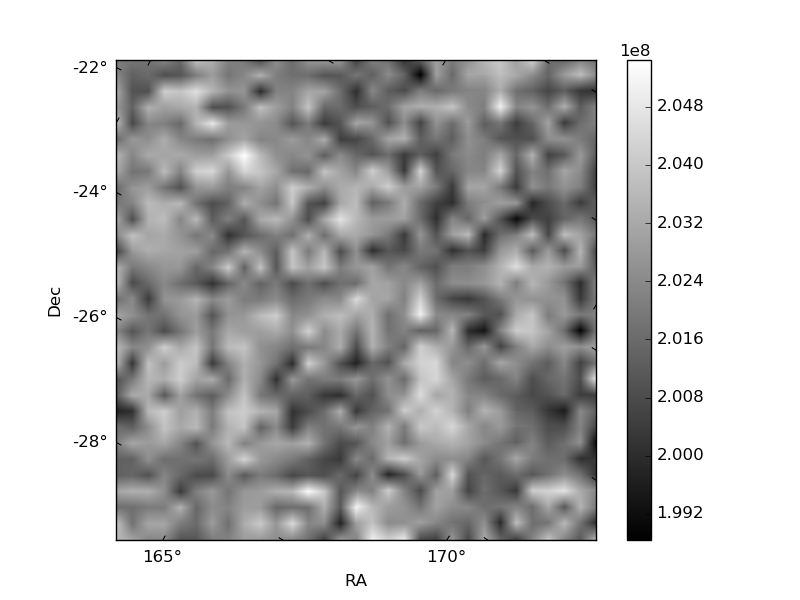
Quadrant B |
|---|---|---|---|
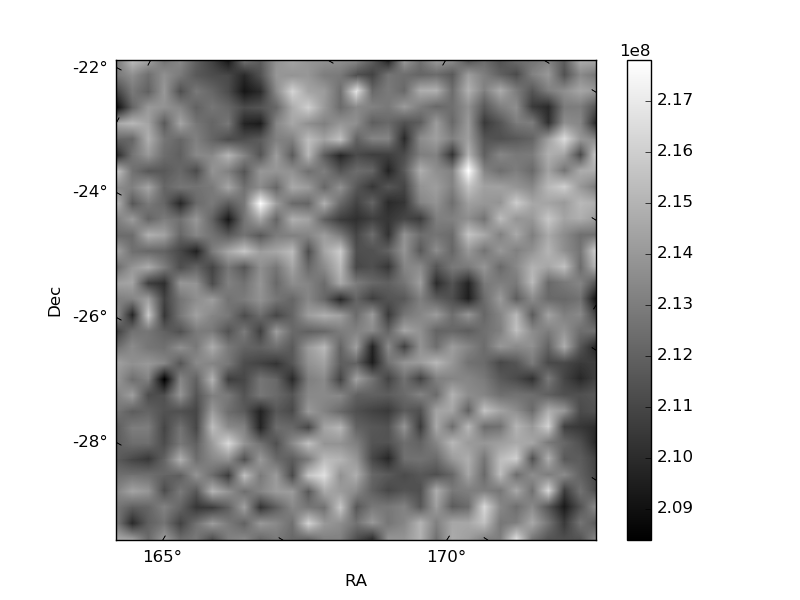
| Quadrant D | 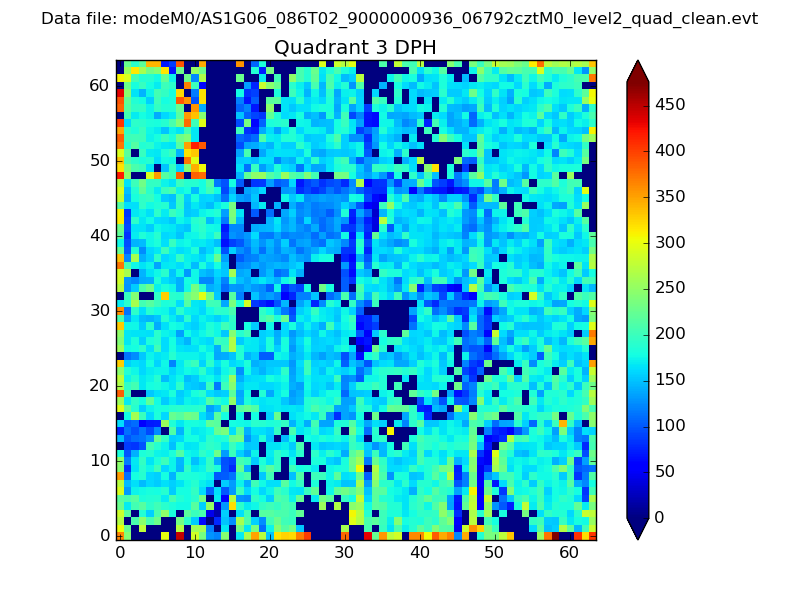 |
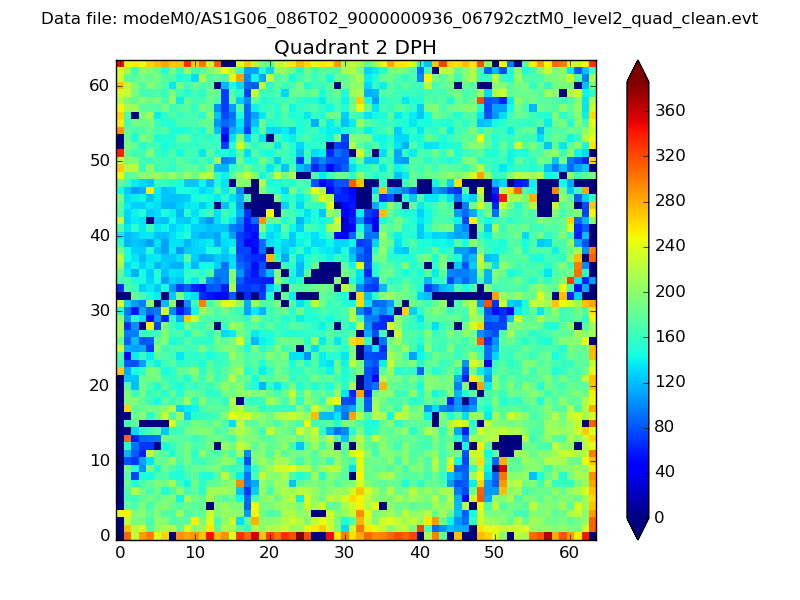 |
Quadrant C |
| Plot type | Count rate plots | Images |
|---|---|---|
| Comparison with Poisson distribution Blue bars denote a histogram of data divided into 1 sec bins. Red curve is a Poisson curve with rate = median count rate of data. |
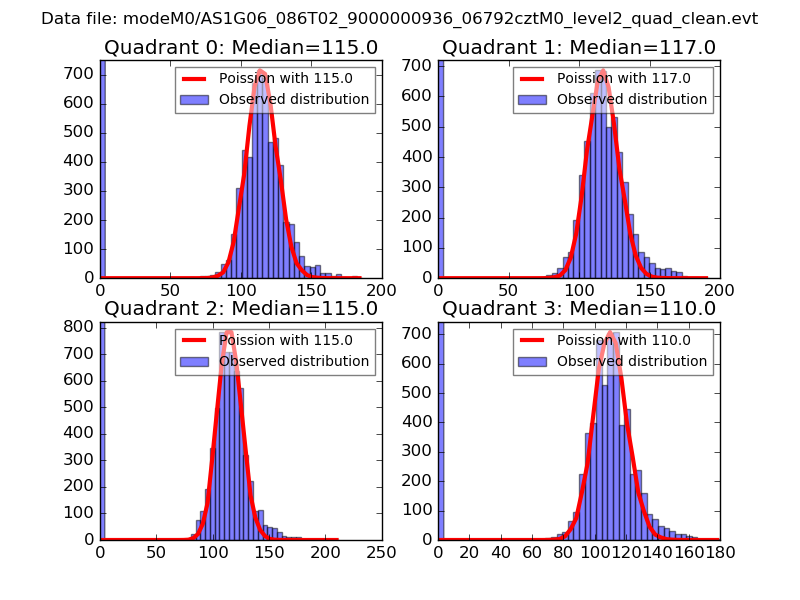 |
 |
| Quadrant-wise count rates Data is divided into 100 sec bins |
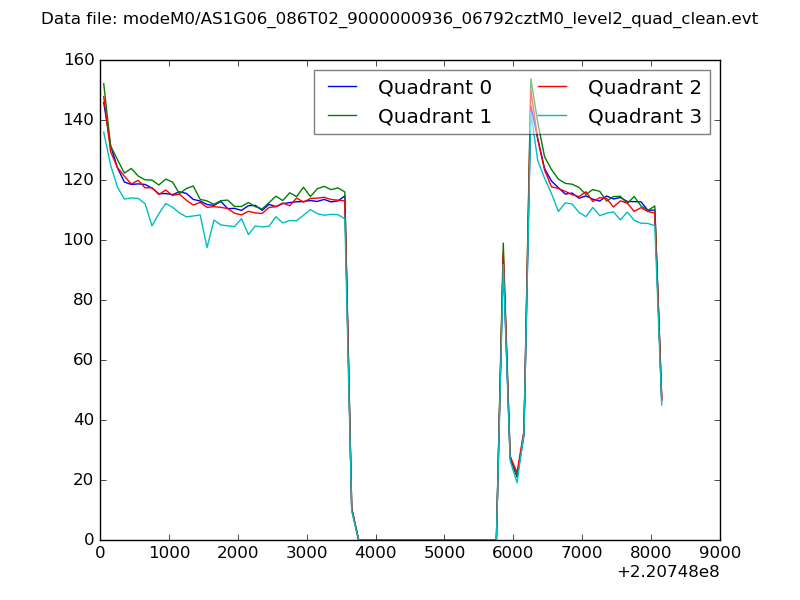 |
|
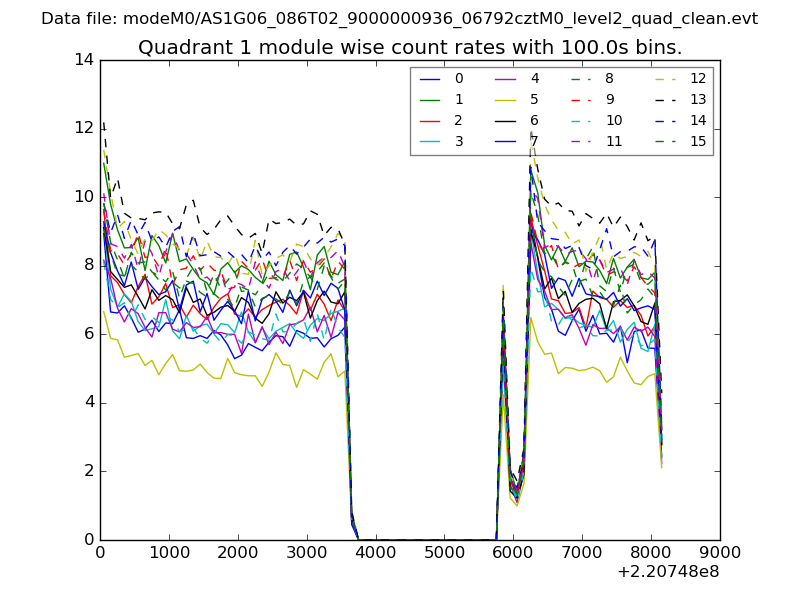
| Module-wise count rates for Quadrant A Data is divided into 100 sec bins |
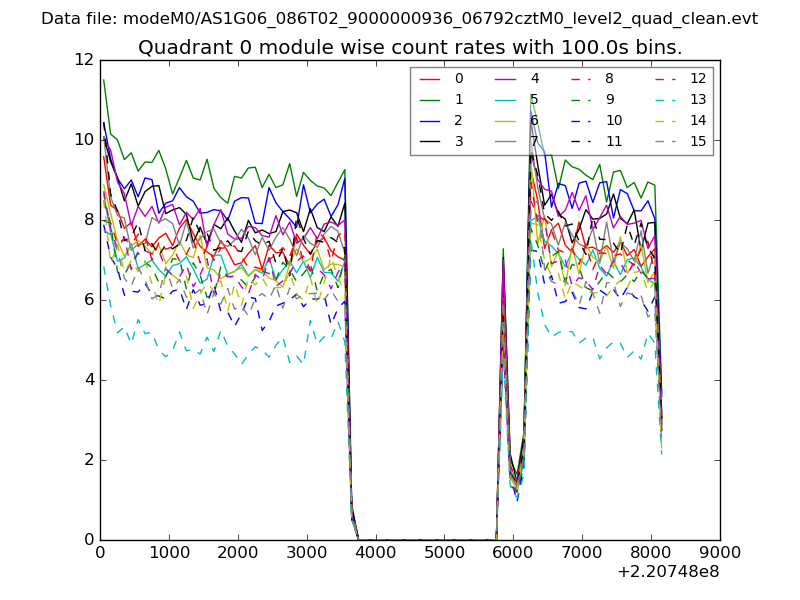 |
 |
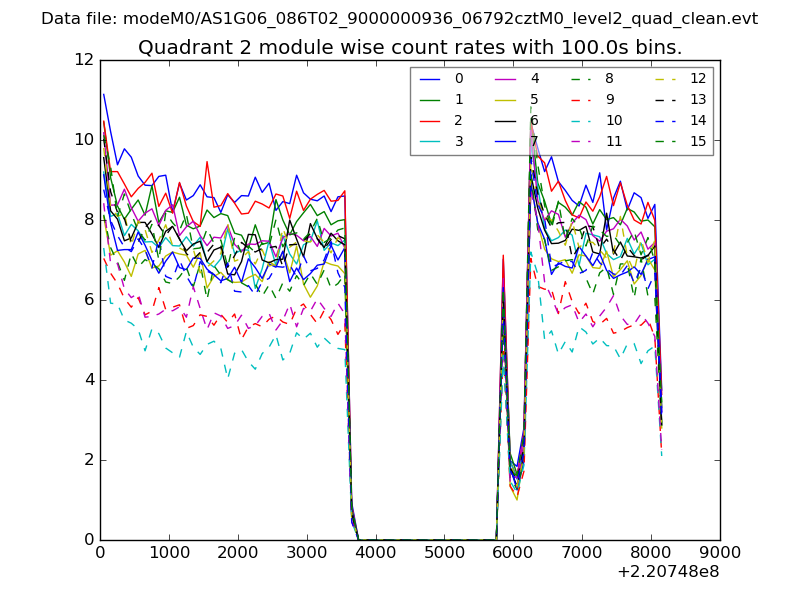
| Module-wise count rates for Quadrant B Data is divided into 100 sec bins |
 |
 |
| Module-wise count rates for Quadrant C Data is divided into 100 sec bins |
 |
 |
| Module-wise count rates for Quadrant D Data is divided into 100 sec bins |
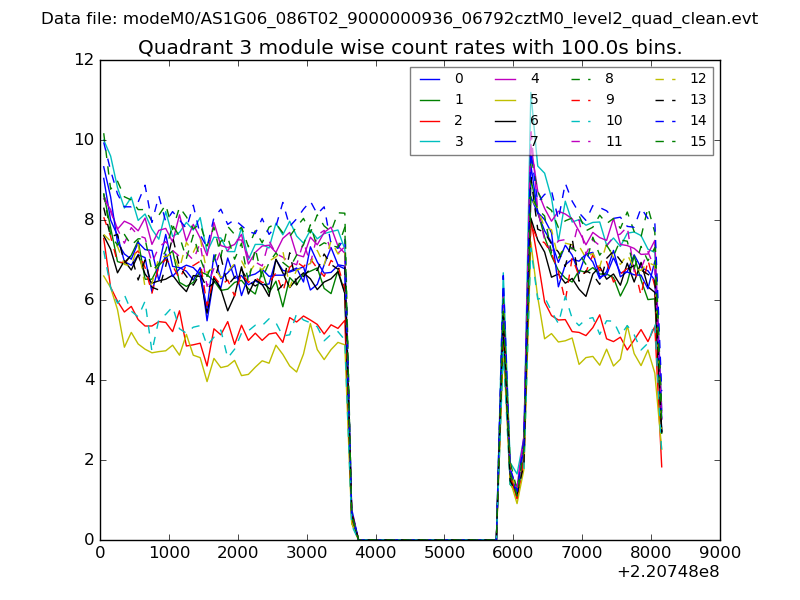 |
 |
| Parameter | Plot |
|---|---|
| CZT HV Monitor | 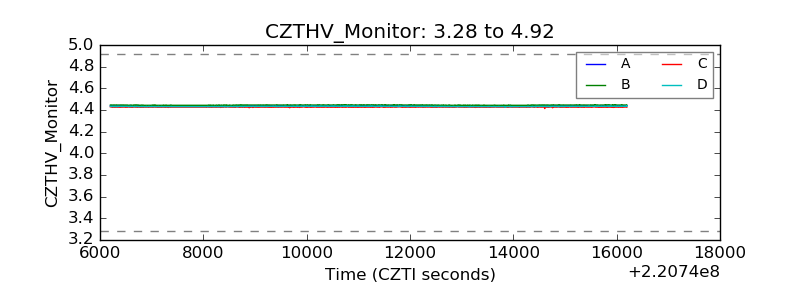 |
| D_VDD | 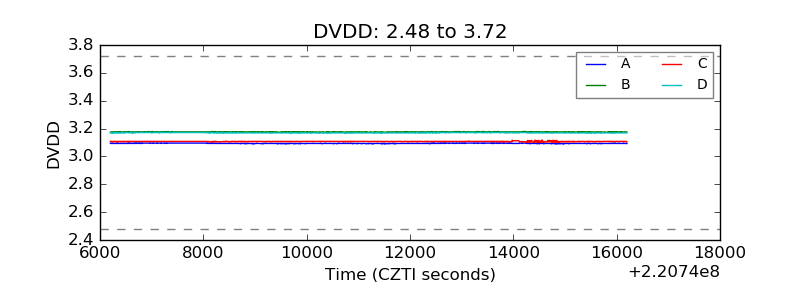 |
| Temperature 1 | 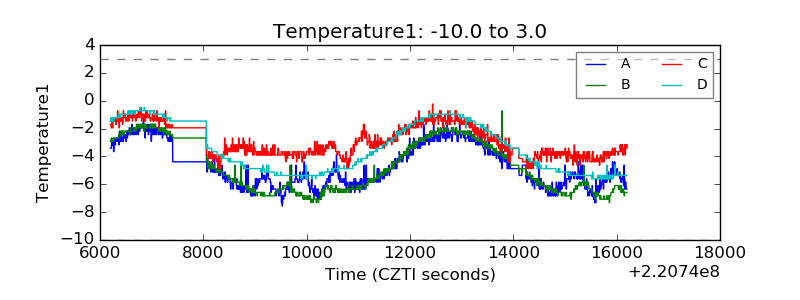 |
| Veto HV Monitor | 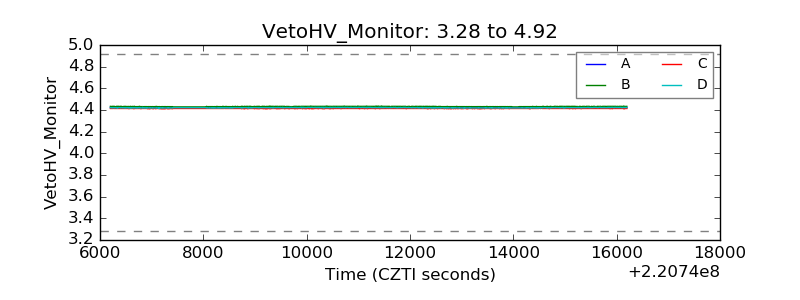 |
| Veto LLD | 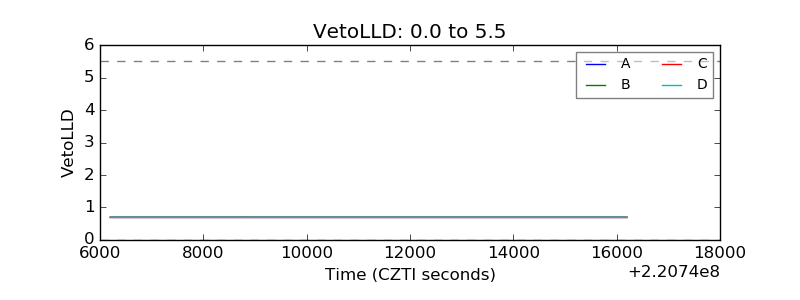 |
| Alpha Counter | 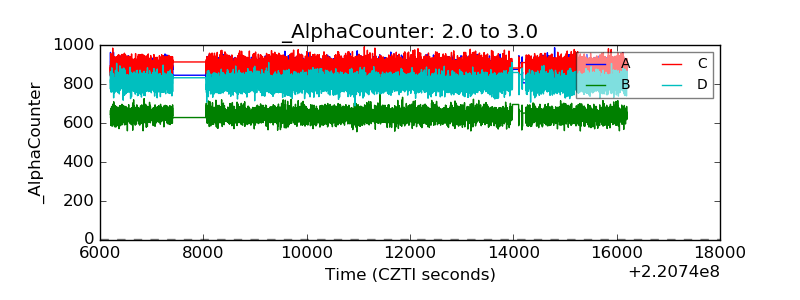 |
| _CPM_Rate | 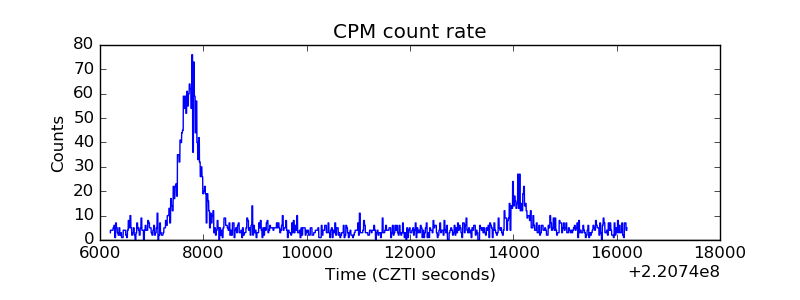 |
| CZT Counter | 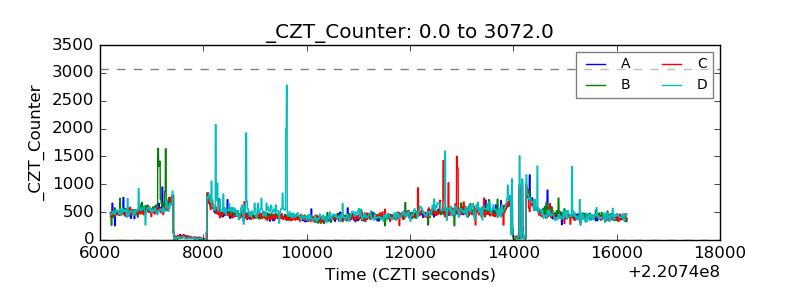 |
| +2.5 Volts monitor |  |
| +5 Volts monitor | 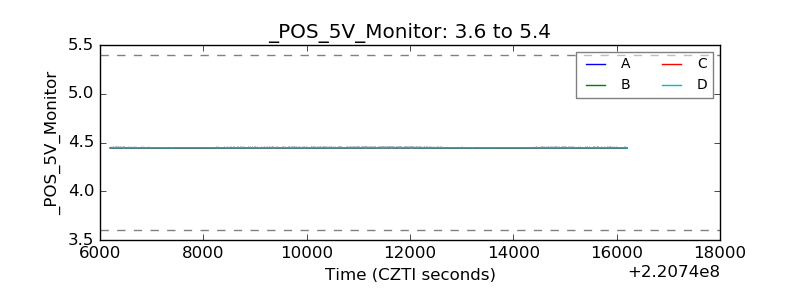 |
| _ROLL_ROT | 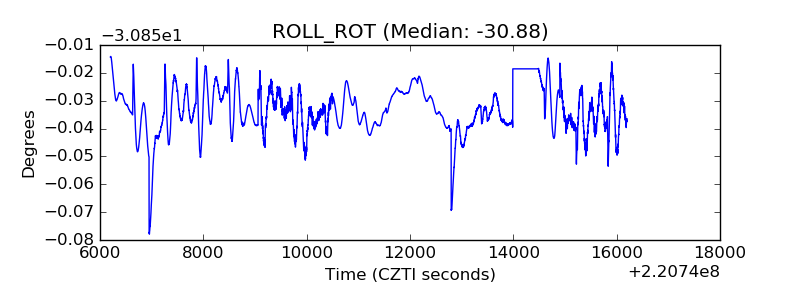 |
| _Roll_DEC | 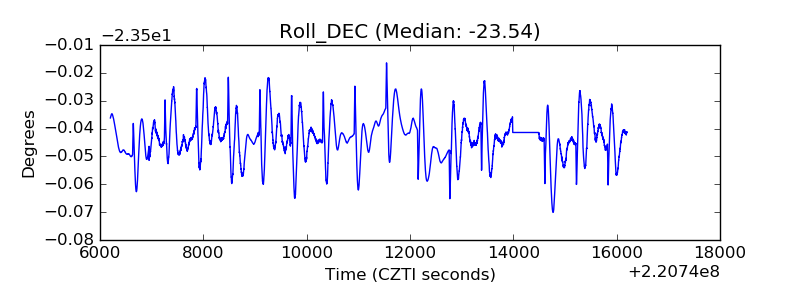 |
| _Roll_RA | 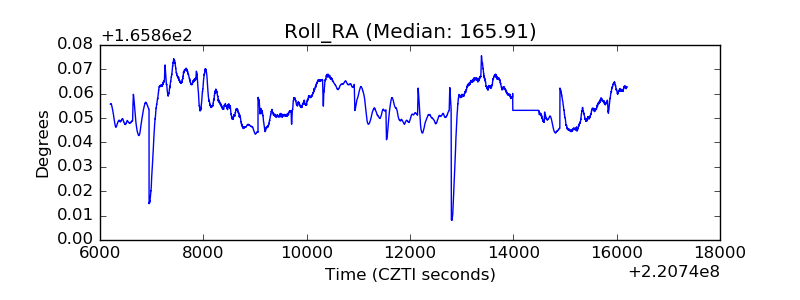 |
| Veto Counter | 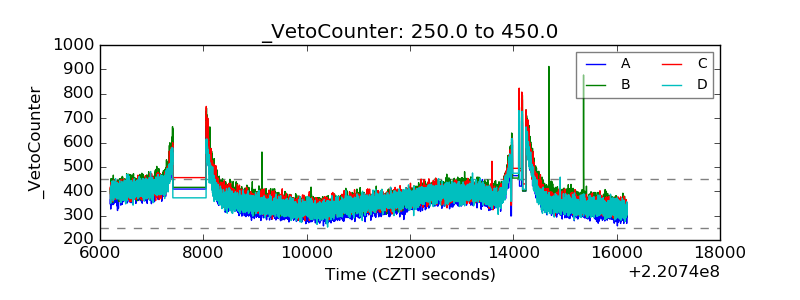 |