| Param | Original file | Final file |
|---|---|---|
| Filename | modeM0/AS1G06_086T02_9000000936_06793cztM0_level2.evt | modeM0/AS1G06_086T02_9000000936_06793cztM0_level2_quad_clean.evt |
| Size (bytes) | 504,699,840 | 100,235,520 |
| Size | 481.3 MB | 95.6 MB |
| Events in quadrant A | 3,431,632 | 628,951 |
| Events in quadrant B | 4,093,269 | 641,603 |
| Events in quadrant C | 3,446,167 | 626,876 |
| Events in quadrant D | 3,791,310 | 603,422 |
| Mode M9 | |||
|---|---|---|---|
| Quadrant | BADHDUFLAG | Total packets | Discarded packets |
| A | 0 | 1 | 0 |
| B | 0 | 1 | 0 |
| C | 0 | 1 | 0 |
| D | 0 | 1 | 0 |
| Mode M0 | |||
|---|---|---|---|
| Quadrant | BADHDUFLAG | Total packets | Discarded packets |
| A | 0 | 15707 | 3 |
| B | 0 | 17609 | 2 |
| C | 0 | 15748 | 2 |
| D | 0 | 16492 | 2 |
| Mode SS | |||
|---|---|---|---|
| Quadrant | BADHDUFLAG | Total packets | Discarded packets |
| A | 0 | 158 | 0 |
| B | 0 | 158 | 0 |
| C | 0 | 158 | 0 |
| D | 0 | 158 | 0 |
| Quadrant | Total seconds | Saturated seconds | Saturation percentage |
|---|---|---|---|
| A | 7681 | 55 | 0.716053% |
| B | 7681 | 279 | 3.632340% |
| C | 7681 | 57 | 0.742091% |
| D | 7681 | 41 | 0.533785% |
Noise dominated data is calculated using 1-second bins in cleaned event files. If a bin has >2000 counts, and if more than 50% of those come from <1% of pixels, then it is considered to be noise-dominated and hence unusable.
| Quadrant | # 1 sec bins | Bins with >0 counts | Bins with >2000 counts | High rate bins dominated by noise | Noise dominated (total time) | Noise dominated (detector-on time) | Marked lightcurve |
|---|---|---|---|---|---|---|---|
| A | 7876 | 7683 | 0 | 0 | 0.00% | 0.00% | 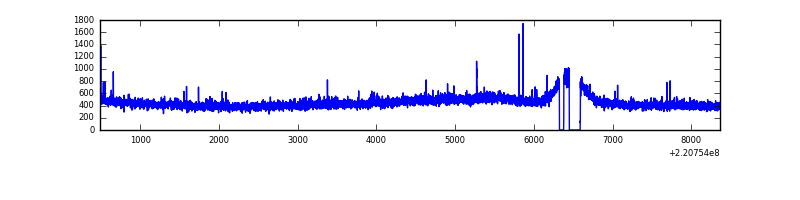 |
| B | 7876 | 7683 | 149 | 149 | 1.89% | 1.94% | 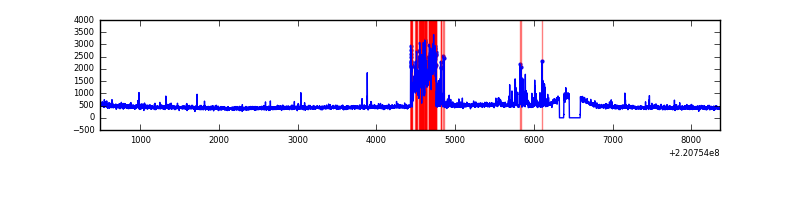 |
| C | 7876 | 7683 | 2 | 2 | 0.03% | 0.03% | 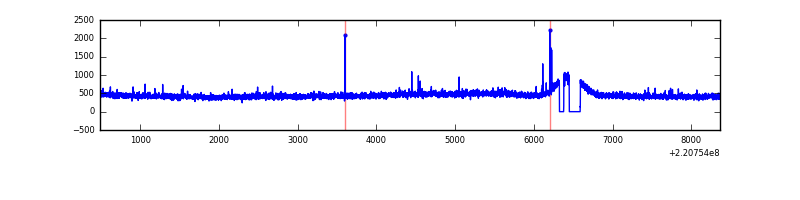 |
| D | 7876 | 7683 | 3 | 3 | 0.04% | 0.04% | 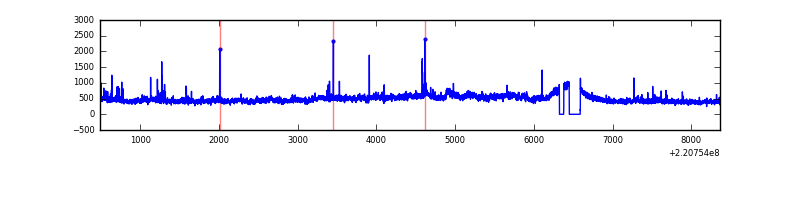 |
Top three noisy pixels from each quadrant. If the there are fewer than three noisy pixels in the level2.evt file, extra rows are filled as -1
| Pixel properties | Quadrant properties | ||||||
|---|---|---|---|---|---|---|---|
| Quadrant | DetID | PixID | Counts | Sigma | Mean | Median | Sigma |
| A | 8 | 15 | 15163 | 78.39 | 884 | 863 | 182.4 |
| A | 13 | 248 | 11809 | 60.0 | 884 | 863 | 182.4 |
| A | 0 | 226 | 8332 | 40.94 | 884 | 863 | 182.4 |
| B | 0 | 228 | 618962 | 3574.88 | 884 | 860 | 172.9 |
| B | 4 | 81 | 47488 | 269.68 | 884 | 860 | 172.9 |
| B | 12 | 111 | 17625 | 96.96 | 884 | 860 | 172.9 |
| C | 9 | 247 | 40373 | 194.96 | 864 | 867 | 202.6 |
| C | 12 | 16 | 23153 | 109.98 | 864 | 867 | 202.6 |
| C | 12 | 4 | 6985 | 30.19 | 864 | 867 | 202.6 |
| D | 8 | 195 | 486656 | 2281.22 | 860 | 832 | 213.0 |
| D | 2 | 14 | 27399 | 124.75 | 860 | 832 | 213.0 |
| D | 13 | 169 | 26159 | 118.92 | 860 | 832 | 213.0 |
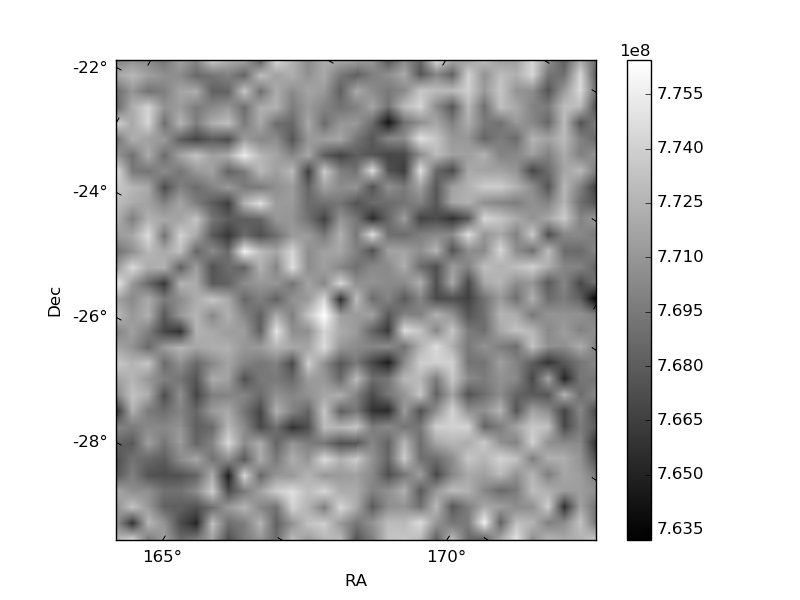
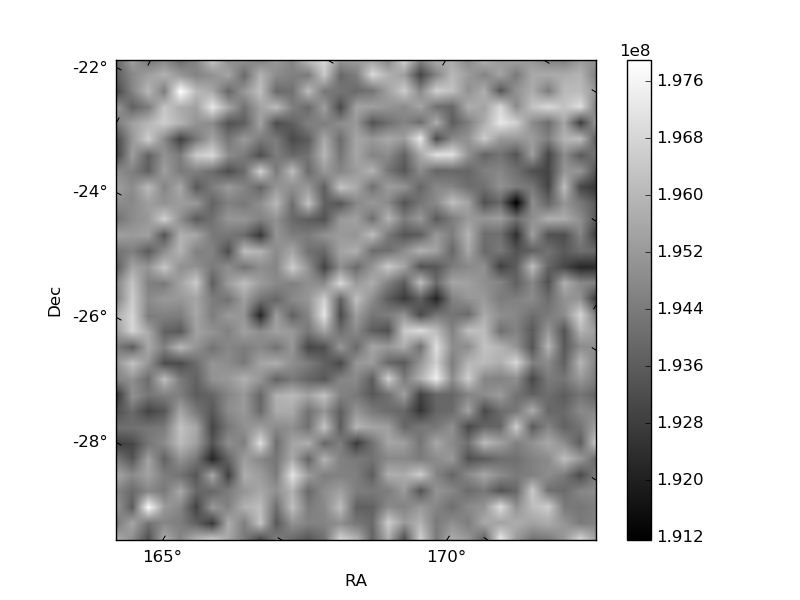
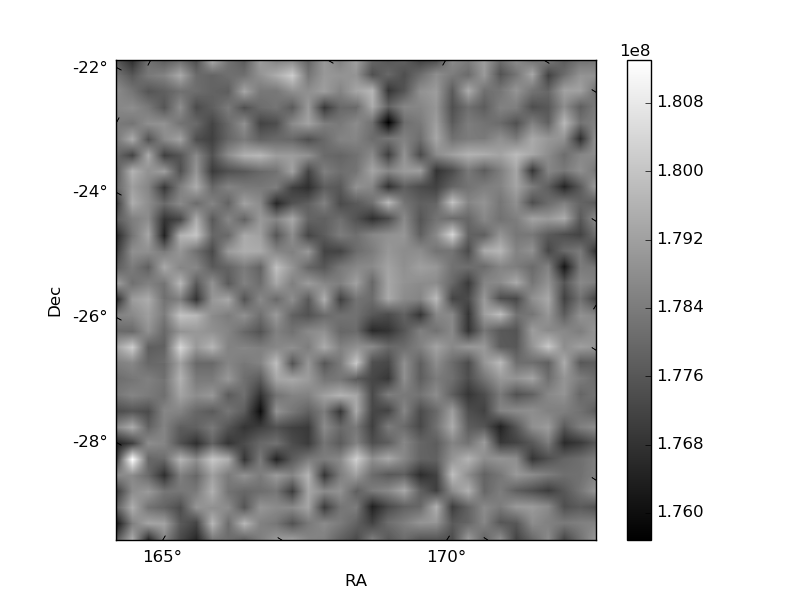
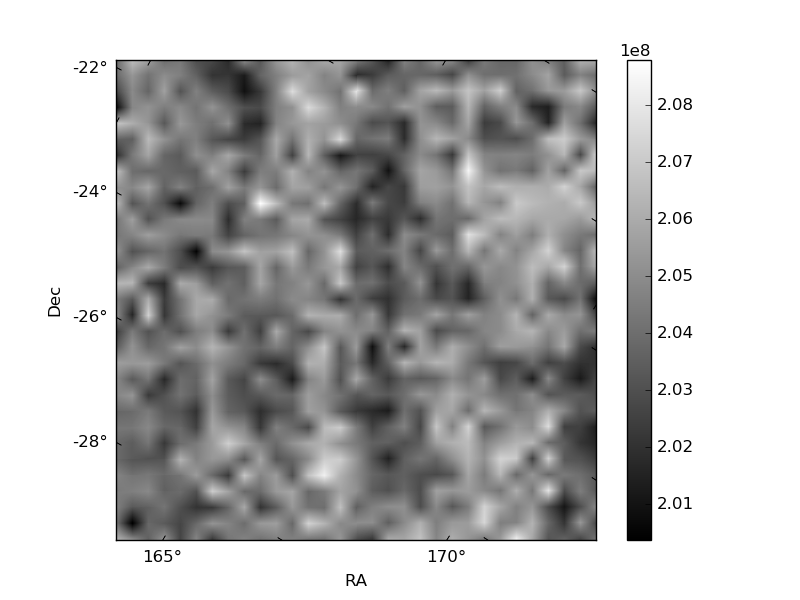
Histogram calculated using DETX and DETY for each event in the final _common_clean file
| Quadrant A | 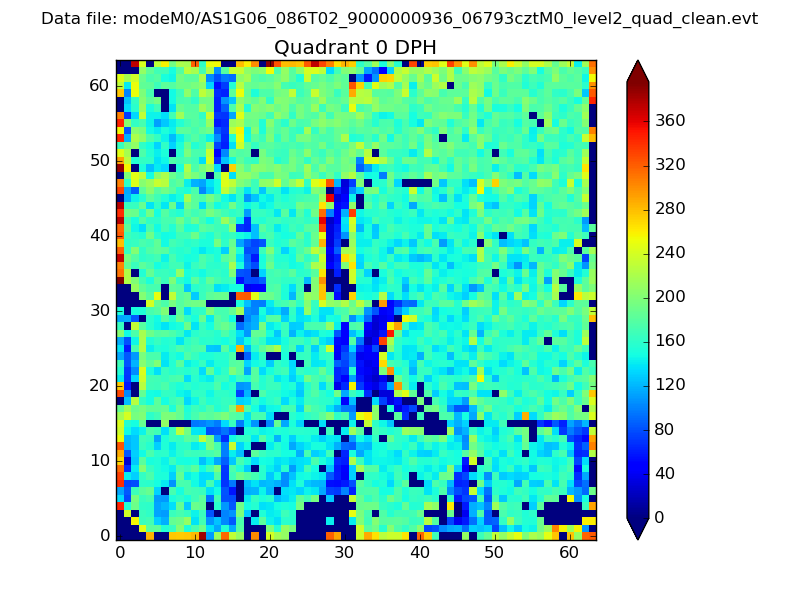 |
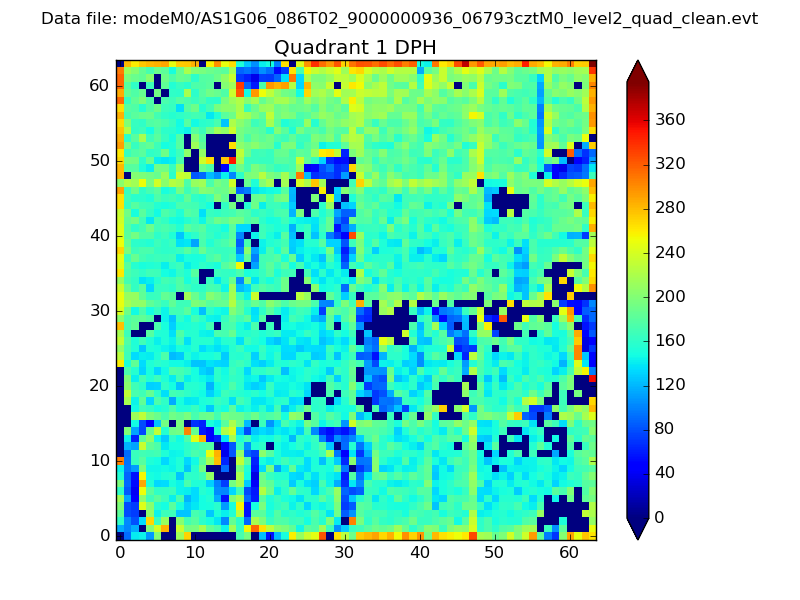 |
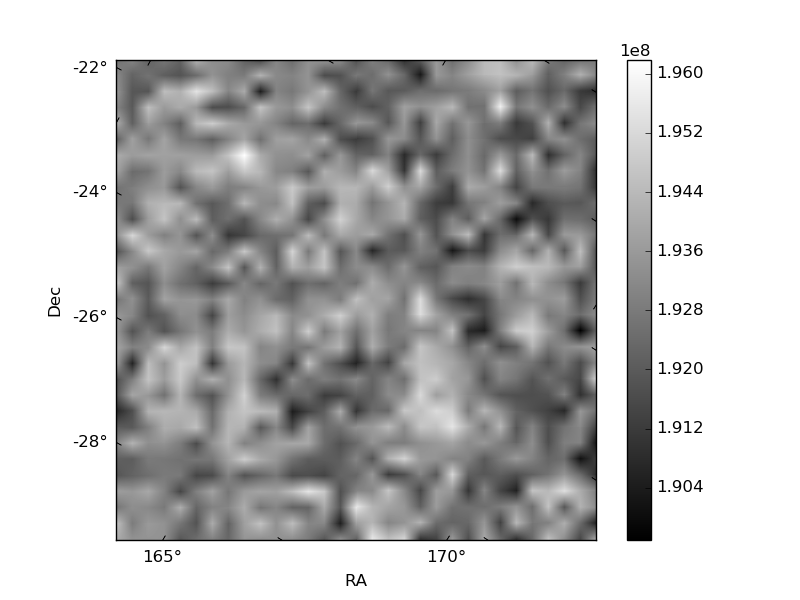
Quadrant B |
|---|---|---|---|
| Quadrant D | 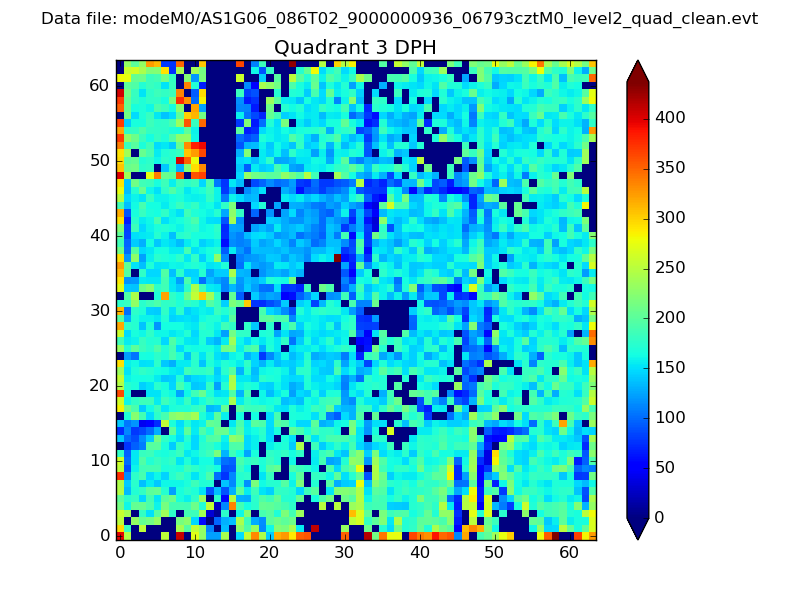 |
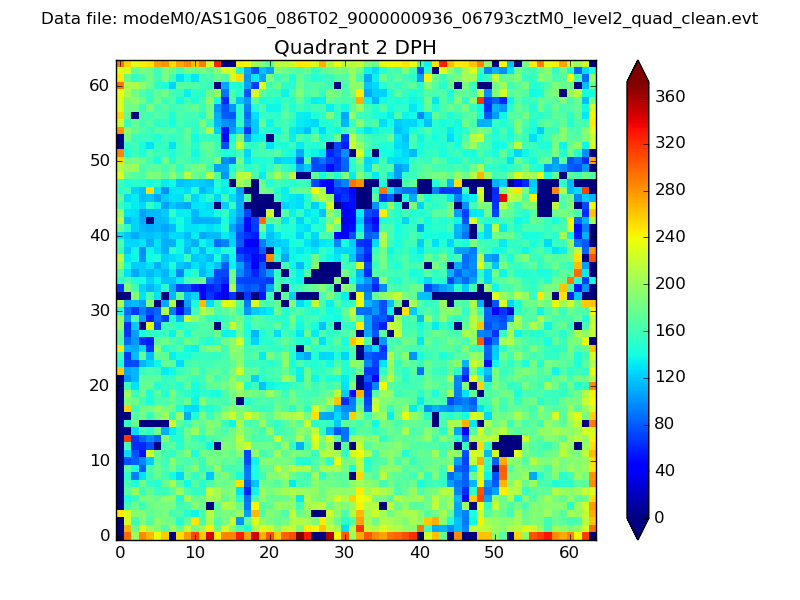 |
Quadrant C |
| Plot type | Count rate plots | Images |
|---|---|---|
| Comparison with Poisson distribution Blue bars denote a histogram of data divided into 1 sec bins. Red curve is a Poisson curve with rate = median count rate of data. |
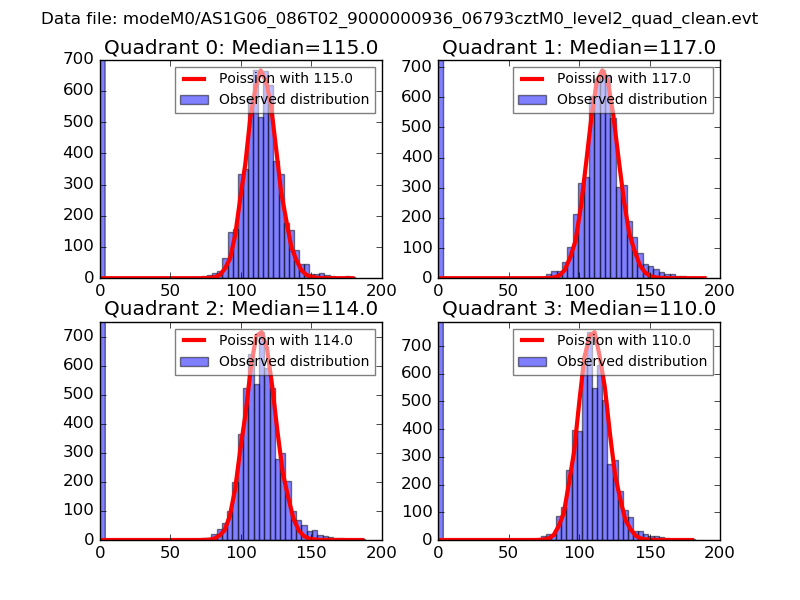 |
 |
| Quadrant-wise count rates Data is divided into 100 sec bins |
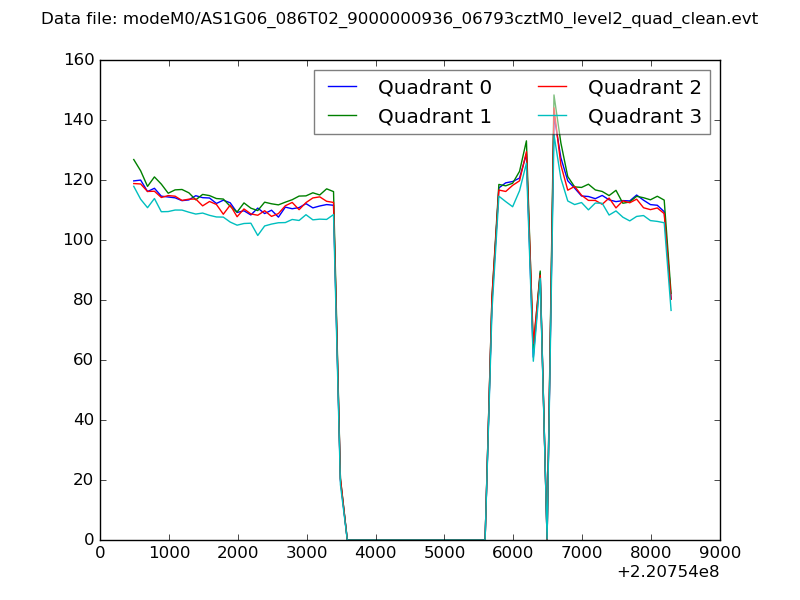 |
|
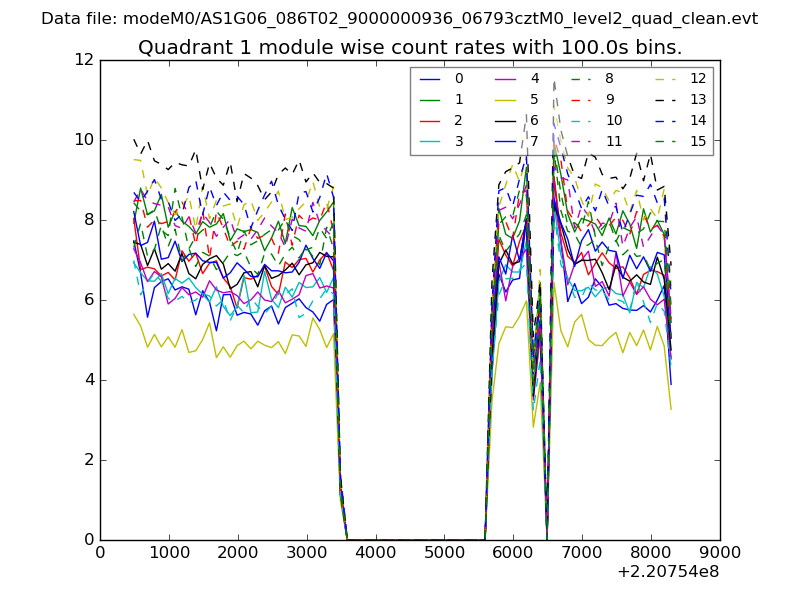
| Module-wise count rates for Quadrant A Data is divided into 100 sec bins |
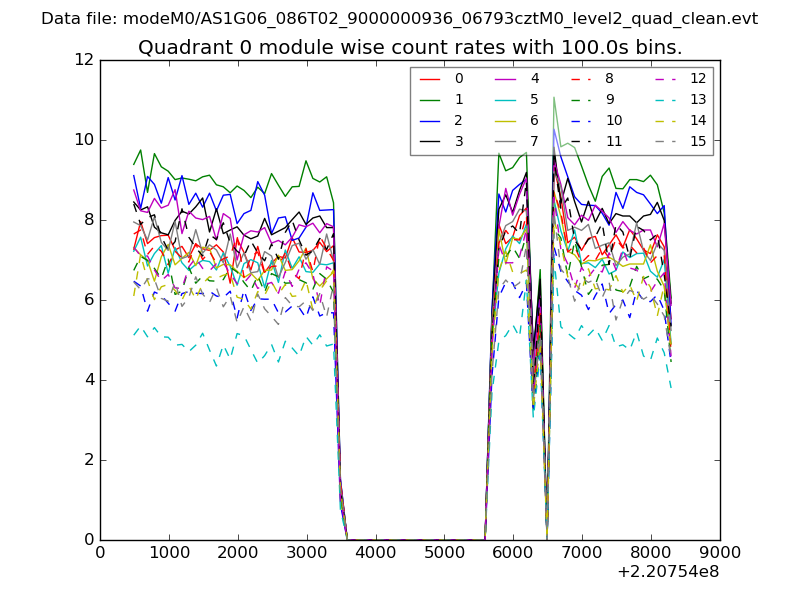 |
 |
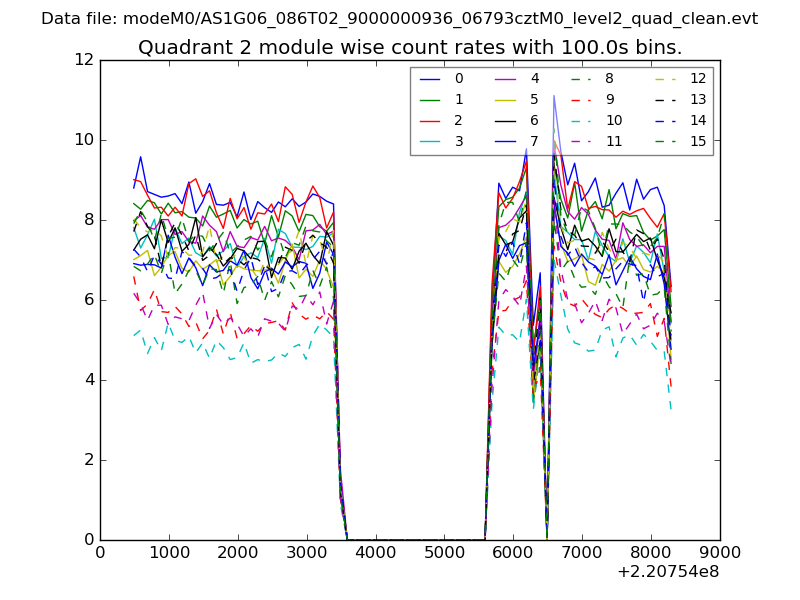
| Module-wise count rates for Quadrant B Data is divided into 100 sec bins |
 |
 |
| Module-wise count rates for Quadrant C Data is divided into 100 sec bins |
 |
 |
| Module-wise count rates for Quadrant D Data is divided into 100 sec bins |
 |
 |
| Parameter | Plot |
|---|---|
| CZT HV Monitor | 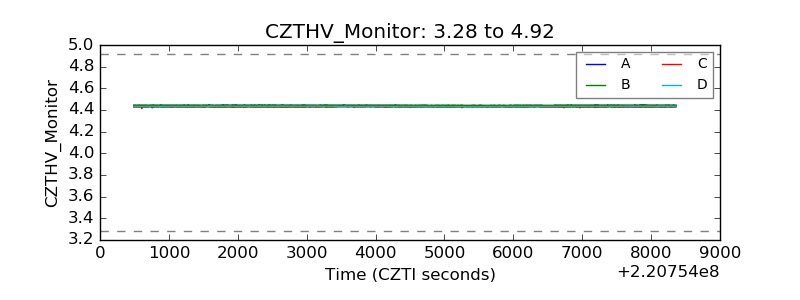 |
| D_VDD | 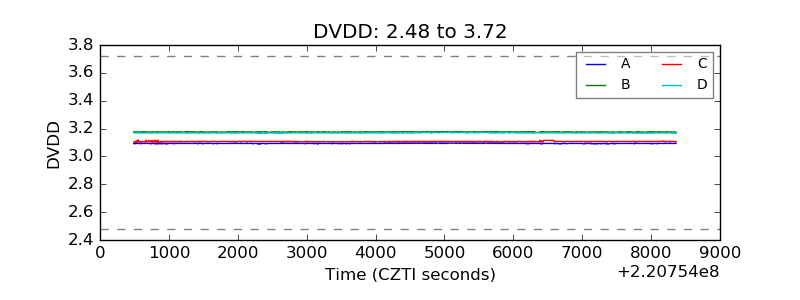 |
| Temperature 1 | 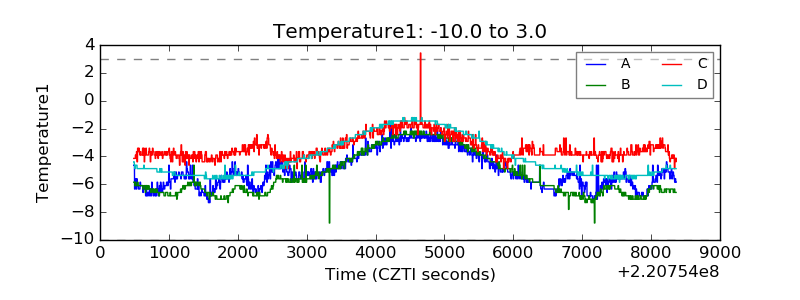 |
| Veto HV Monitor |  |
| Veto LLD | 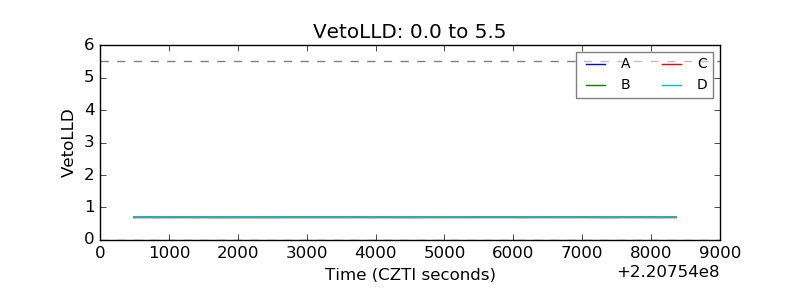 |
| Alpha Counter | 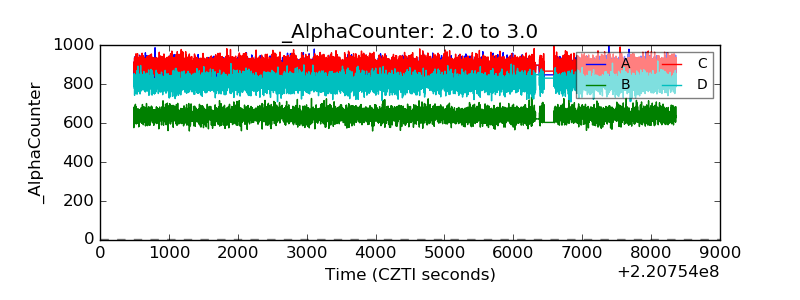 |
| _CPM_Rate | 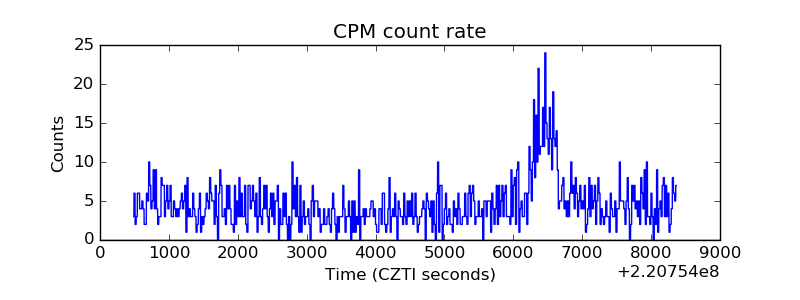 |
| CZT Counter | 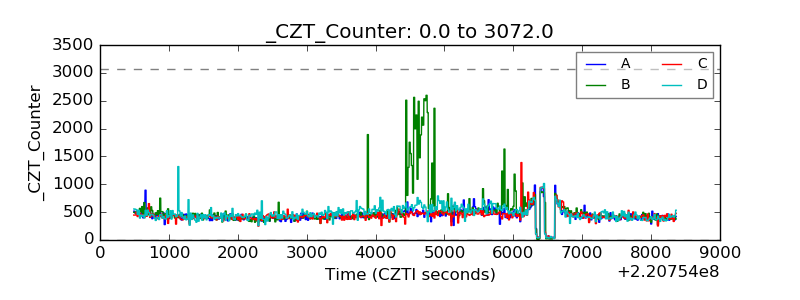 |
| +2.5 Volts monitor |  |
| +5 Volts monitor |  |
| _ROLL_ROT | 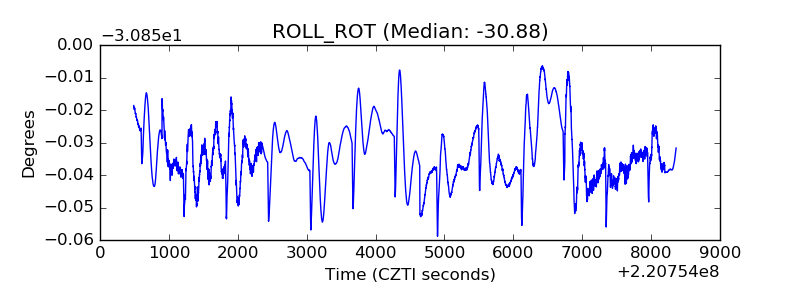 |
| _Roll_DEC | 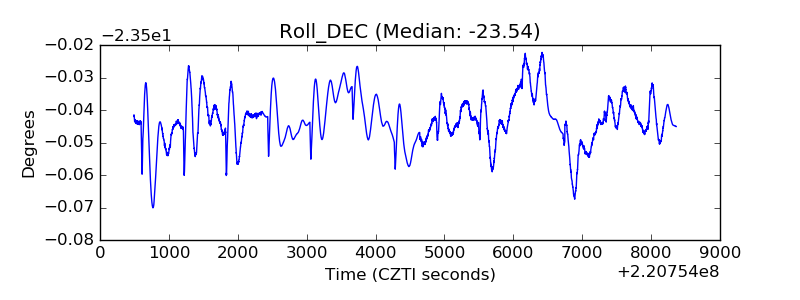 |
| _Roll_RA | 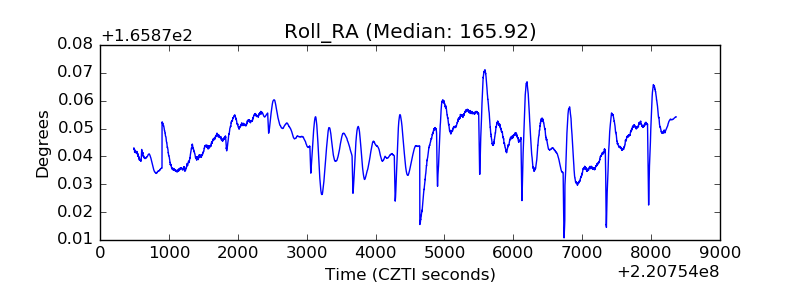 |
| Veto Counter | 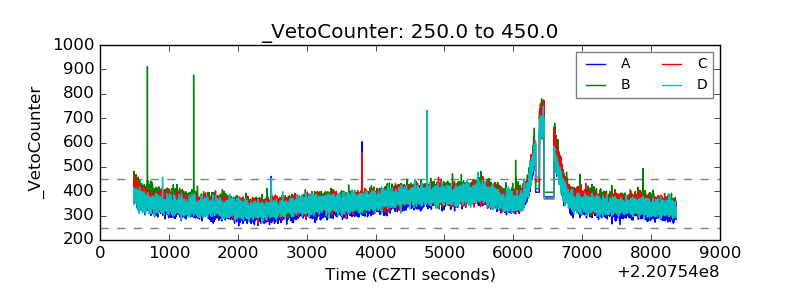 |