| Param | Original file | Final file |
|---|---|---|
| Filename | modeM0/AS1G06_086T02_9000000936_06794cztM0_level2.evt | modeM0/AS1G06_086T02_9000000936_06794cztM0_level2_quad_clean.evt |
| Size (bytes) | 65,085,120 | 19,955,520 |
| Size | 62.1 MB | 19.0 MB |
| Events in quadrant A | 463,395 | 129,871 |
| Events in quadrant B | 482,428 | 132,005 |
| Events in quadrant C | 472,597 | 129,199 |
| Events in quadrant D | 470,886 | 125,173 |
| Mode M0 | |||
|---|---|---|---|
| Quadrant | BADHDUFLAG | Total packets | Discarded packets |
| A | 0 | 2301 | 1 |
| B | 0 | 2309 | 0 |
| C | 0 | 2303 | 0 |
| D | 0 | 2315 | 0 |
| Mode SS | |||
|---|---|---|---|
| Quadrant | BADHDUFLAG | Total packets | Discarded packets |
| A | 0 | 24 | 0 |
| B | 0 | 24 | 0 |
| C | 0 | 24 | 0 |
| D | 0 | 24 | 0 |
| Quadrant | Total seconds | Saturated seconds | Saturation percentage |
|---|---|---|---|
| A | 1149 | 1 | 0.087032% |
| B | 1149 | 0 | 0.000000% |
| C | 1149 | 0 | 0.000000% |
| D | 1149 | 0 | 0.000000% |
Noise dominated data is calculated using 1-second bins in cleaned event files. If a bin has >2000 counts, and if more than 50% of those come from <1% of pixels, then it is considered to be noise-dominated and hence unusable.
| Quadrant | # 1 sec bins | Bins with >0 counts | Bins with >2000 counts | High rate bins dominated by noise | Noise dominated (total time) | Noise dominated (detector-on time) | Marked lightcurve |
|---|---|---|---|---|---|---|---|
| A | 1149 | 1149 | 0 | 0 | 0.00% | 0.00% | 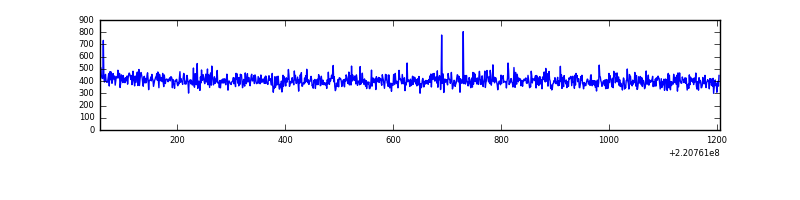 |
| B | 1149 | 1149 | 0 | 0 | 0.00% | 0.00% | 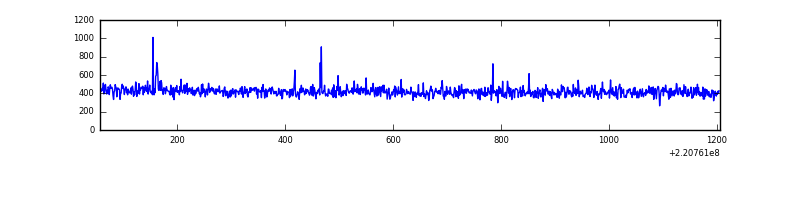 |
| C | 1149 | 1149 | 0 | 0 | 0.00% | 0.00% | 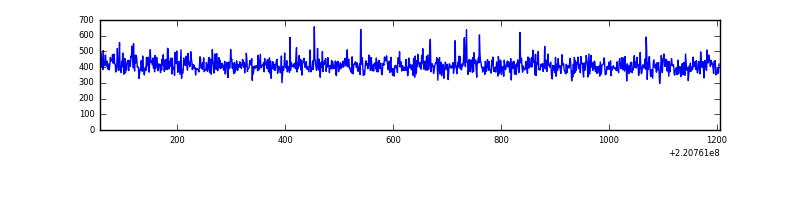 |
| D | 1149 | 1149 | 0 | 0 | 0.00% | 0.00% | 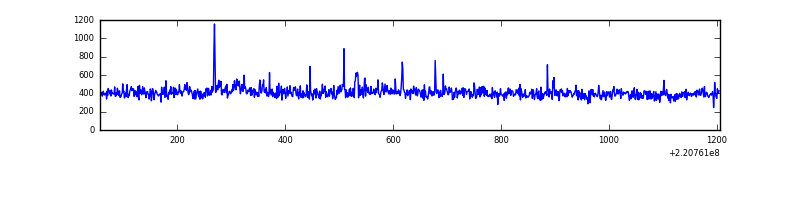 |
Top three noisy pixels from each quadrant. If the there are fewer than three noisy pixels in the level2.evt file, extra rows are filled as -1
| Pixel properties | Quadrant properties | ||||||
|---|---|---|---|---|---|---|---|
| Quadrant | DetID | PixID | Counts | Sigma | Mean | Median | Sigma |
| A | 0 | 226 | 1089 | 36.16 | 120 | 117 | 26.9 |
| A | 12 | 194 | 1026 | 33.82 | 120 | 117 | 26.9 |
| A | 13 | 254 | 723 | 22.54 | 120 | 117 | 26.9 |
| B | 4 | 81 | 5271 | 199.06 | 123 | 120 | 25.9 |
| B | 12 | 111 | 2456 | 90.28 | 123 | 120 | 25.9 |
| B | 11 | 111 | 1919 | 69.52 | 123 | 120 | 25.9 |
| C | 9 | 247 | 6415 | 213.17 | 118 | 119 | 29.5 |
| C | 12 | 16 | 2109 | 67.38 | 118 | 119 | 29.5 |
| C | 13 | 61 | 967 | 28.71 | 118 | 119 | 29.5 |
| D | 8 | 195 | 23232 | 768.68 | 116 | 113 | 30.1 |
| D | 8 | 240 | 7869 | 257.88 | 116 | 113 | 30.1 |
| D | 2 | 14 | 2478 | 78.63 | 116 | 113 | 30.1 |
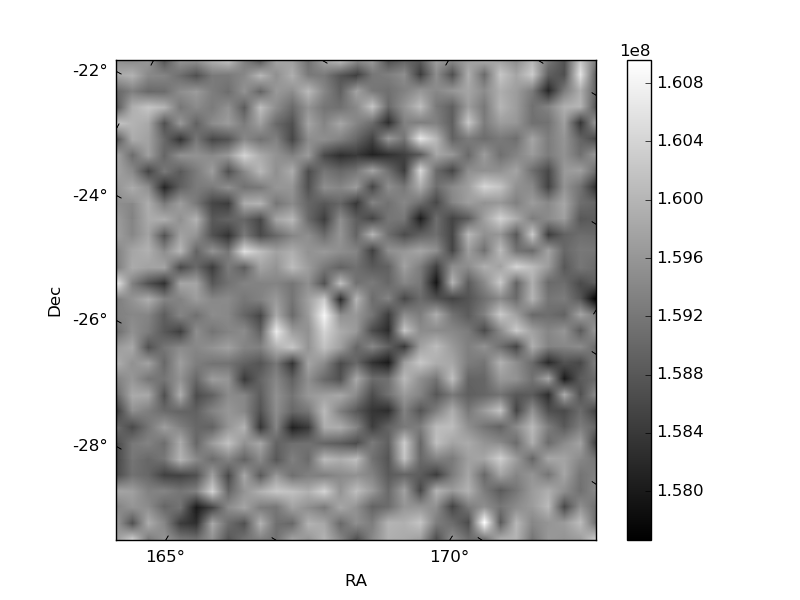
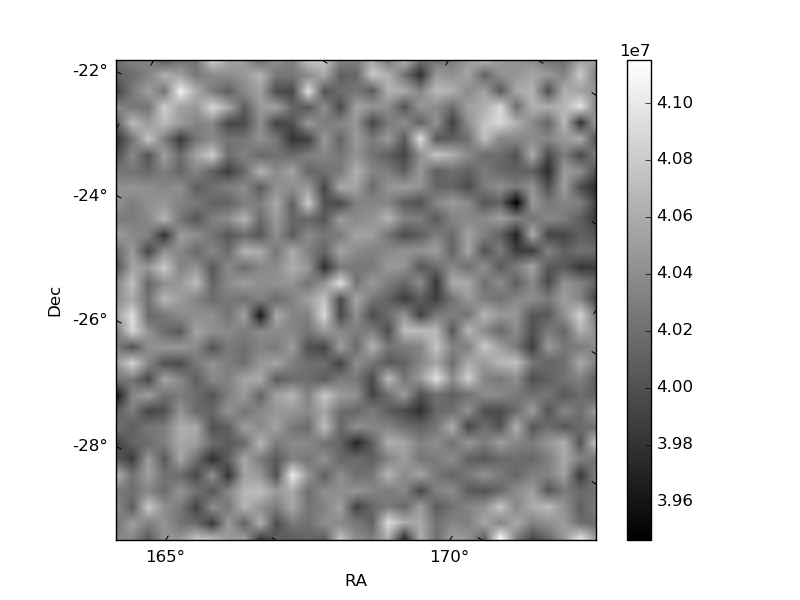
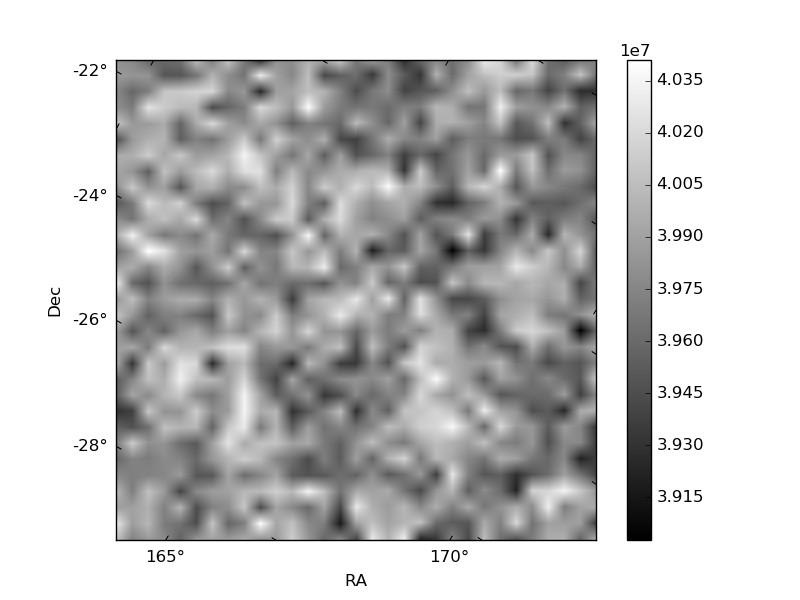
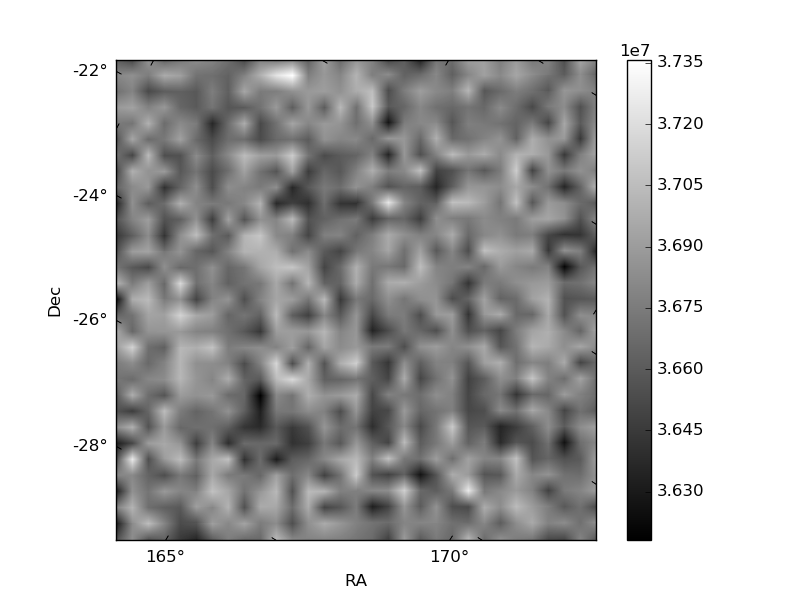
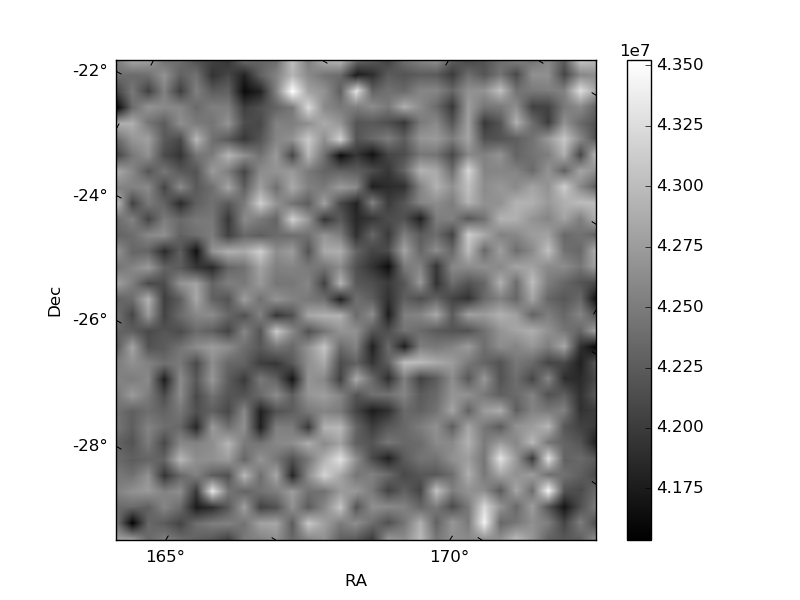
Histogram calculated using DETX and DETY for each event in the final _common_clean file
| Quadrant A | 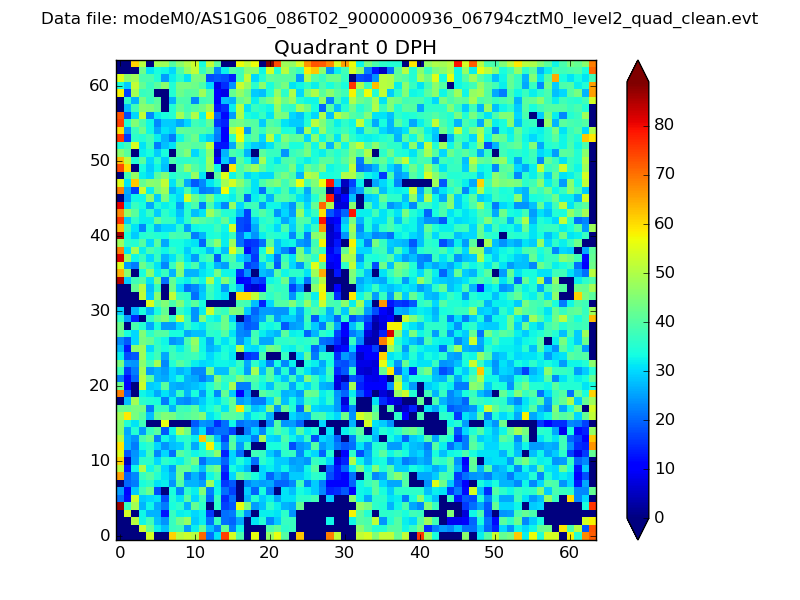 |
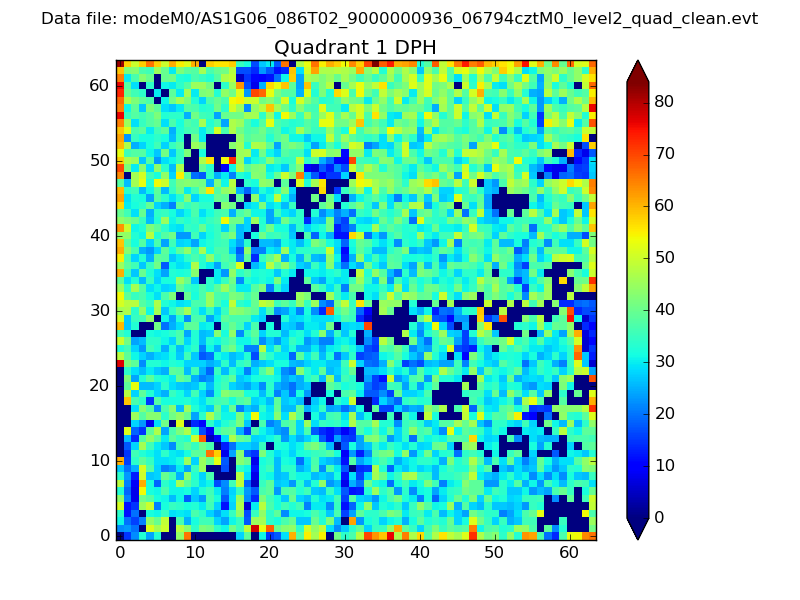 |
Quadrant B |
|---|---|---|---|
| Quadrant D | 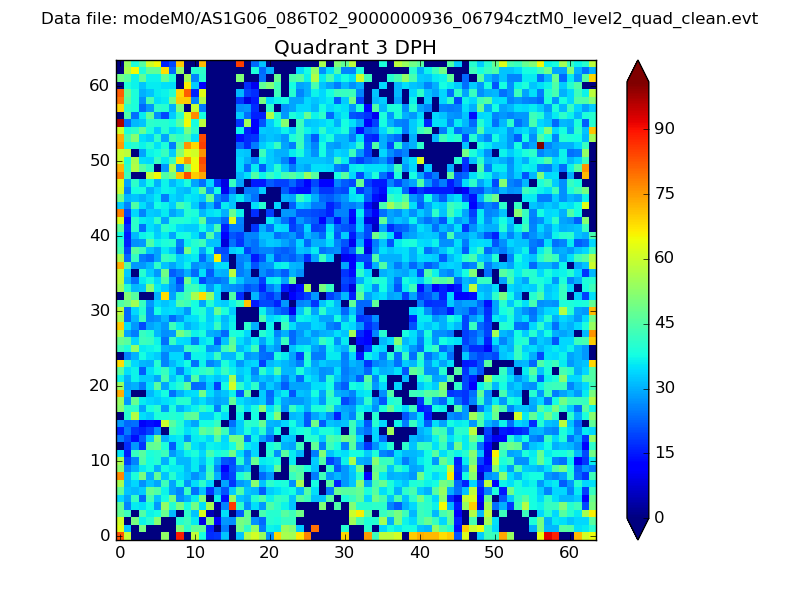 |
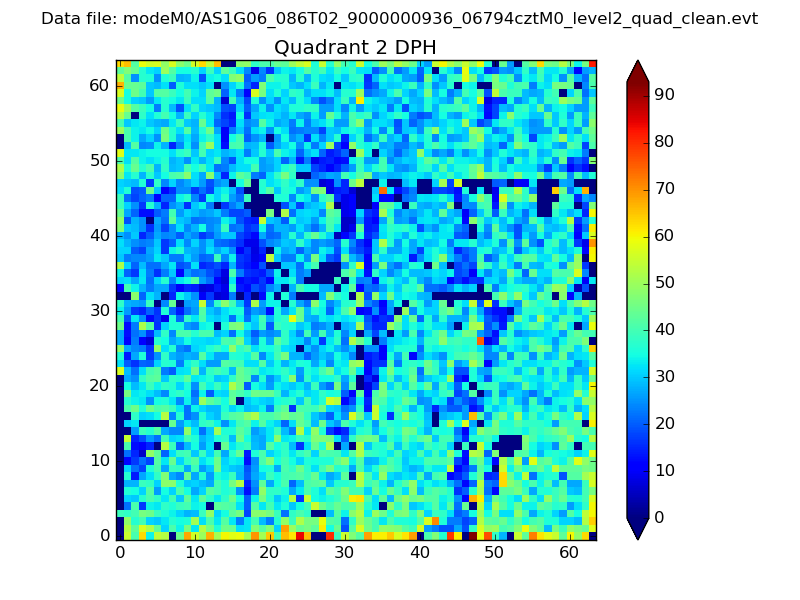 |
Quadrant C |
| Plot type | Count rate plots | Images |
|---|---|---|
| Comparison with Poisson distribution Blue bars denote a histogram of data divided into 1 sec bins. Red curve is a Poisson curve with rate = median count rate of data. |
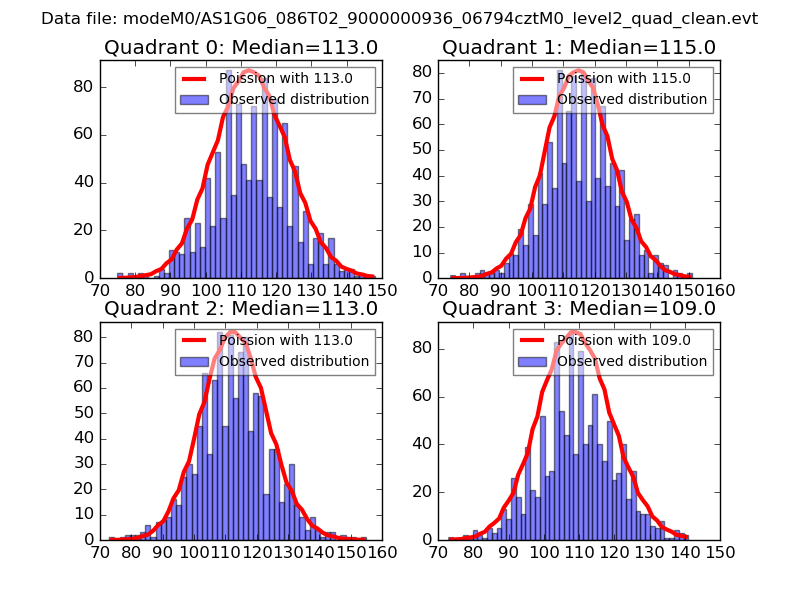 |
 |
| Quadrant-wise count rates Data is divided into 100 sec bins |
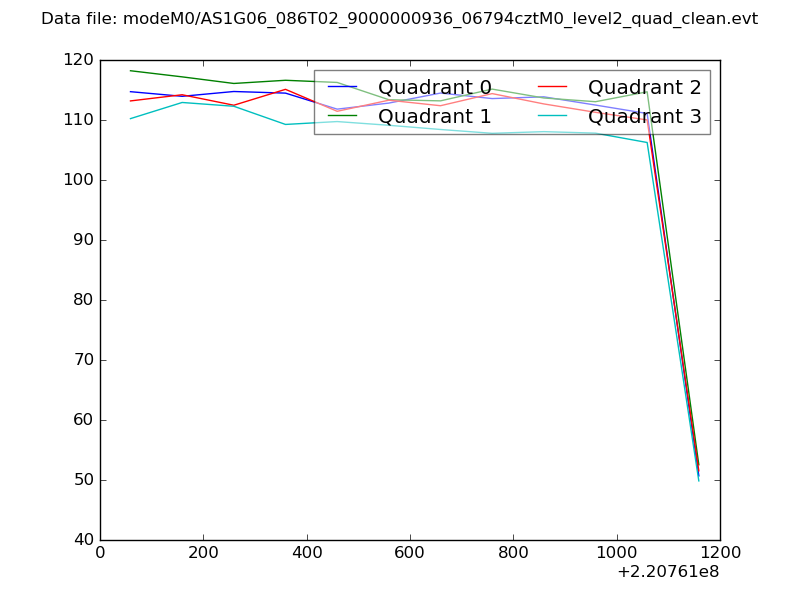 |
|
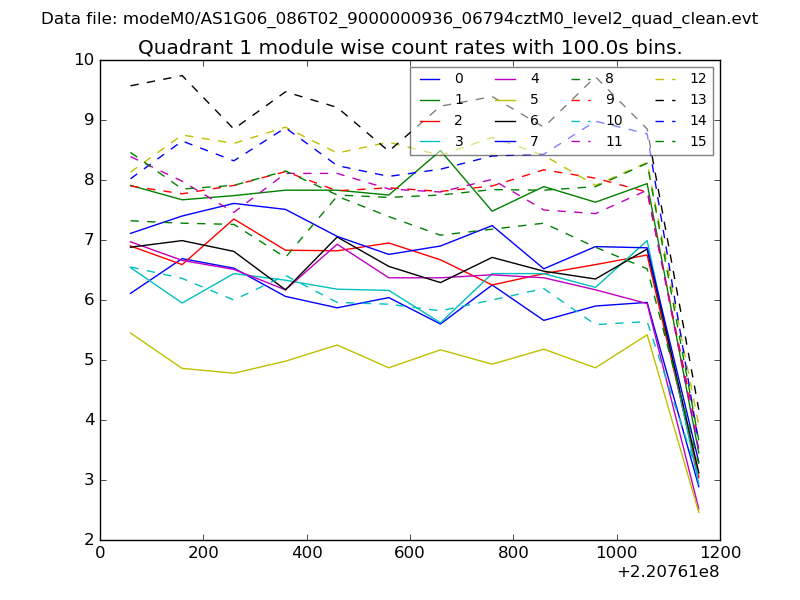
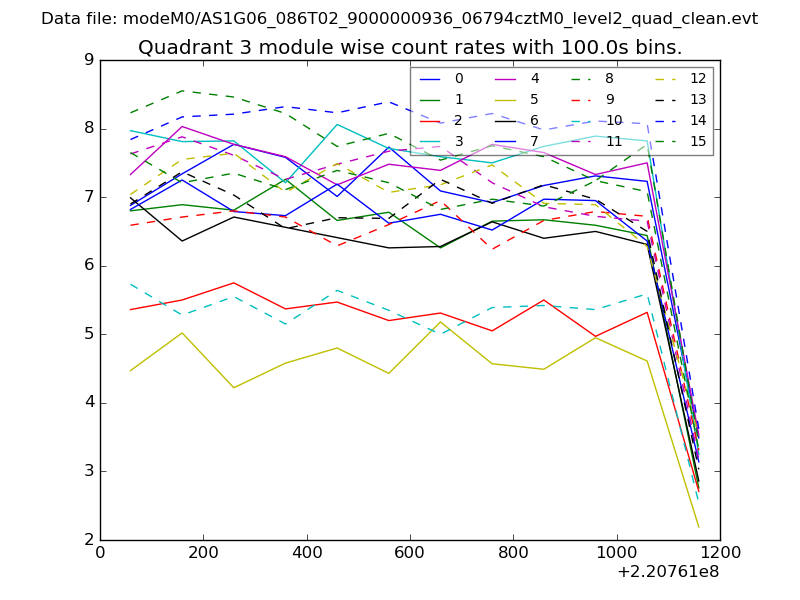
| Module-wise count rates for Quadrant A Data is divided into 100 sec bins |
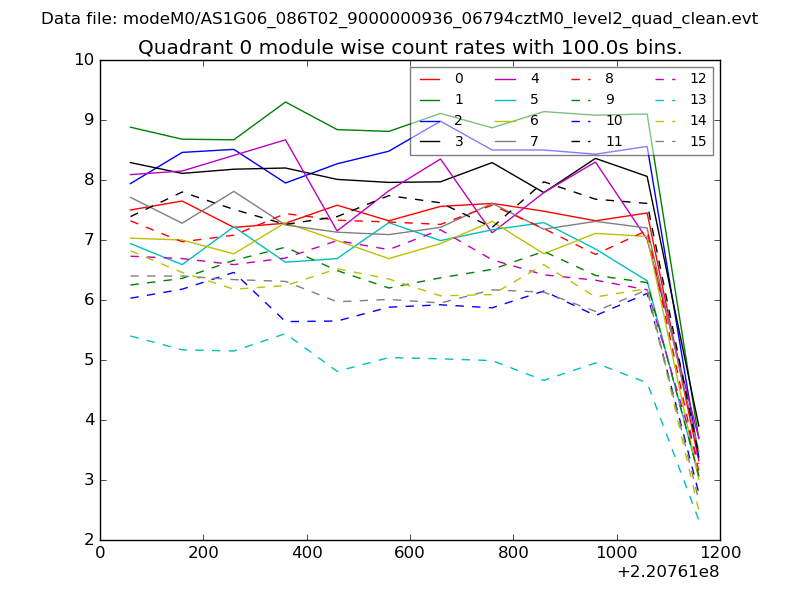 |
 |
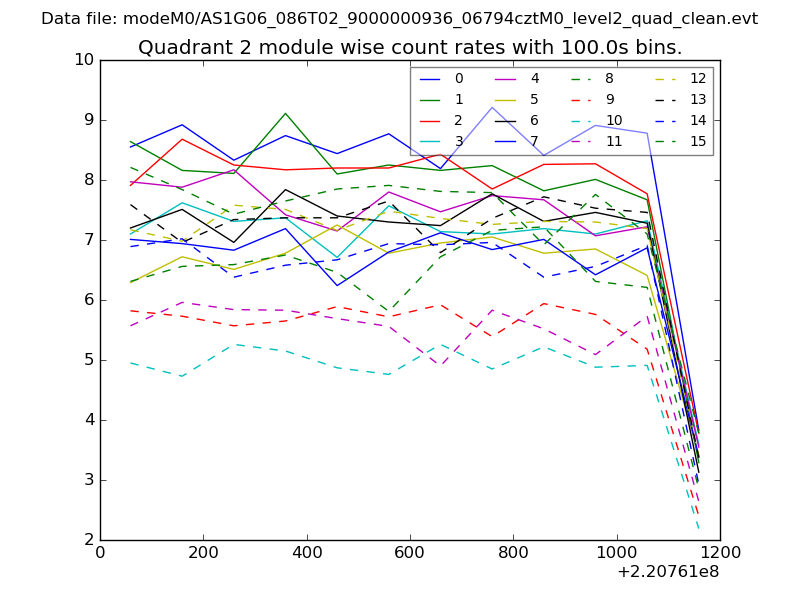
| Module-wise count rates for Quadrant B Data is divided into 100 sec bins |
 |
 |
| Module-wise count rates for Quadrant C Data is divided into 100 sec bins |
 |
 |
| Module-wise count rates for Quadrant D Data is divided into 100 sec bins |
 |
 |
| Parameter | Plot |
|---|---|
| CZT HV Monitor | 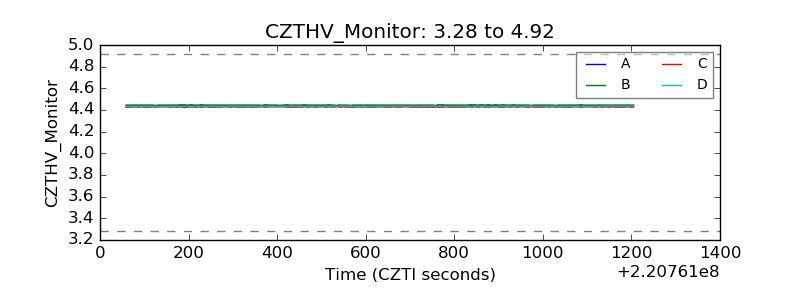 |
| D_VDD | 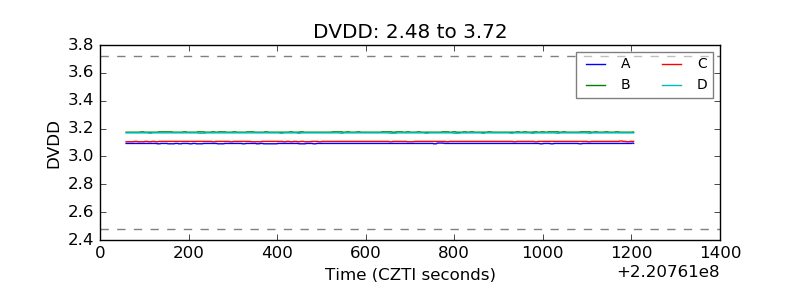 |
| Temperature 1 | 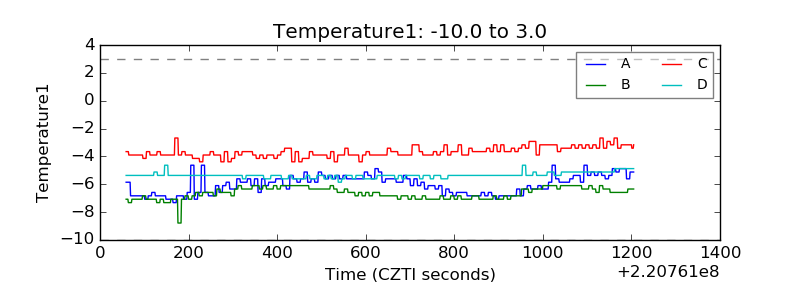 |
| Veto HV Monitor | 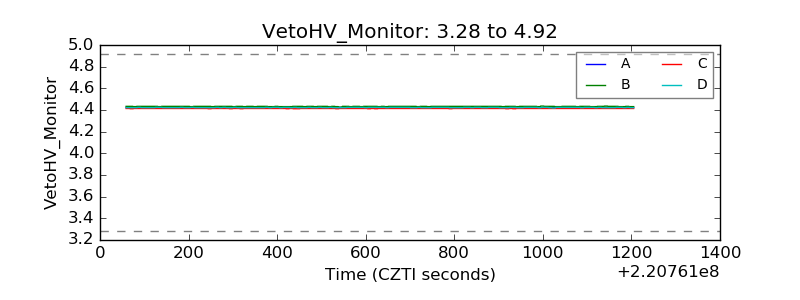 |
| Veto LLD | 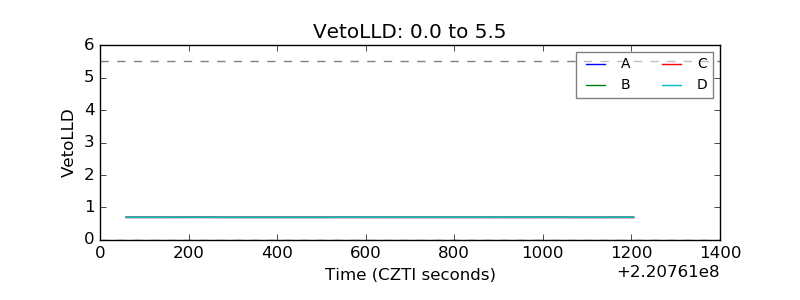 |
| Alpha Counter | 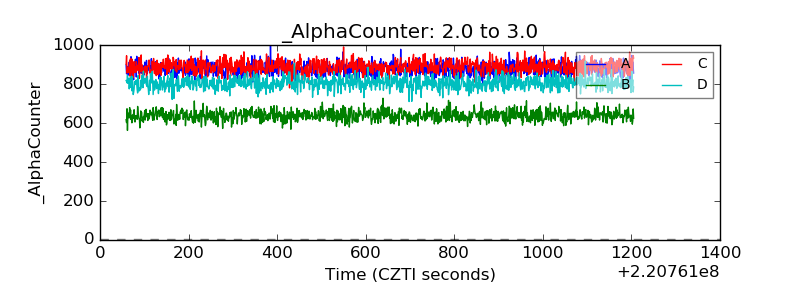 |
| _CPM_Rate | 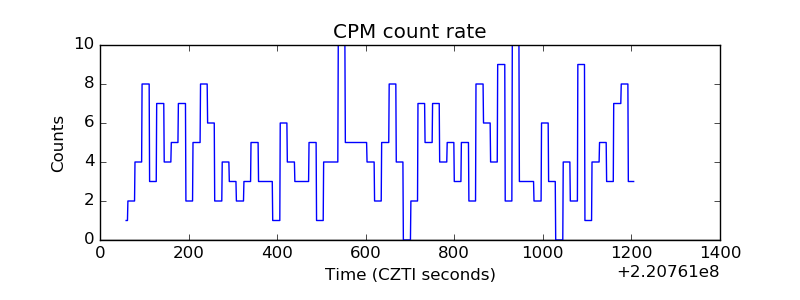 |
| CZT Counter | 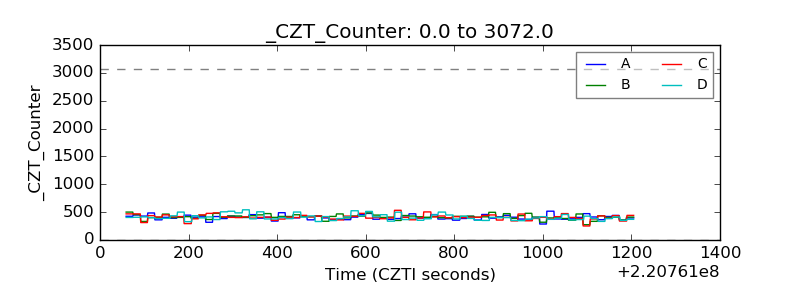 |
| +2.5 Volts monitor |  |
| +5 Volts monitor |  |
| _ROLL_ROT | 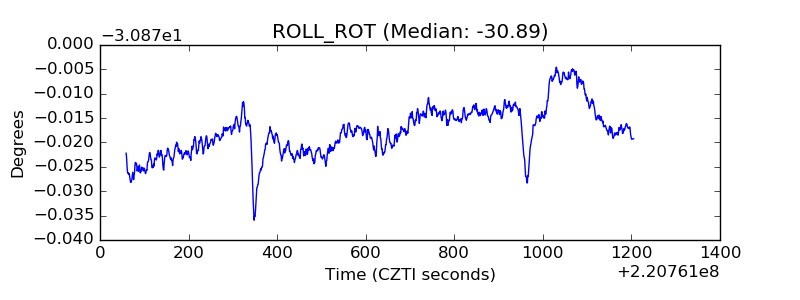 |
| _Roll_DEC | 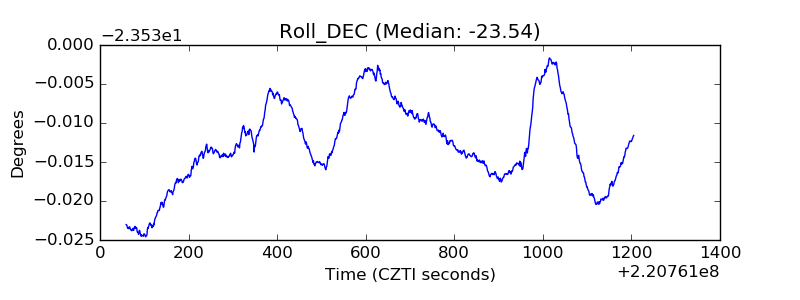 |
| _Roll_RA | 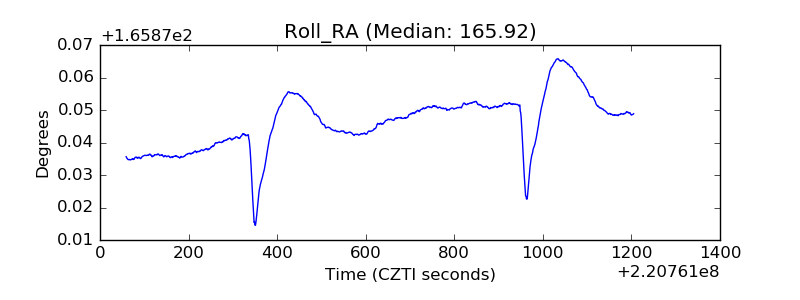 |
| Veto Counter | 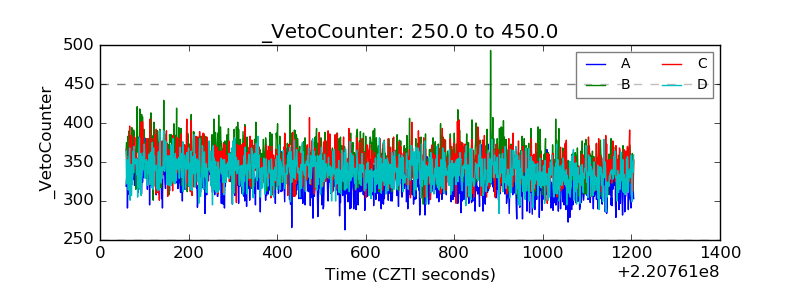 |