| Param | Original file | Final file |
|---|---|---|
| Filename | modeM0/AS1G06_086T02_9000000936_06797cztM0_level2.evt | modeM0/AS1G06_086T02_9000000936_06797cztM0_level2_quad_clean.evt |
| Size (bytes) | 83,039,040 | 25,341,120 |
| Size | 79.2 MB | 24.2 MB |
| Events in quadrant A | 588,605 | 165,405 |
| Events in quadrant B | 610,300 | 168,362 |
| Events in quadrant C | 605,303 | 164,780 |
| Events in quadrant D | 606,987 | 158,794 |
| Mode M0 | |||
|---|---|---|---|
| Quadrant | BADHDUFLAG | Total packets | Discarded packets |
| A | 0 | 2950 | 1 |
| B | 0 | 2956 | 0 |
| C | 0 | 2951 | 0 |
| D | 0 | 2967 | 0 |
| Mode SS | |||
|---|---|---|---|
| Quadrant | BADHDUFLAG | Total packets | Discarded packets |
| A | 0 | 30 | 0 |
| B | 0 | 30 | 0 |
| C | 0 | 30 | 0 |
| D | 0 | 30 | 0 |
| Quadrant | Total seconds | Saturated seconds | Saturation percentage |
|---|---|---|---|
| A | 1473 | 2 | 0.135777% |
| B | 1473 | 0 | 0.000000% |
| C | 1473 | 0 | 0.000000% |
| D | 1473 | 0 | 0.000000% |
Noise dominated data is calculated using 1-second bins in cleaned event files. If a bin has >2000 counts, and if more than 50% of those come from <1% of pixels, then it is considered to be noise-dominated and hence unusable.
| Quadrant | # 1 sec bins | Bins with >0 counts | Bins with >2000 counts | High rate bins dominated by noise | Noise dominated (total time) | Noise dominated (detector-on time) | Marked lightcurve |
|---|---|---|---|---|---|---|---|
| A | 1473 | 1473 | 0 | 0 | 0.00% | 0.00% | 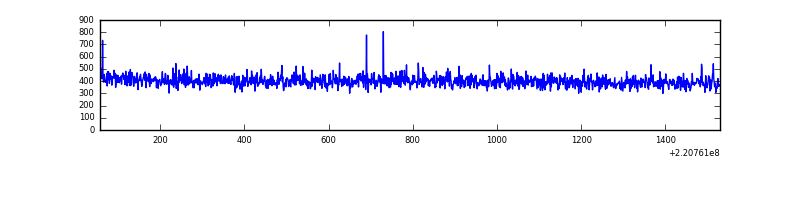 |
| B | 1473 | 1473 | 0 | 0 | 0.00% | 0.00% | 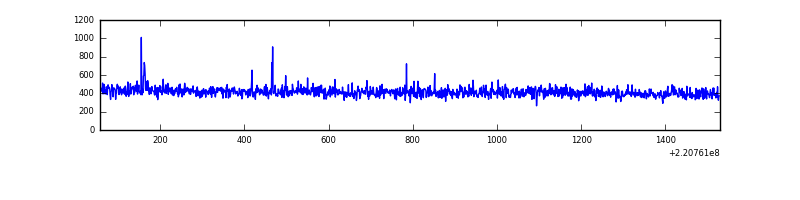 |
| C | 1473 | 1473 | 0 | 0 | 0.00% | 0.00% | 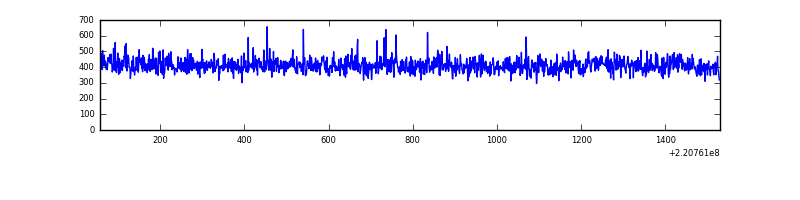 |
| D | 1473 | 1473 | 0 | 0 | 0.00% | 0.00% | 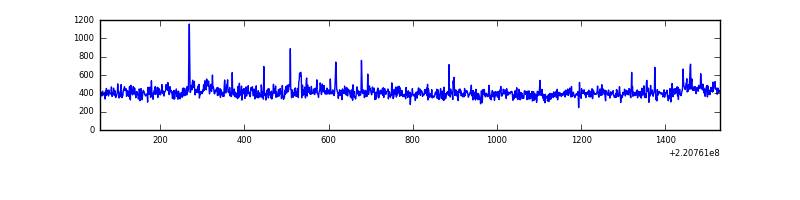 |
Top three noisy pixels from each quadrant. If the there are fewer than three noisy pixels in the level2.evt file, extra rows are filled as -1
| Pixel properties | Quadrant properties | ||||||
|---|---|---|---|---|---|---|---|
| Quadrant | DetID | PixID | Counts | Sigma | Mean | Median | Sigma |
| A | 0 | 226 | 1388 | 36.81 | 152 | 149 | 33.7 |
| A | 12 | 194 | 1309 | 34.46 | 152 | 149 | 33.7 |
| A | 13 | 254 | 925 | 23.05 | 152 | 149 | 33.7 |
| B | 4 | 81 | 5753 | 173.6 | 156 | 152 | 32.3 |
| B | 12 | 111 | 3086 | 90.94 | 156 | 152 | 32.3 |
| B | 11 | 111 | 2473 | 71.94 | 156 | 152 | 32.3 |
| C | 9 | 247 | 11936 | 317.24 | 151 | 152 | 37.1 |
| C | 12 | 16 | 2384 | 60.09 | 151 | 152 | 37.1 |
| C | 13 | 61 | 1221 | 28.78 | 151 | 152 | 37.1 |
| D | 8 | 195 | 36956 | 978.3 | 148 | 143 | 37.6 |
| D | 8 | 240 | 11770 | 308.99 | 148 | 143 | 37.6 |
| D | 2 | 14 | 2510 | 62.9 | 148 | 143 | 37.6 |
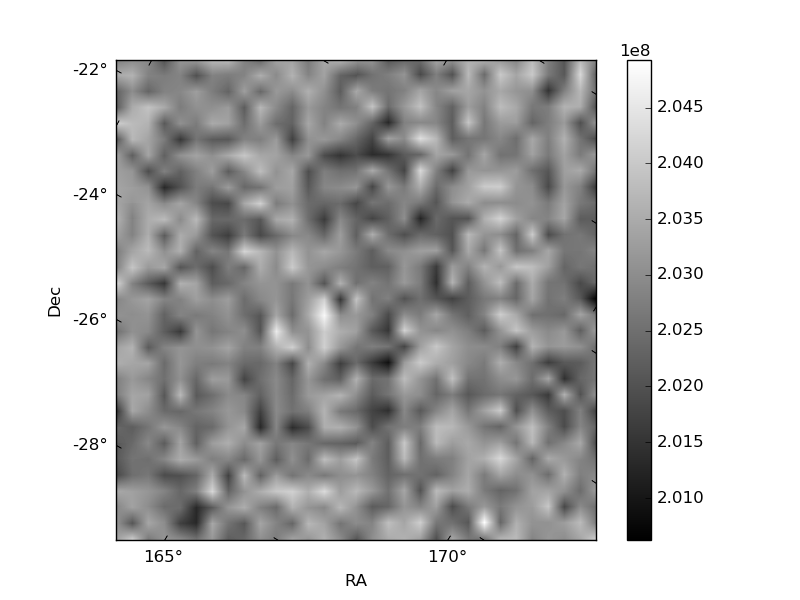
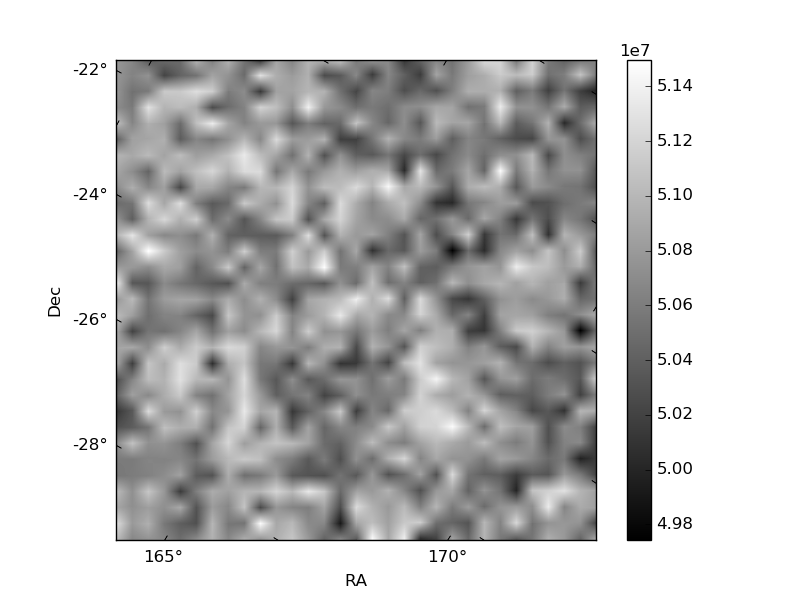
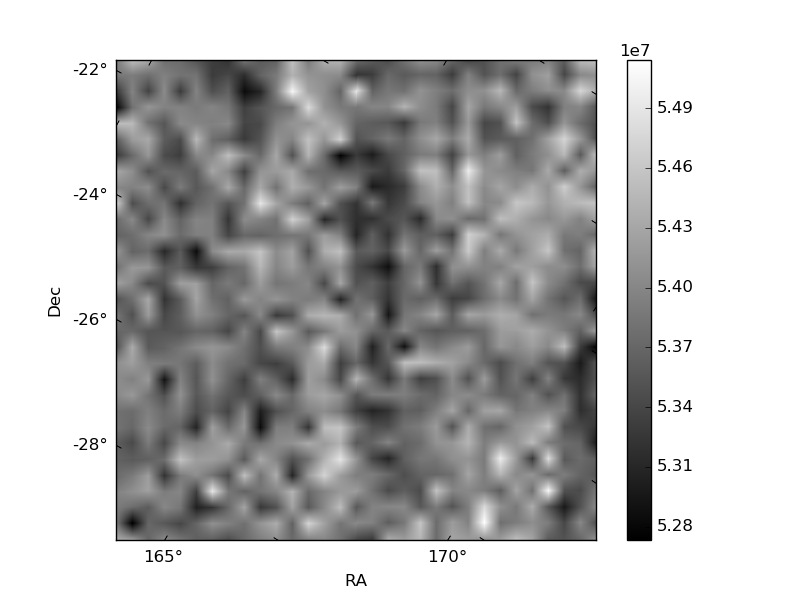
Histogram calculated using DETX and DETY for each event in the final _common_clean file
| Quadrant A | 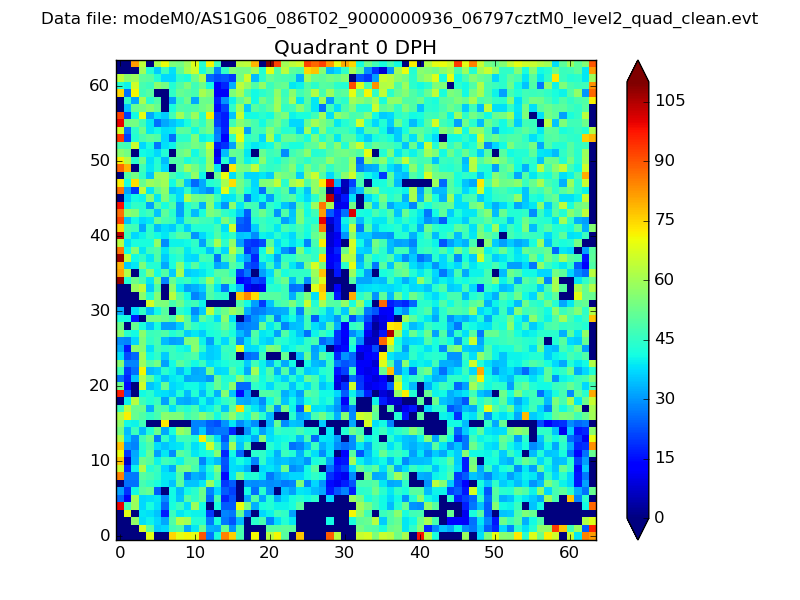 |
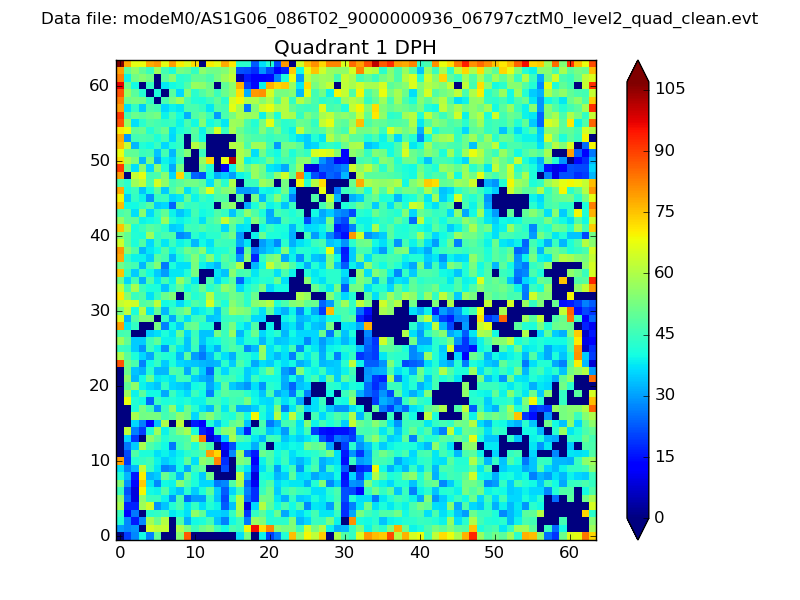 |
Quadrant B |
|---|---|---|---|
| Quadrant D | 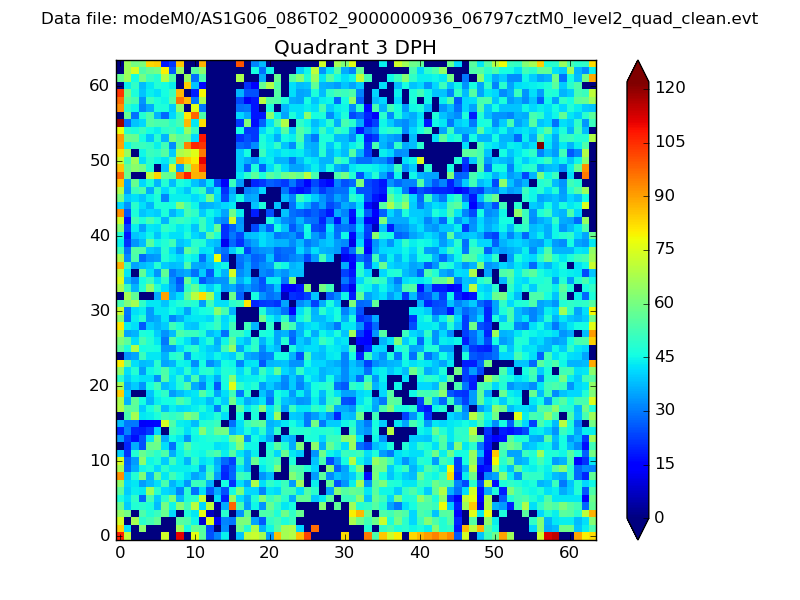 |
 |
Quadrant C |
| Plot type | Count rate plots | Images |
|---|---|---|
| Comparison with Poisson distribution Blue bars denote a histogram of data divided into 1 sec bins. Red curve is a Poisson curve with rate = median count rate of data. |
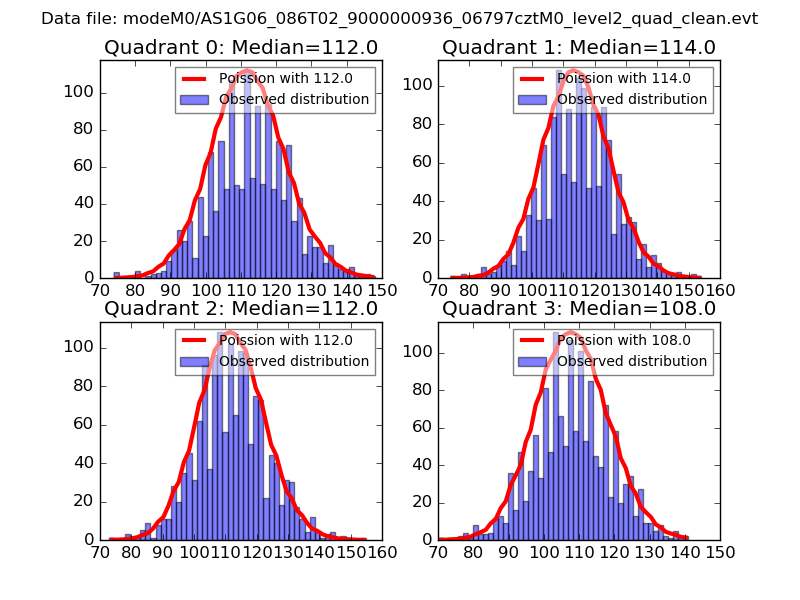 |
 |
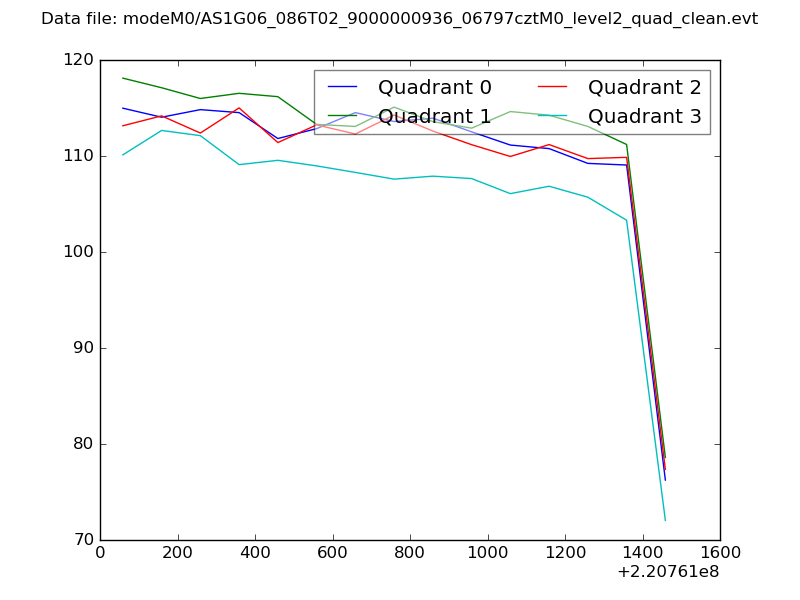
| Quadrant-wise count rates Data is divided into 100 sec bins |
 |
|
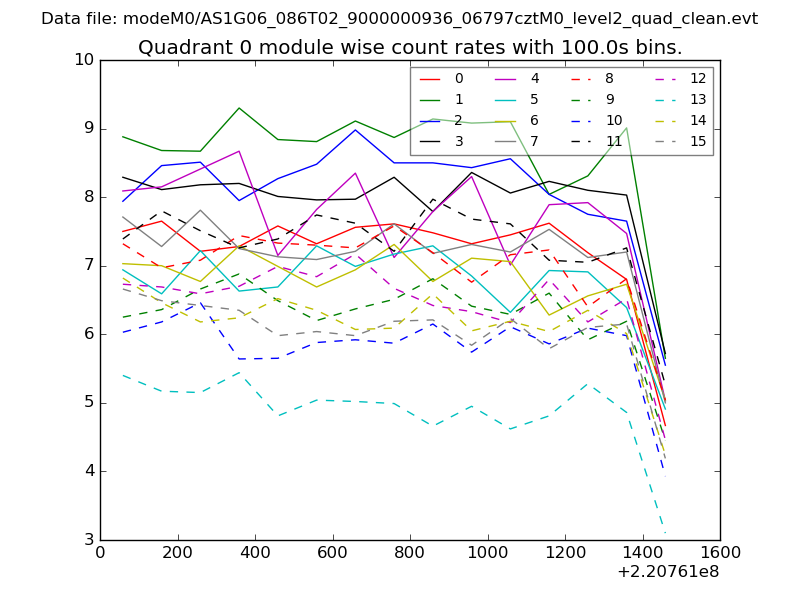
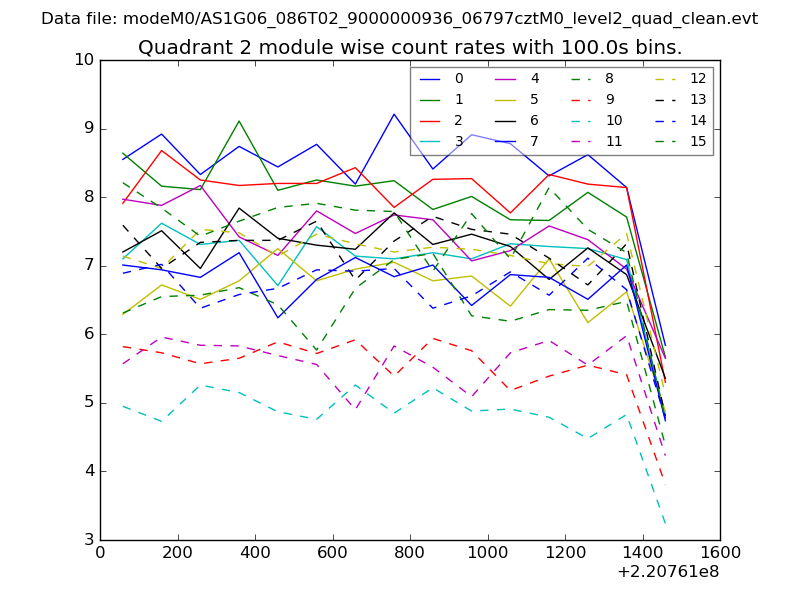
| Module-wise count rates for Quadrant A Data is divided into 100 sec bins |
 |
 |
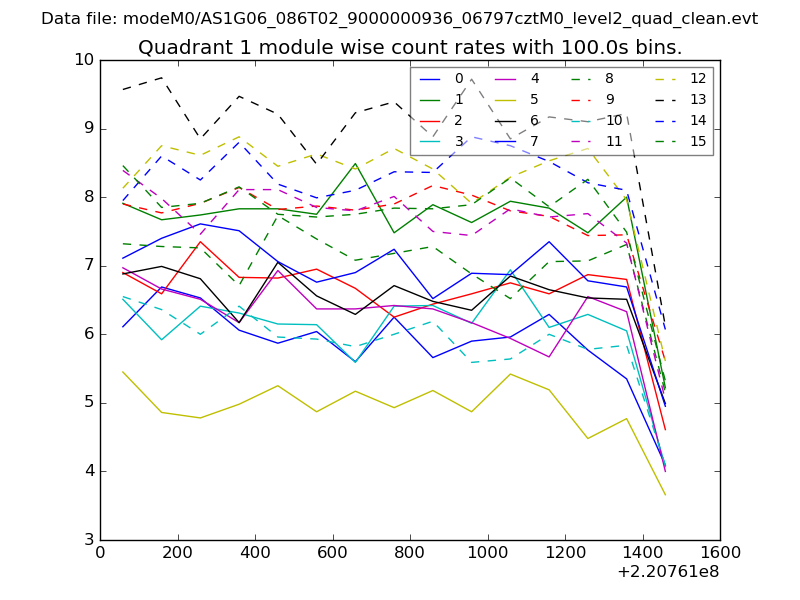
| Module-wise count rates for Quadrant B Data is divided into 100 sec bins |
 |
 |
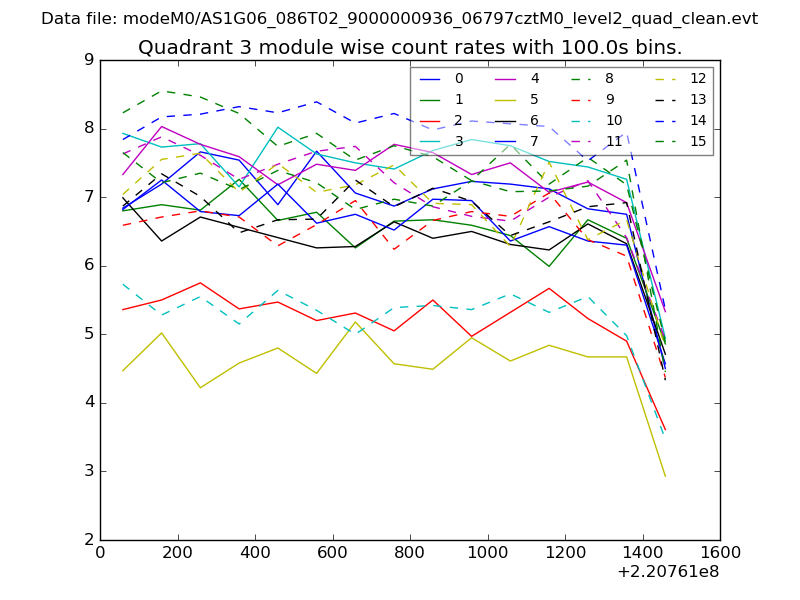
| Module-wise count rates for Quadrant C Data is divided into 100 sec bins |
 |
 |
| Module-wise count rates for Quadrant D Data is divided into 100 sec bins |
 |
 |
| Parameter | Plot |
|---|---|
| CZT HV Monitor | 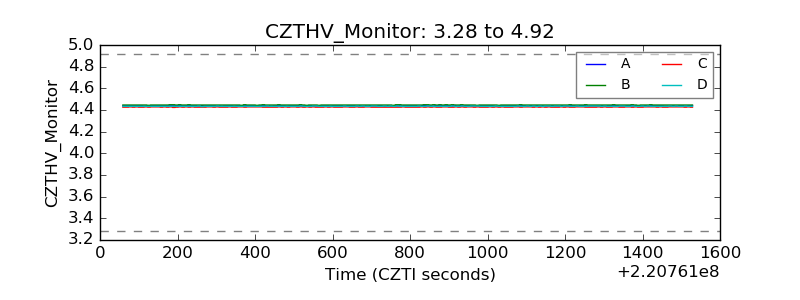 |
| D_VDD | 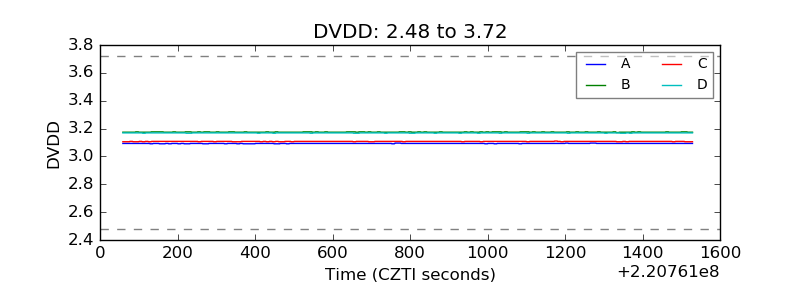 |
| Temperature 1 | 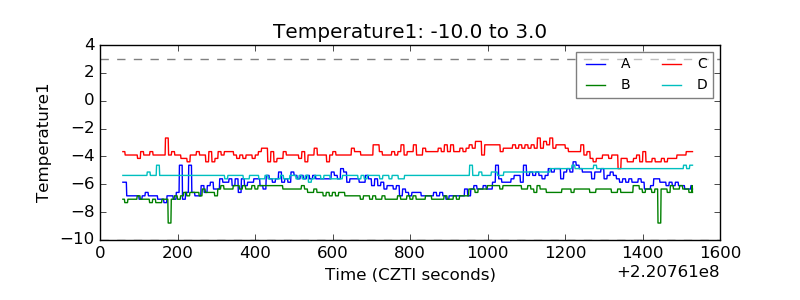 |
| Veto HV Monitor | 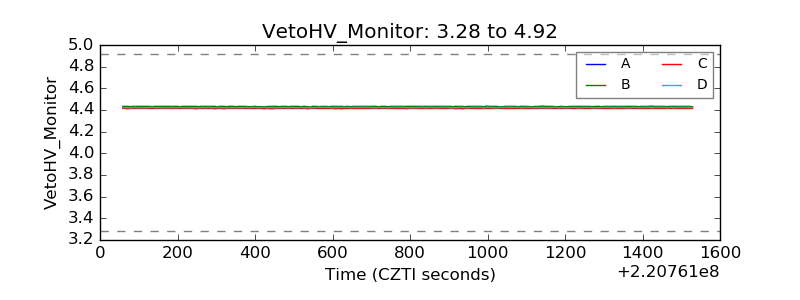 |
| Veto LLD | 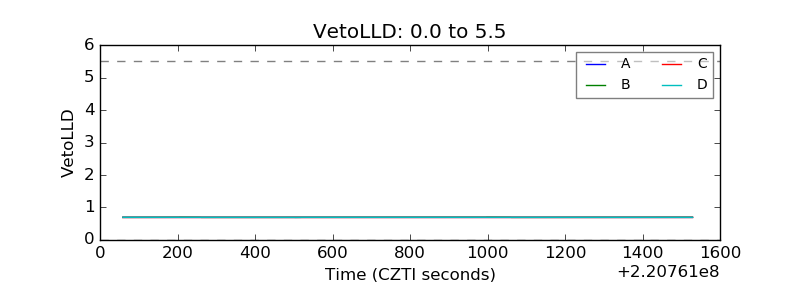 |
| Alpha Counter | 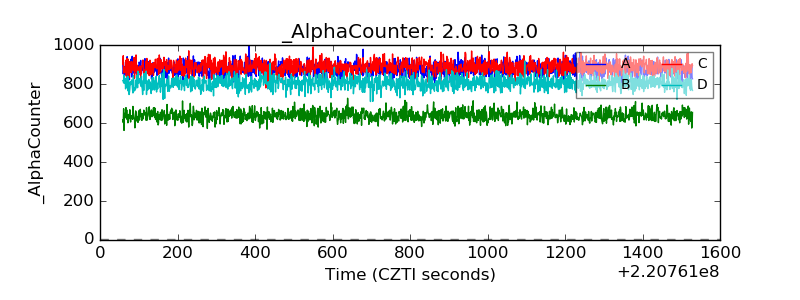 |
| _CPM_Rate | 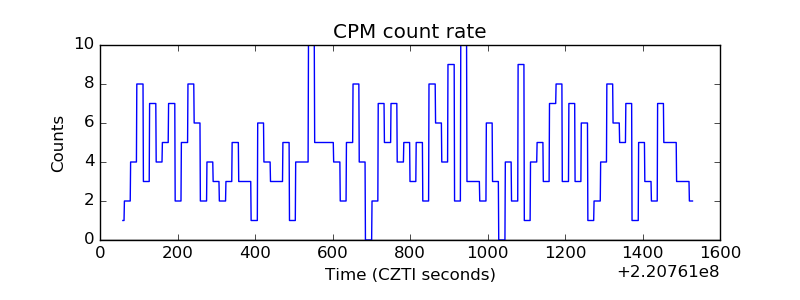 |
| CZT Counter |  |
| +2.5 Volts monitor |  |
| +5 Volts monitor |  |
| _ROLL_ROT | 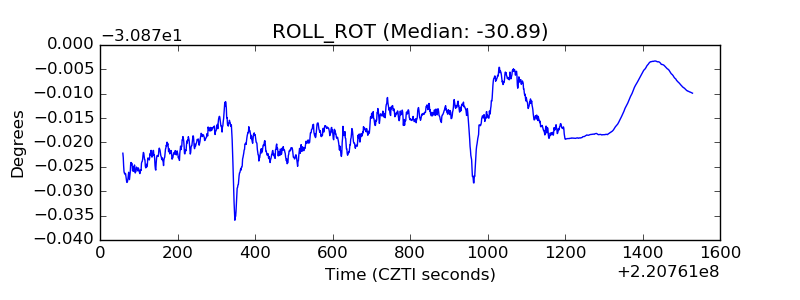 |
| _Roll_DEC | 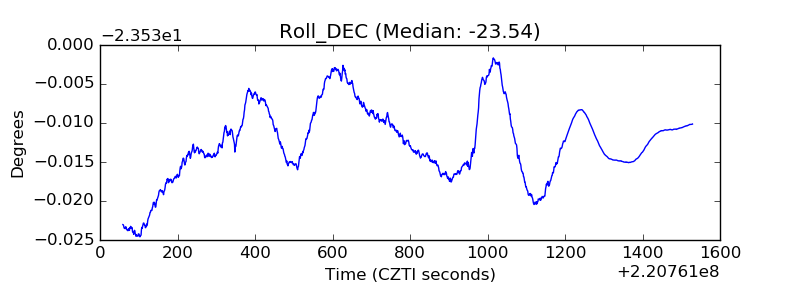 |
| _Roll_RA | 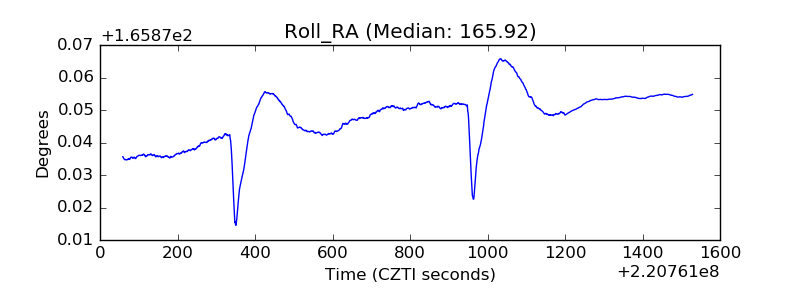 |
| Veto Counter | 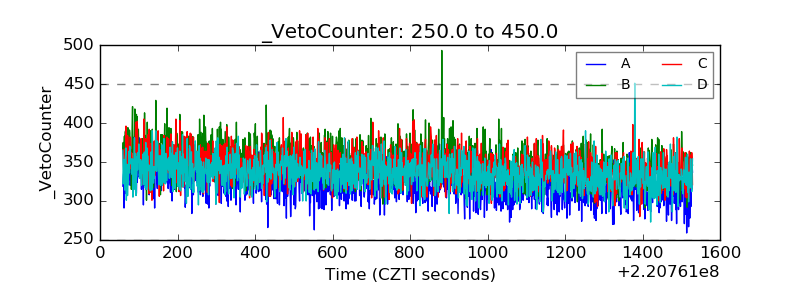 |