| Param | Original file | Final file |
|---|---|---|
| Filename | modeM0/AS1G06_086T02_9000000936_06798cztM0_level2.evt | modeM0/AS1G06_086T02_9000000936_06798cztM0_level2_quad_clean.evt |
| Size (bytes) | 1,808,550,720 | 307,851,840 |
| Size | 1.7 GB | 293.6 MB |
| Events in quadrant A | 12,580,583 | 1,874,077 |
| Events in quadrant B | 13,684,943 | 1,895,576 |
| Events in quadrant C | 12,575,212 | 1,866,668 |
| Events in quadrant D | 14,062,988 | 1,787,143 |
| Mode M9 | |||
|---|---|---|---|
| Quadrant | BADHDUFLAG | Total packets | Discarded packets |
| A | 0 | 35 | 0 |
| B | 0 | 35 | 0 |
| C | 0 | 35 | 0 |
| D | 0 | 35 | 0 |
| Mode M0 | |||
|---|---|---|---|
| Quadrant | BADHDUFLAG | Total packets | Discarded packets |
| A | 0 | 56446 | 6 |
| B | 0 | 59345 | 5 |
| C | 0 | 56431 | 5 |
| D | 0 | 59292 | 5 |
| Mode SS | |||
|---|---|---|---|
| Quadrant | BADHDUFLAG | Total packets | Discarded packets |
| A | 0 | 564 | 0 |
| B | 0 | 564 | 0 |
| C | 0 | 564 | 0 |
| D | 0 | 564 | 0 |
| Quadrant | Total seconds | Saturated seconds | Saturation percentage |
|---|---|---|---|
| A | 27631 | 270 | 0.977163% |
| B | 27631 | 659 | 2.385002% |
| C | 27631 | 225 | 0.814303% |
| D | 27631 | 242 | 0.875828% |
Noise dominated data is calculated using 1-second bins in cleaned event files. If a bin has >2000 counts, and if more than 50% of those come from <1% of pixels, then it is considered to be noise-dominated and hence unusable.
| Quadrant | # 1 sec bins | Bins with >0 counts | Bins with >2000 counts | High rate bins dominated by noise | Noise dominated (total time) | Noise dominated (detector-on time) | Marked lightcurve |
|---|---|---|---|---|---|---|---|
| A | 31201 | 27636 | 11 | 11 | 0.04% | 0.04% | 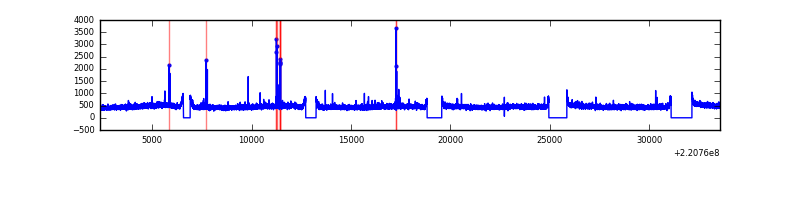 |
| B | 31201 | 27636 | 269 | 269 | 0.86% | 0.97% | 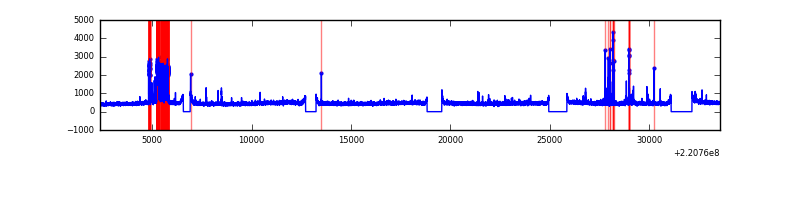 |
| C | 31201 | 27636 | 5 | 5 | 0.02% | 0.02% | 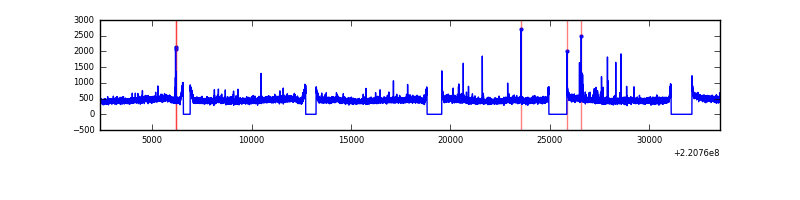 |
| D | 31201 | 27636 | 33 | 33 | 0.11% | 0.12% | 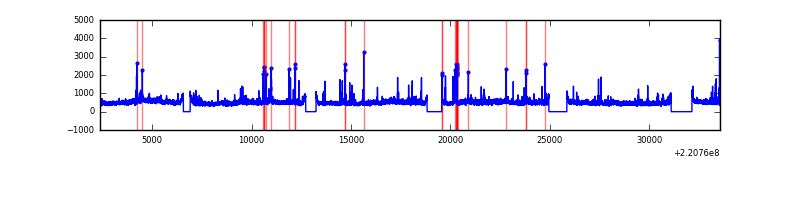 |
Top three noisy pixels from each quadrant. If the there are fewer than three noisy pixels in the level2.evt file, extra rows are filled as -1
| Pixel properties | Quadrant properties | ||||||
|---|---|---|---|---|---|---|---|
| Quadrant | DetID | PixID | Counts | Sigma | Mean | Median | Sigma |
| A | 13 | 248 | 94605 | 137.86 | 3237 | 3160 | 663.3 |
| A | 0 | 226 | 30652 | 41.45 | 3237 | 3160 | 663.3 |
| A | 12 | 194 | 30037 | 40.52 | 3237 | 3160 | 663.3 |
| B | 0 | 228 | 951968 | 1548.1 | 3234 | 3155 | 612.9 |
| B | 4 | 81 | 73382 | 114.58 | 3234 | 3155 | 612.9 |
| B | 12 | 111 | 64407 | 99.94 | 3234 | 3155 | 612.9 |
| C | 9 | 247 | 173834 | 233.93 | 3156 | 3168 | 729.6 |
| C | 12 | 16 | 66870 | 87.31 | 3156 | 3168 | 729.6 |
| C | 13 | 61 | 24516 | 29.26 | 3156 | 3168 | 729.6 |
| D | 8 | 195 | 1597619 | 2058.56 | 3155 | 3058 | 774.6 |
| D | 13 | 169 | 201982 | 256.81 | 3155 | 3058 | 774.6 |
| D | 5 | 97 | 89348 | 111.4 | 3155 | 3058 | 774.6 |
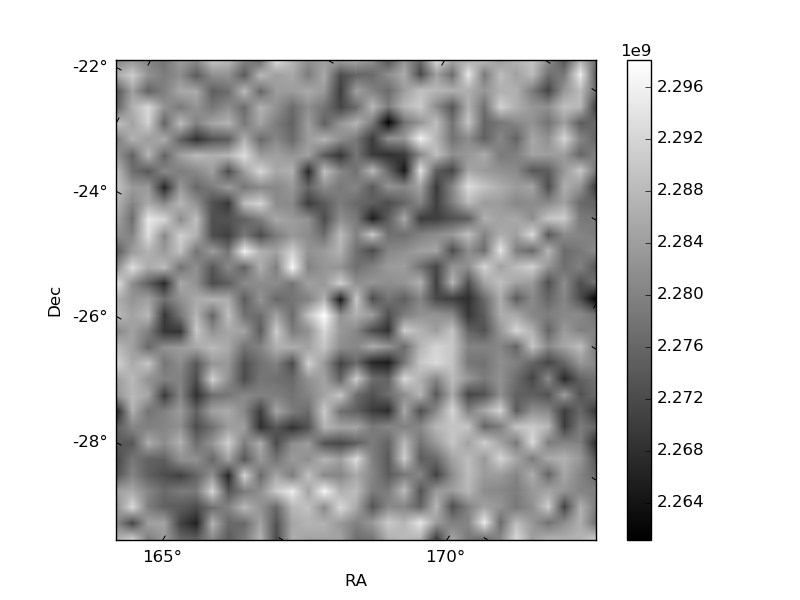
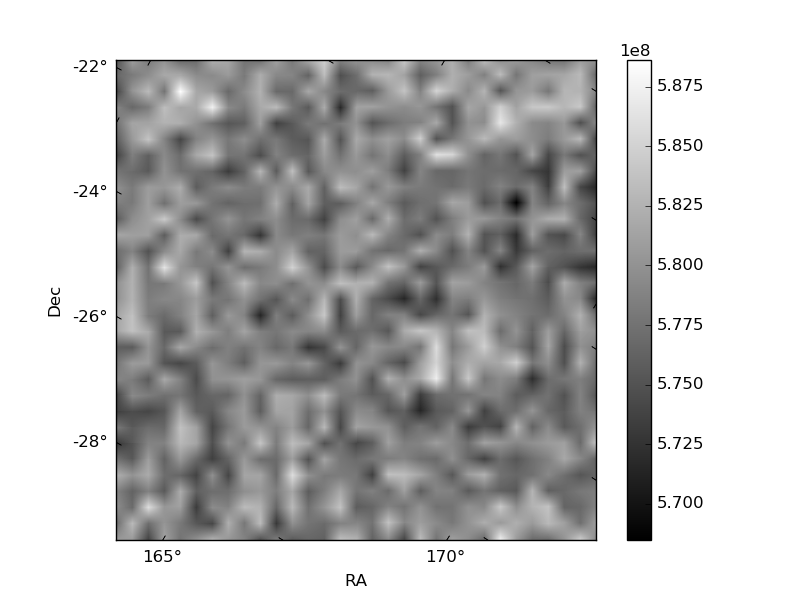
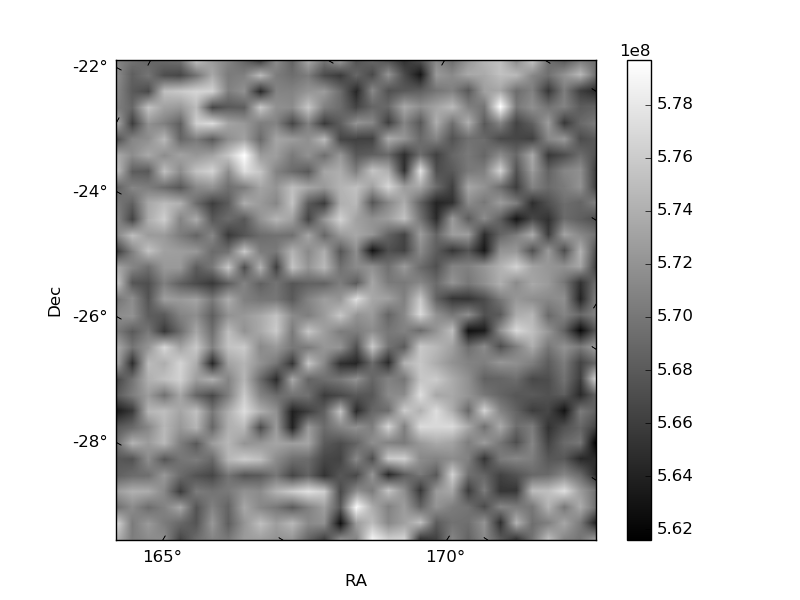
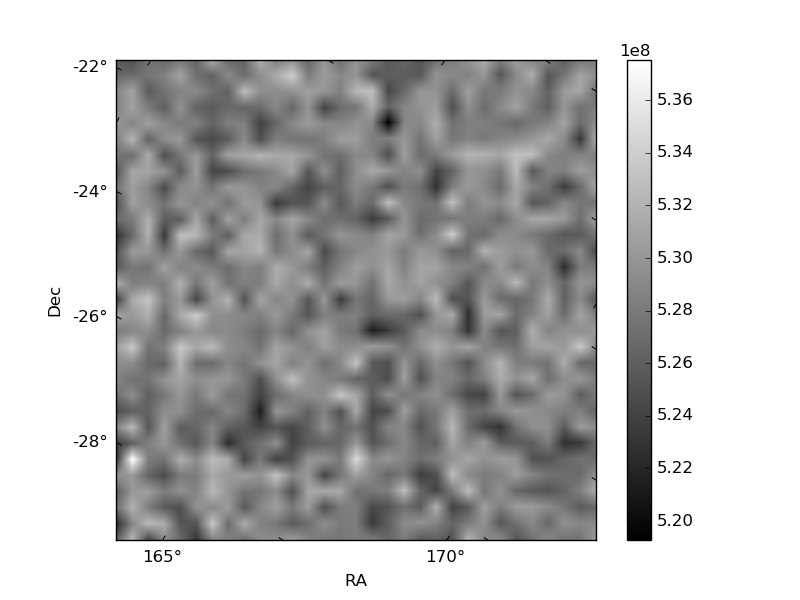
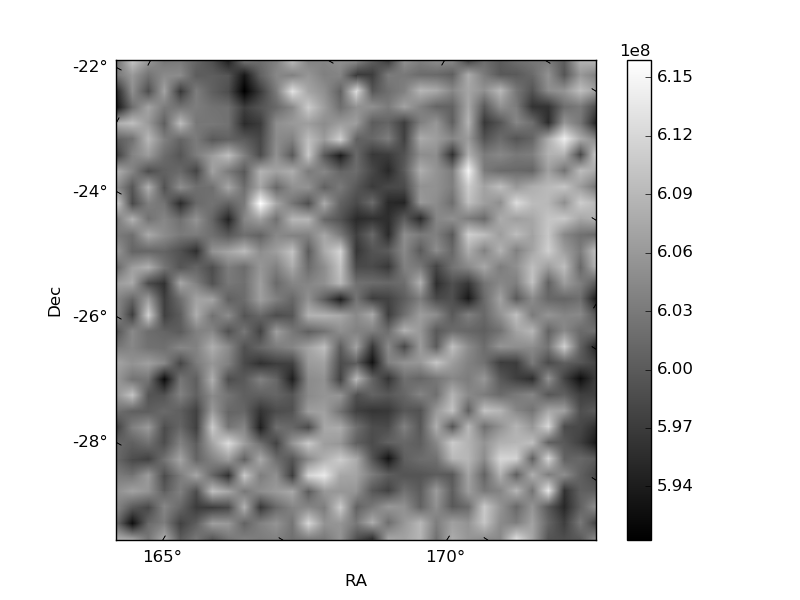
Histogram calculated using DETX and DETY for each event in the final _common_clean file
| Quadrant A | 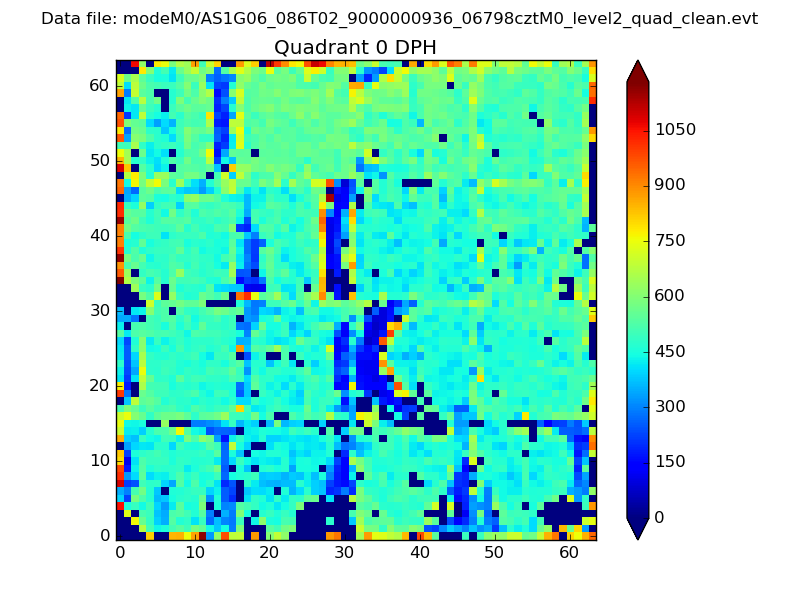 |
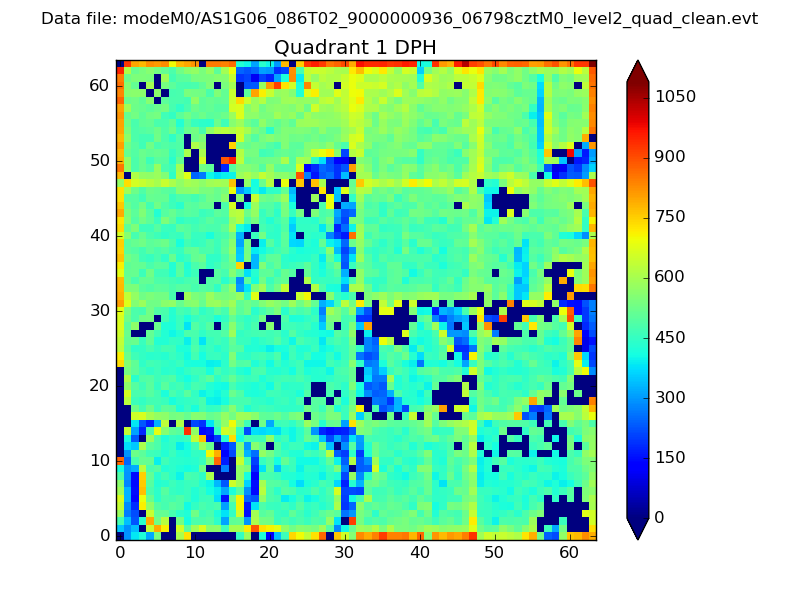 |
Quadrant B |
|---|---|---|---|
| Quadrant D | 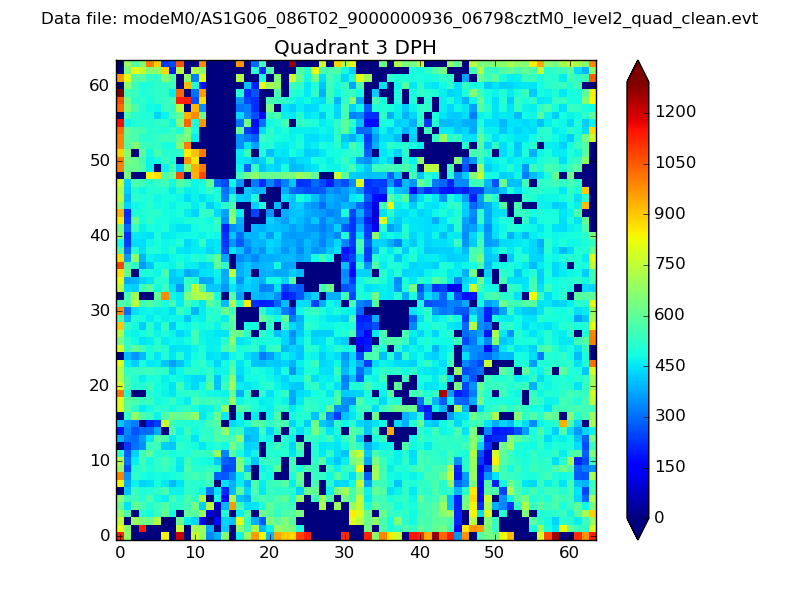 |
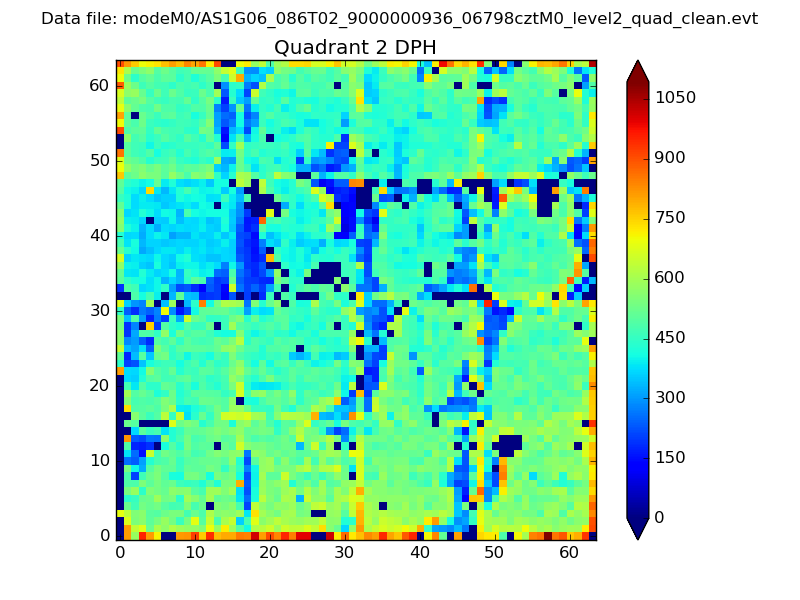 |
Quadrant C |
| Plot type | Count rate plots | Images |
|---|---|---|
| Comparison with Poisson distribution Blue bars denote a histogram of data divided into 1 sec bins. Red curve is a Poisson curve with rate = median count rate of data. |
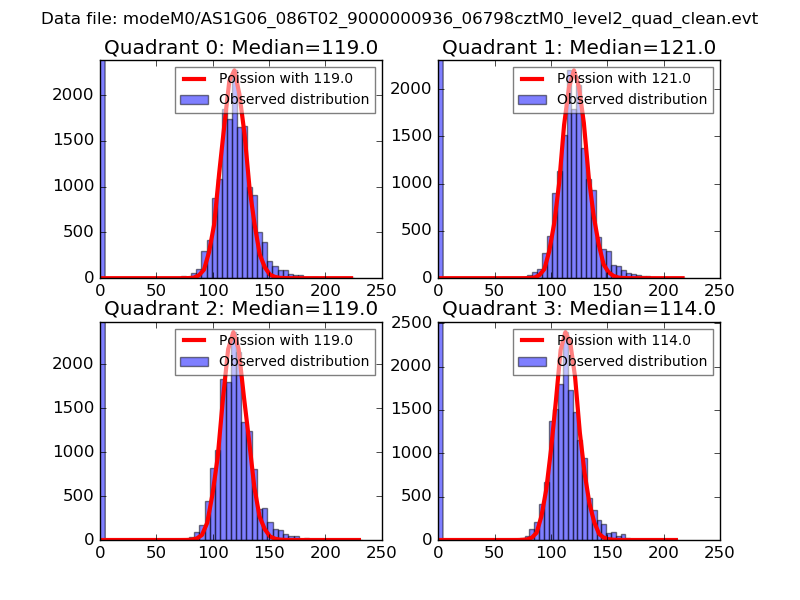 |
 |
| Quadrant-wise count rates Data is divided into 100 sec bins |
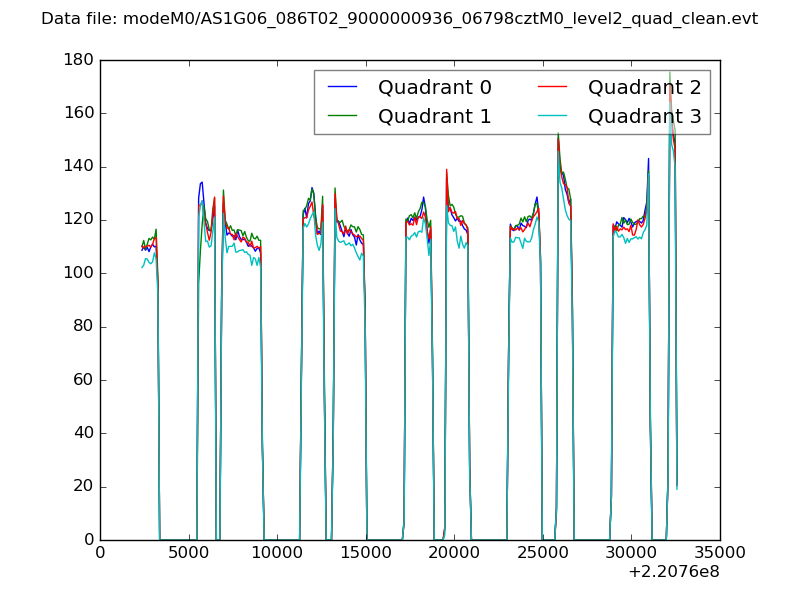 |
|
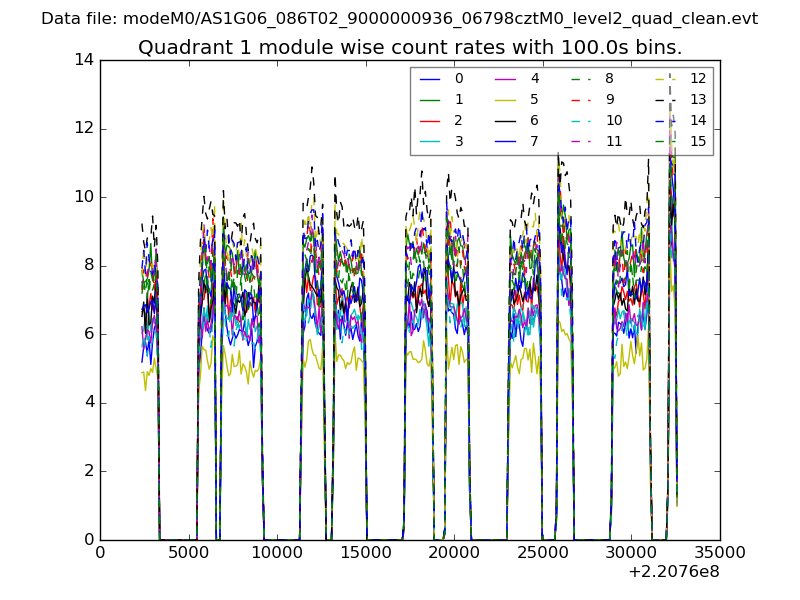
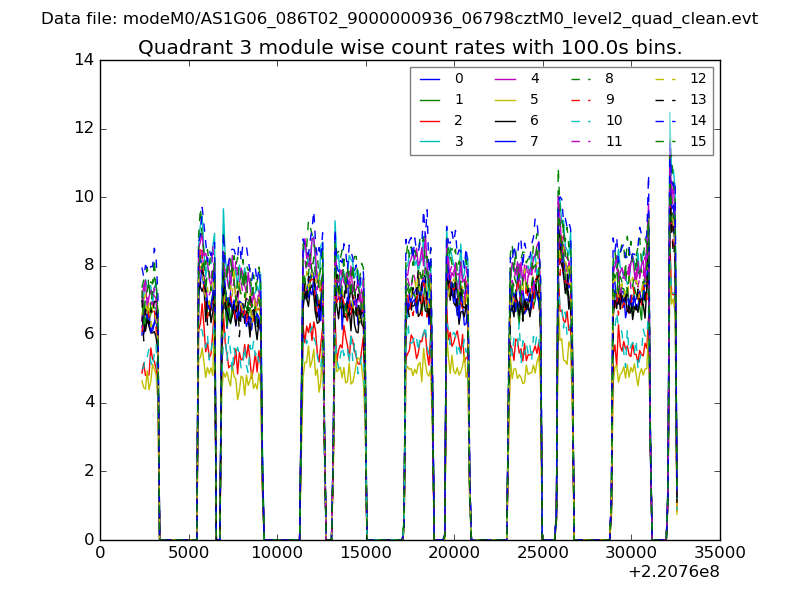
| Module-wise count rates for Quadrant A Data is divided into 100 sec bins |
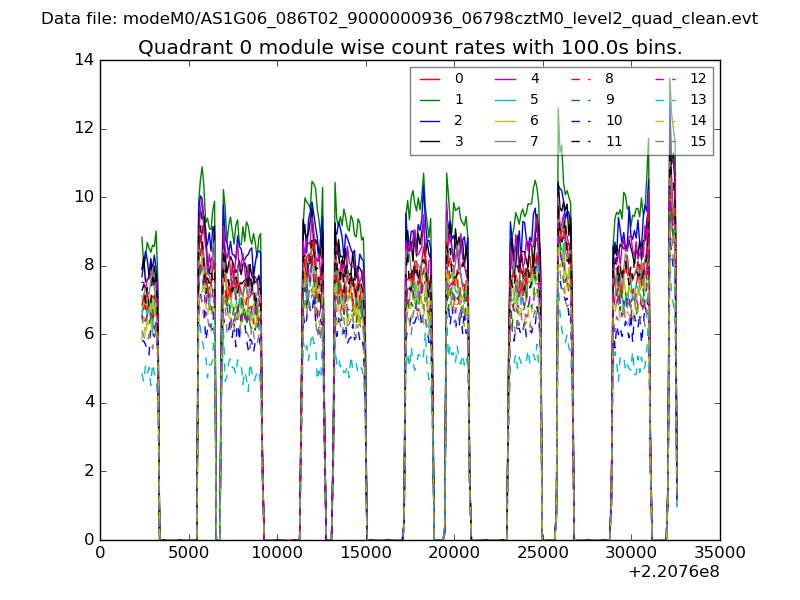 |
 |
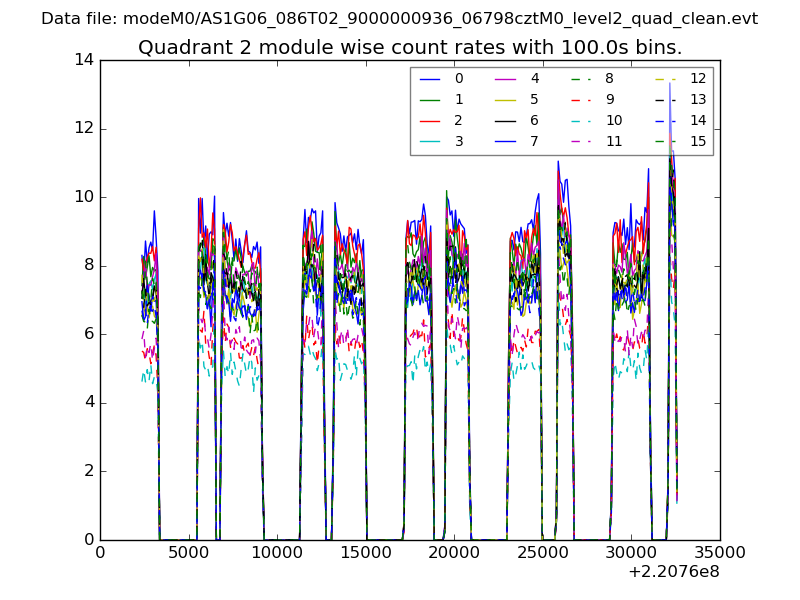
| Module-wise count rates for Quadrant B Data is divided into 100 sec bins |
 |
 |
| Module-wise count rates for Quadrant C Data is divided into 100 sec bins |
 |
 |
| Module-wise count rates for Quadrant D Data is divided into 100 sec bins |
 |
 |
| Parameter | Plot |
|---|---|
| CZT HV Monitor | 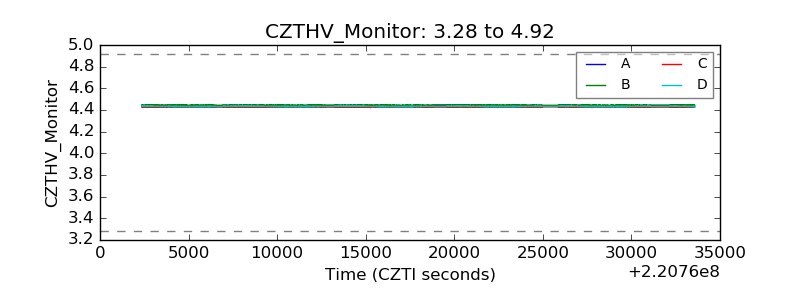 |
| D_VDD | 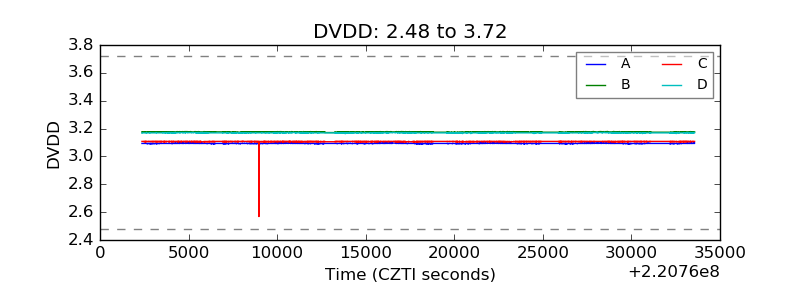 |
| Temperature 1 | 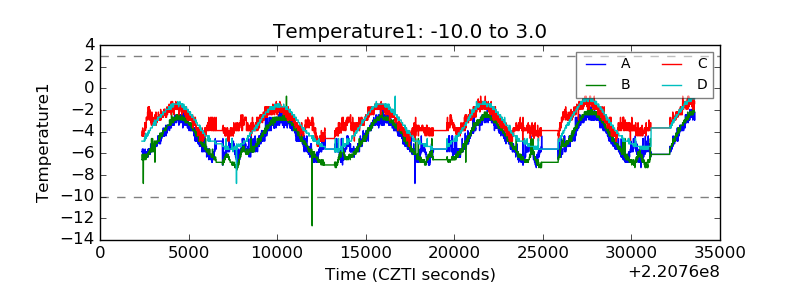 |
| Veto HV Monitor | 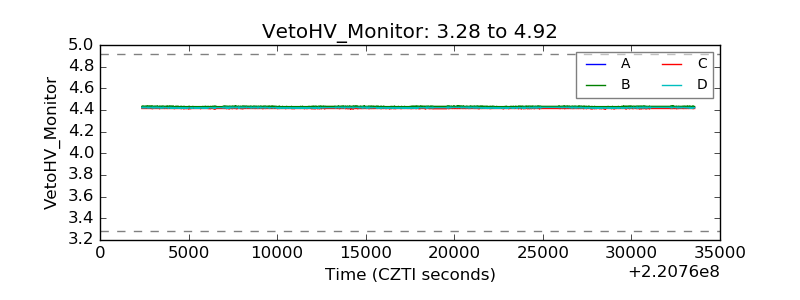 |
| Veto LLD | 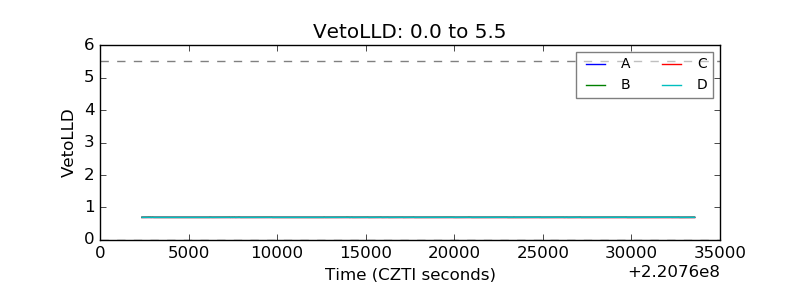 |
| Alpha Counter | 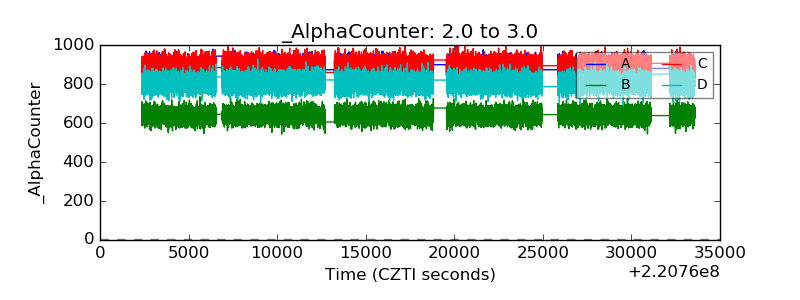 |
| _CPM_Rate | 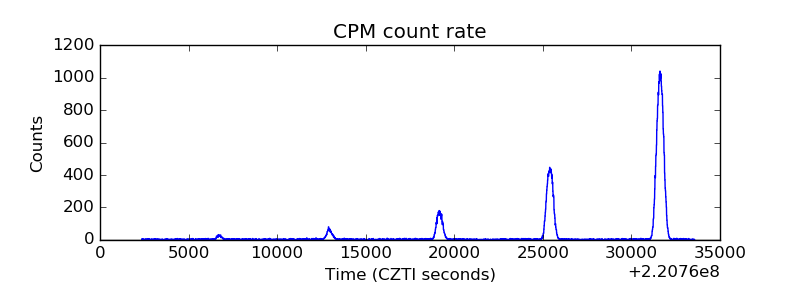 |
| CZT Counter |  |
| +2.5 Volts monitor | 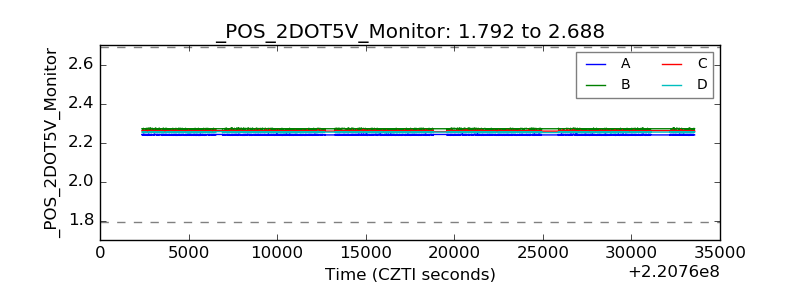 |
| +5 Volts monitor |  |
| _ROLL_ROT |  |
| _Roll_DEC | 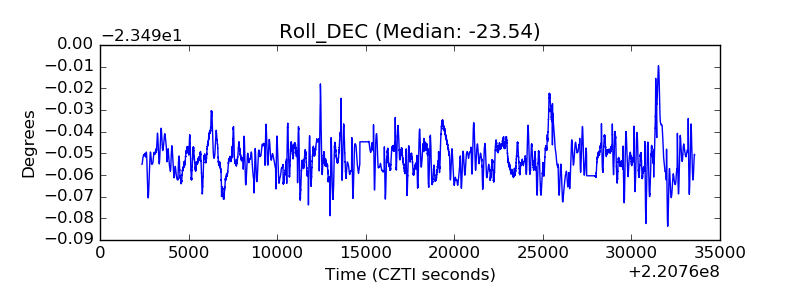 |
| _Roll_RA | 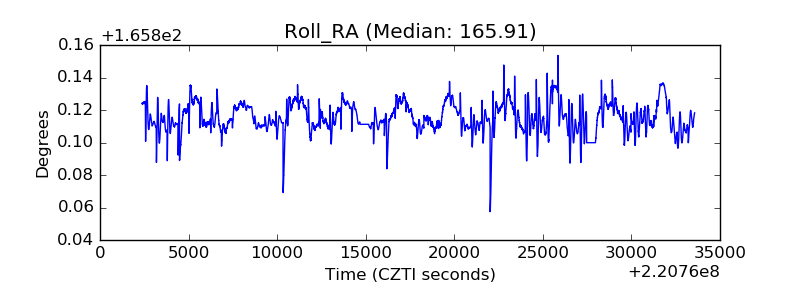 |
| Veto Counter |  |