| Param | Original file | Final file |
|---|---|---|
| Filename | modeM0/AS1G06_086T02_9000000936_06800cztM0_level2.evt | modeM0/AS1G06_086T02_9000000936_06800cztM0_level2_quad_clean.evt |
| Size (bytes) | 463,628,160 | 60,837,120 |
| Size | 442.2 MB | 58.0 MB |
| Events in quadrant A | 3,252,924 | 348,765 |
| Events in quadrant B | 3,515,365 | 351,000 |
| Events in quadrant C | 3,289,975 | 345,808 |
| Events in quadrant D | 3,532,649 | 334,265 |
| Mode M9 | |||
|---|---|---|---|
| Quadrant | BADHDUFLAG | Total packets | Discarded packets |
| A | 0 | 12 | 0 |
| B | 0 | 12 | 0 |
| C | 0 | 12 | 0 |
| D | 0 | 12 | 0 |
| Mode M0 | |||
|---|---|---|---|
| Quadrant | BADHDUFLAG | Total packets | Discarded packets |
| A | 0 | 13946 | 2 |
| B | 0 | 14665 | 1 |
| C | 0 | 14054 | 1 |
| D | 0 | 14653 | 1 |
| Mode SS | |||
|---|---|---|---|
| Quadrant | BADHDUFLAG | Total packets | Discarded packets |
| A | 0 | 134 | 0 |
| B | 0 | 134 | 0 |
| C | 0 | 134 | 0 |
| D | 0 | 134 | 0 |
| Quadrant | Total seconds | Saturated seconds | Saturation percentage |
|---|---|---|---|
| A | 6626 | 53 | 0.799879% |
| B | 6626 | 100 | 1.509206% |
| C | 6626 | 40 | 0.603682% |
| D | 6626 | 72 | 1.086628% |
Noise dominated data is calculated using 1-second bins in cleaned event files. If a bin has >2000 counts, and if more than 50% of those come from <1% of pixels, then it is considered to be noise-dominated and hence unusable.
| Quadrant | # 1 sec bins | Bins with >0 counts | Bins with >2000 counts | High rate bins dominated by noise | Noise dominated (total time) | Noise dominated (detector-on time) | Marked lightcurve |
|---|---|---|---|---|---|---|---|
| A | 7801 | 6627 | 1 | 1 | 0.01% | 0.02% | 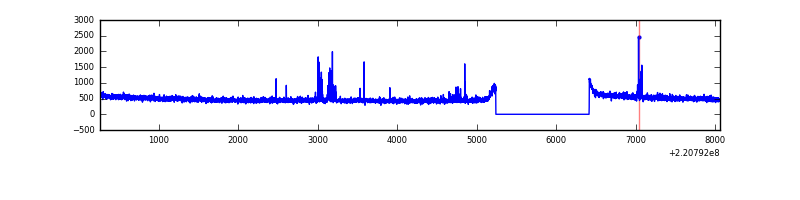 |
| B | 7801 | 6627 | 32 | 32 | 0.41% | 0.48% | 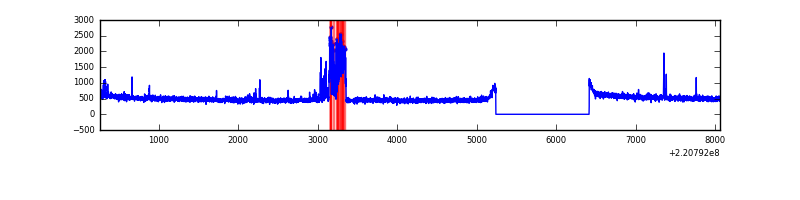 |
| C | 7801 | 6627 | 10 | 10 | 0.13% | 0.15% | 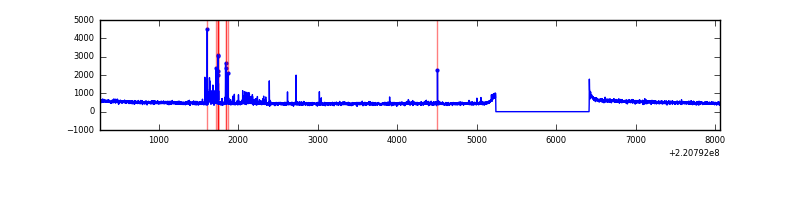 |
| D | 7801 | 6627 | 12 | 12 | 0.15% | 0.18% | 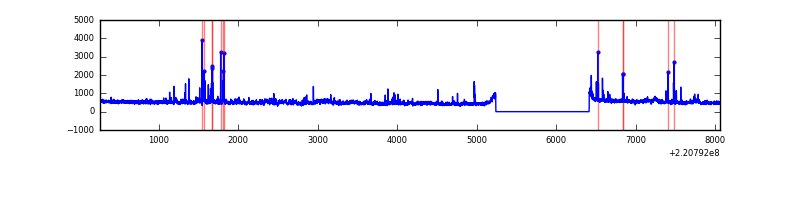 |
Top three noisy pixels from each quadrant. If the there are fewer than three noisy pixels in the level2.evt file, extra rows are filled as -1
| Pixel properties | Quadrant properties | ||||||
|---|---|---|---|---|---|---|---|
| Quadrant | DetID | PixID | Counts | Sigma | Mean | Median | Sigma |
| A | 13 | 248 | 64849 | 382.41 | 827 | 811 | 167.5 |
| A | 0 | 226 | 8005 | 42.96 | 827 | 811 | 167.5 |
| A | 12 | 194 | 7634 | 40.74 | 827 | 811 | 167.5 |
| B | 0 | 228 | 281631 | 1795.2 | 827 | 807 | 156.4 |
| B | 4 | 81 | 18245 | 111.47 | 827 | 807 | 156.4 |
| B | 12 | 111 | 15411 | 93.36 | 827 | 807 | 156.4 |
| C | 12 | 16 | 130746 | 703.47 | 800 | 805 | 184.7 |
| C | 9 | 247 | 37879 | 200.71 | 800 | 805 | 184.7 |
| C | 13 | 61 | 6245 | 29.45 | 800 | 805 | 184.7 |
| D | 8 | 195 | 306031 | 1543.33 | 803 | 777 | 197.8 |
| D | 13 | 169 | 80810 | 404.63 | 803 | 777 | 197.8 |
| D | 5 | 97 | 74445 | 372.45 | 803 | 777 | 197.8 |
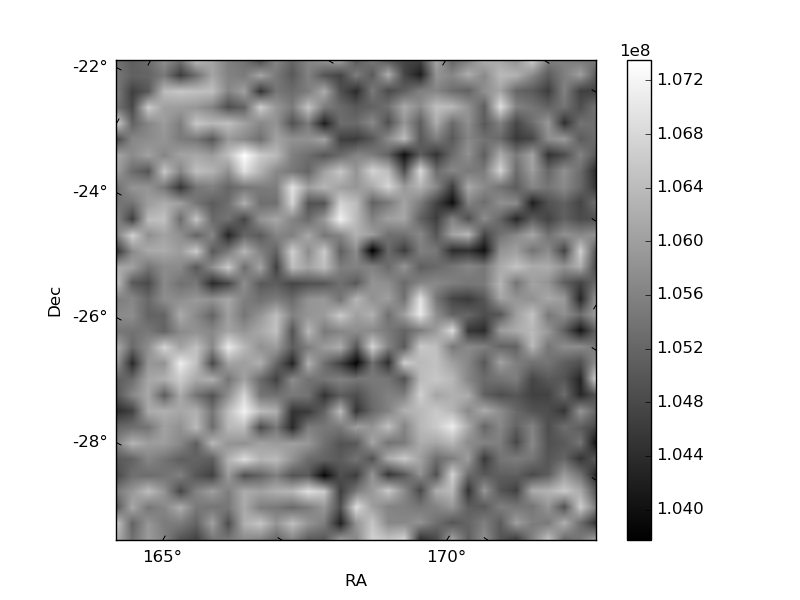
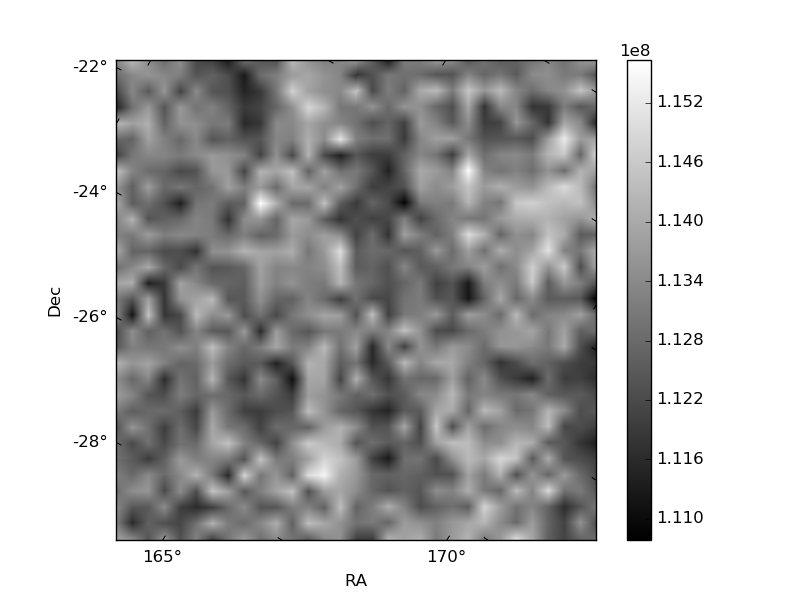
Histogram calculated using DETX and DETY for each event in the final _common_clean file
| Quadrant A | 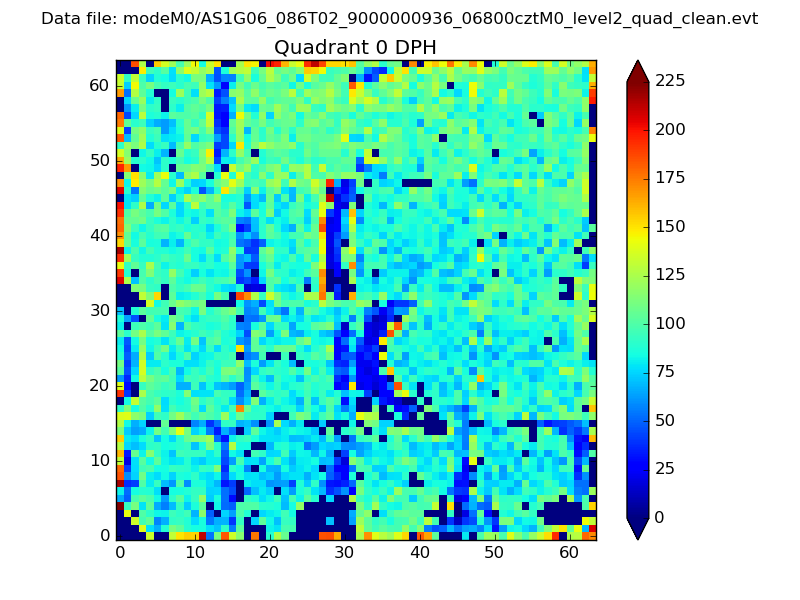 |
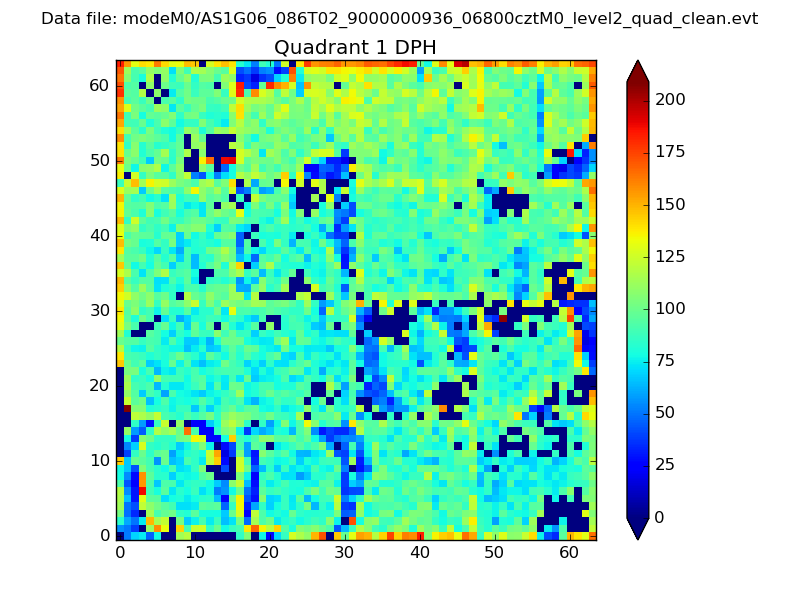 |
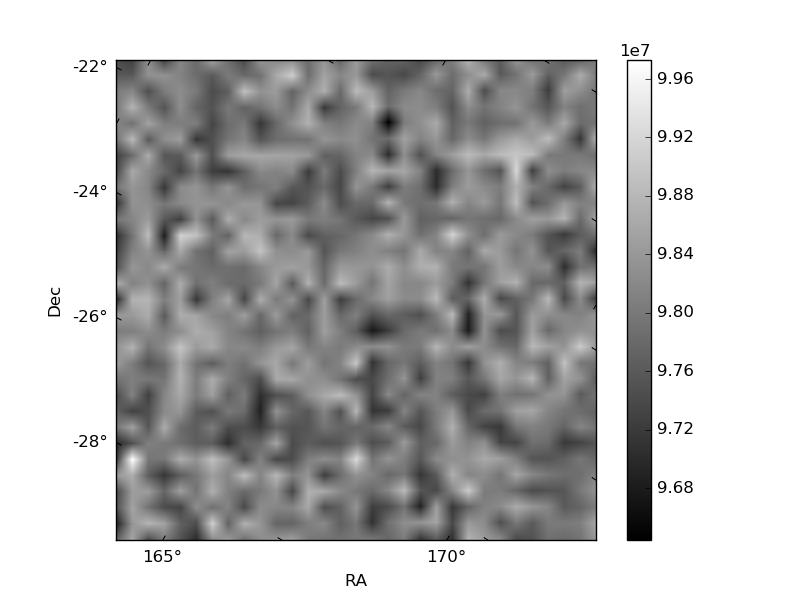
Quadrant B |
|---|---|---|---|
| Quadrant D | 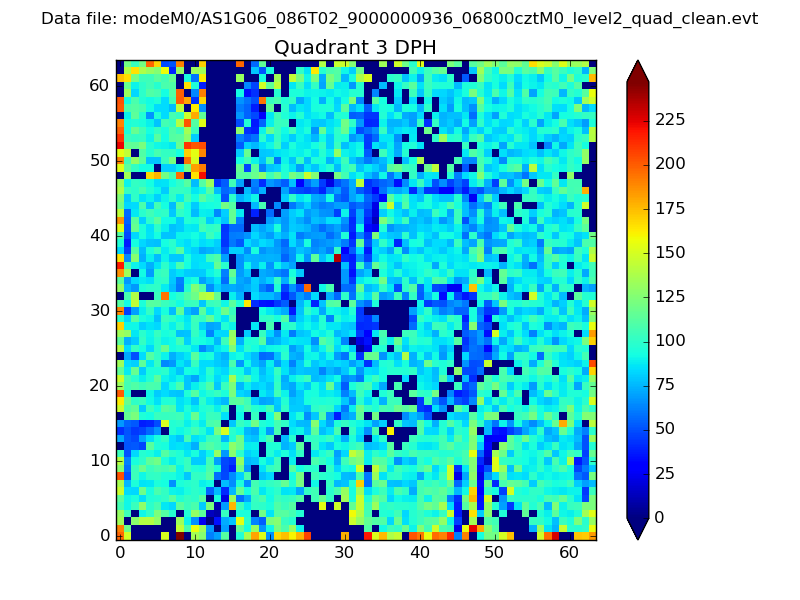 |
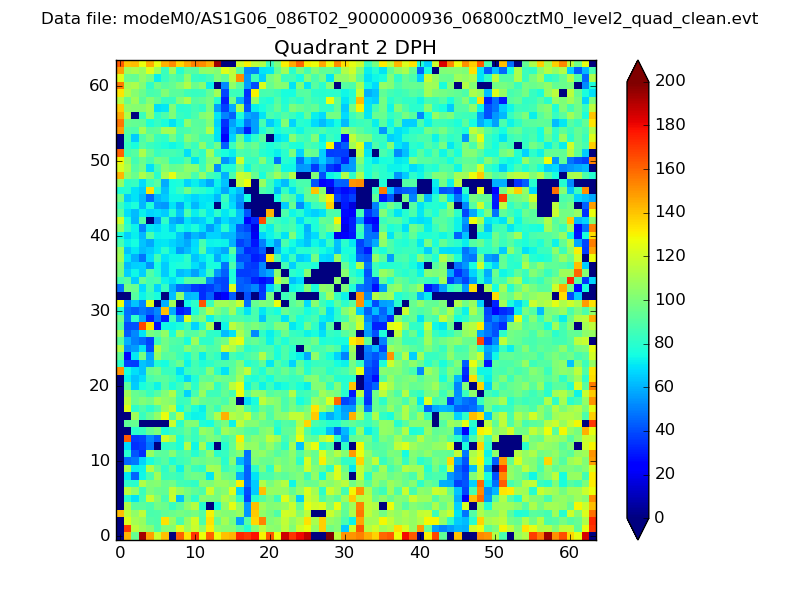 |
Quadrant C |
| Plot type | Count rate plots | Images |
|---|---|---|
| Comparison with Poisson distribution Blue bars denote a histogram of data divided into 1 sec bins. Red curve is a Poisson curve with rate = median count rate of data. |
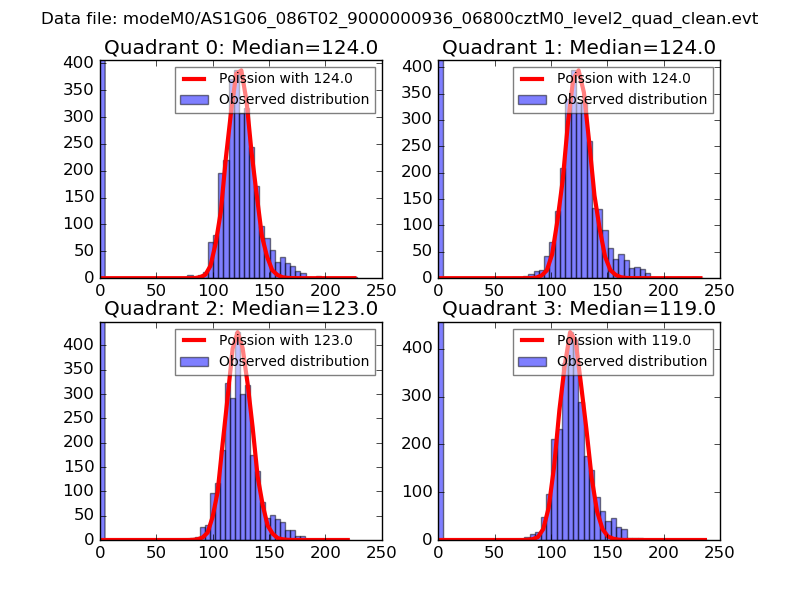 |
 |
| Quadrant-wise count rates Data is divided into 100 sec bins |
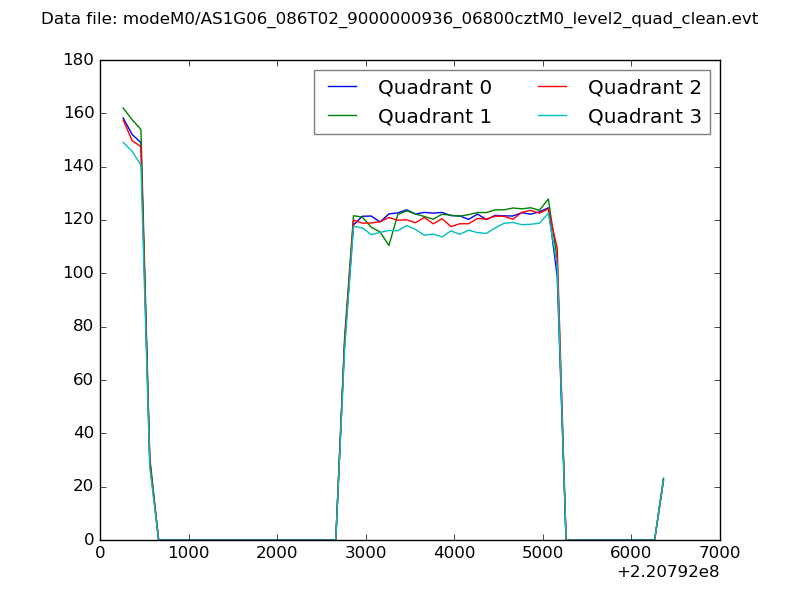 |
|
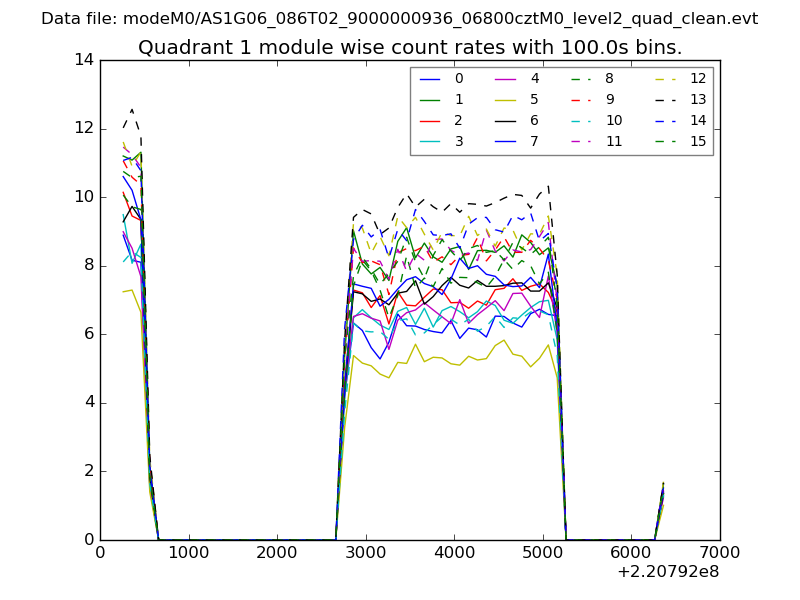
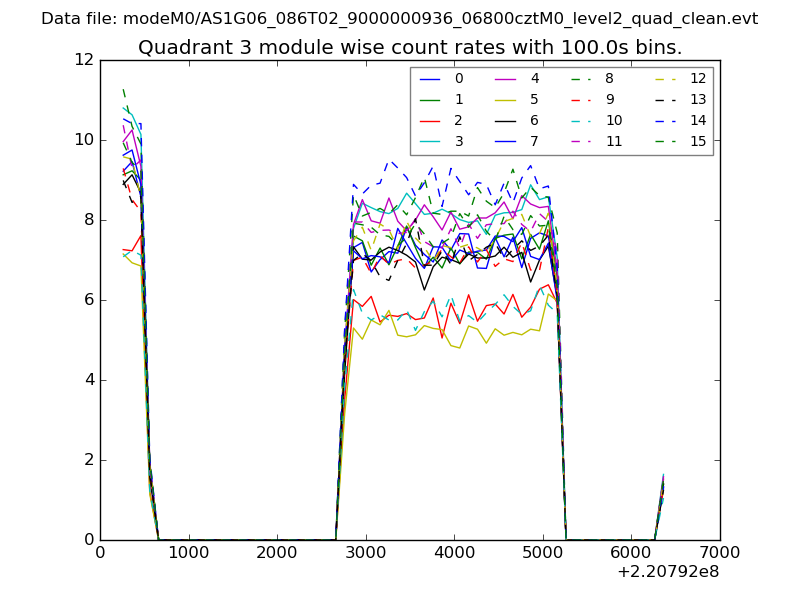
| Module-wise count rates for Quadrant A Data is divided into 100 sec bins |
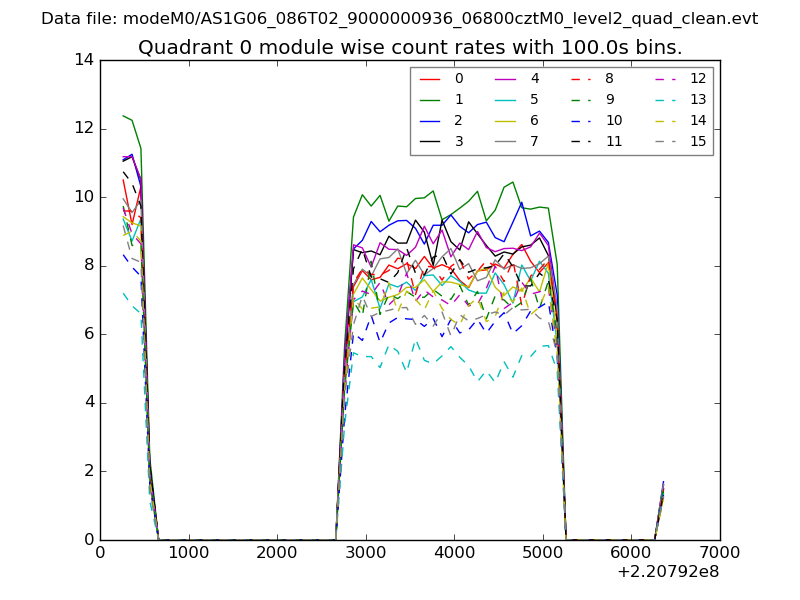 |
 |
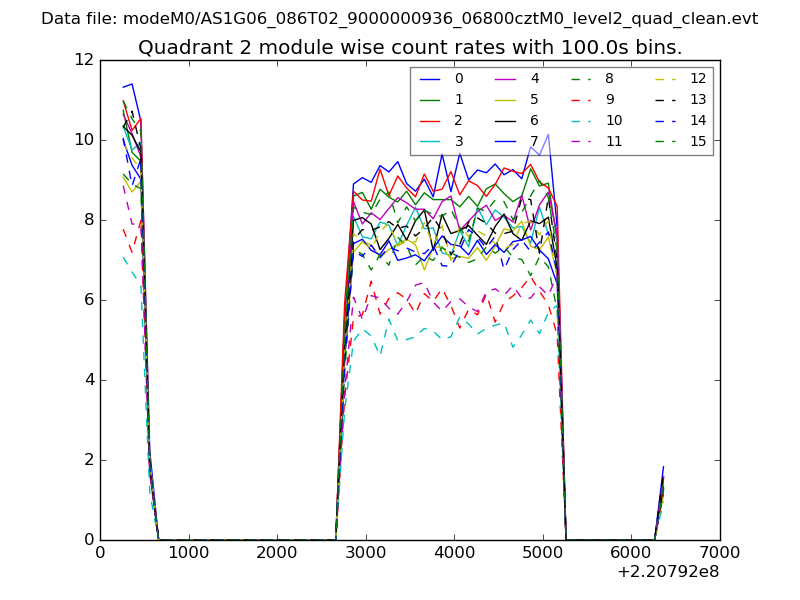
| Module-wise count rates for Quadrant B Data is divided into 100 sec bins |
 |
 |
| Module-wise count rates for Quadrant C Data is divided into 100 sec bins |
 |
 |
| Module-wise count rates for Quadrant D Data is divided into 100 sec bins |
 |
 |
| Parameter | Plot |
|---|---|
| CZT HV Monitor | 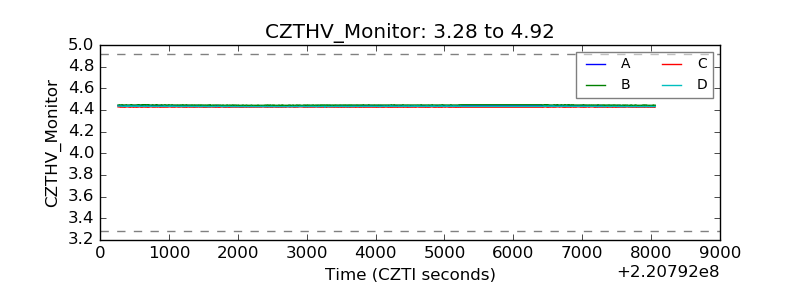 |
| D_VDD | 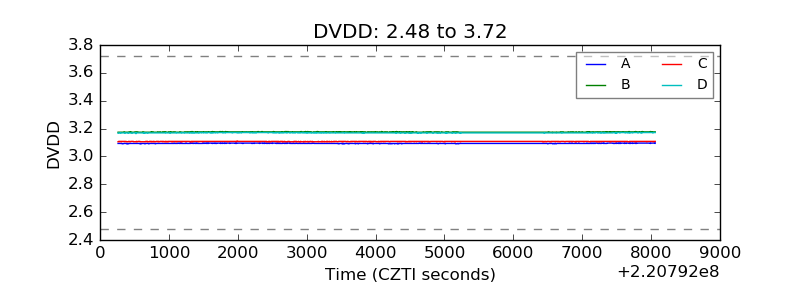 |
| Temperature 1 | 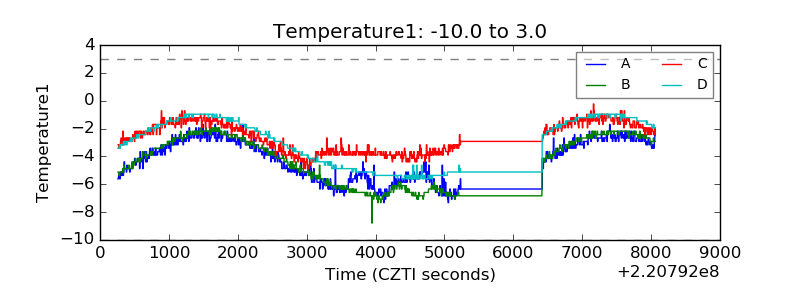 |
| Veto HV Monitor |  |
| Veto LLD | 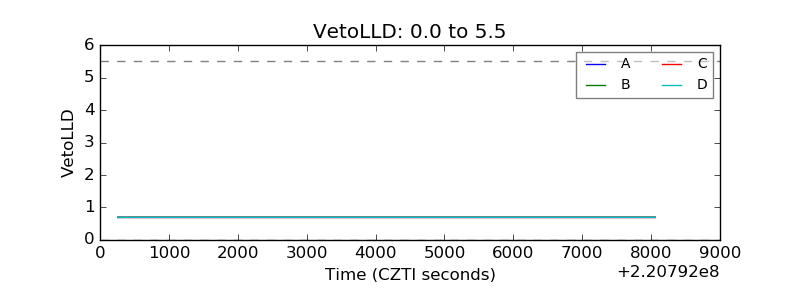 |
| Alpha Counter |  |
| _CPM_Rate | 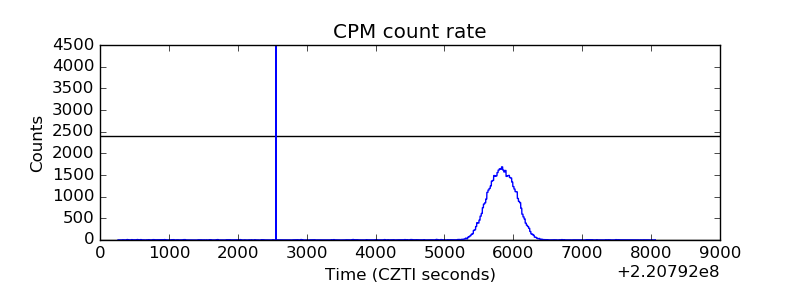 |
| CZT Counter | 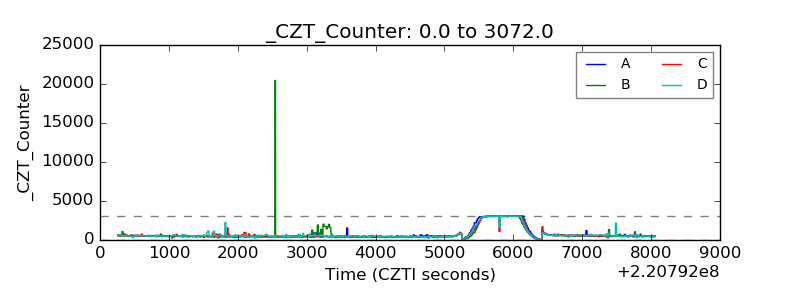 |
| +2.5 Volts monitor |  |
| +5 Volts monitor |  |
| _ROLL_ROT | 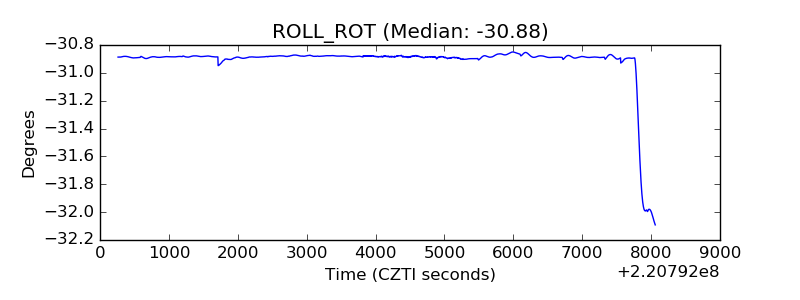 |
| _Roll_DEC | 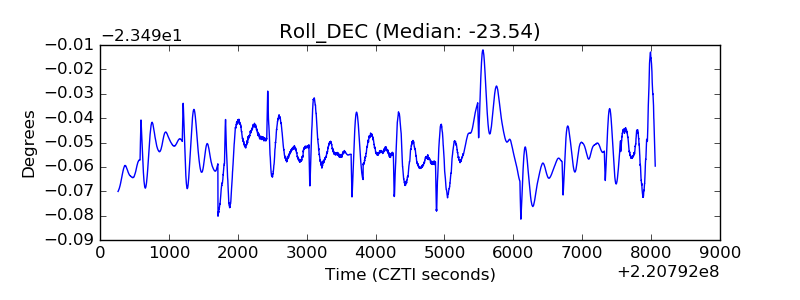 |
| _Roll_RA |  |
| Veto Counter | 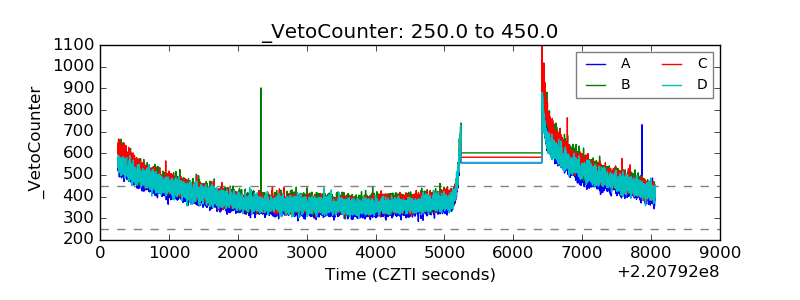 |