| Param | Original file | Final file |
|---|---|---|
| Filename | modeM0/AS1G06_086T02_9000000936_06801cztM0_level2.evt | modeM0/AS1G06_086T02_9000000936_06801cztM0_level2_quad_clean.evt |
| Size (bytes) | 484,732,800 | 61,142,400 |
| Size | 462.3 MB | 58.3 MB |
| Events in quadrant A | 3,329,119 | 355,032 |
| Events in quadrant B | 3,635,457 | 351,323 |
| Events in quadrant C | 3,309,687 | 352,518 |
| Events in quadrant D | 3,965,269 | 339,485 |
| Mode M9 | |||
|---|---|---|---|
| Quadrant | BADHDUFLAG | Total packets | Discarded packets |
| A | 0 | 18 | 0 |
| B | 0 | 18 | 0 |
| C | 0 | 18 | 0 |
| D | 0 | 19 | 0 |
| Mode M0 | |||
|---|---|---|---|
| Quadrant | BADHDUFLAG | Total packets | Discarded packets |
| A | 0 | 14093 | 3 |
| B | 0 | 15100 | 2 |
| C | 0 | 13997 | 2 |
| D | 0 | 16281 | 2 |
| Mode SS | |||
|---|---|---|---|
| Quadrant | BADHDUFLAG | Total packets | Discarded packets |
| A | 0 | 132 | 0 |
| B | 0 | 132 | 0 |
| C | 0 | 132 | 0 |
| D | 0 | 132 | 0 |
| Quadrant | Total seconds | Saturated seconds | Saturation percentage |
|---|---|---|---|
| A | 6487 | 102 | 1.572376% |
| B | 6487 | 185 | 2.851858% |
| C | 6487 | 64 | 0.986589% |
| D | 6487 | 201 | 3.098505% |
Noise dominated data is calculated using 1-second bins in cleaned event files. If a bin has >2000 counts, and if more than 50% of those come from <1% of pixels, then it is considered to be noise-dominated and hence unusable.
| Quadrant | # 1 sec bins | Bins with >0 counts | Bins with >2000 counts | High rate bins dominated by noise | Noise dominated (total time) | Noise dominated (detector-on time) | Marked lightcurve |
|---|---|---|---|---|---|---|---|
| A | 7747 | 6488 | 2 | 2 | 0.03% | 0.03% | 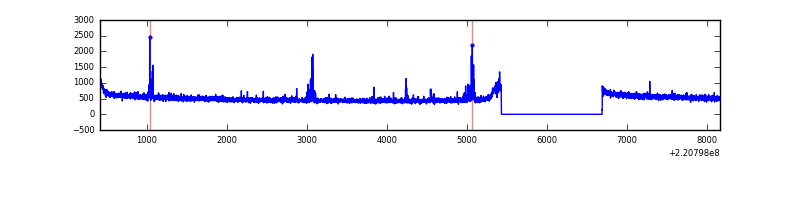 |
| B | 7747 | 6488 | 77 | 77 | 0.99% | 1.19% | 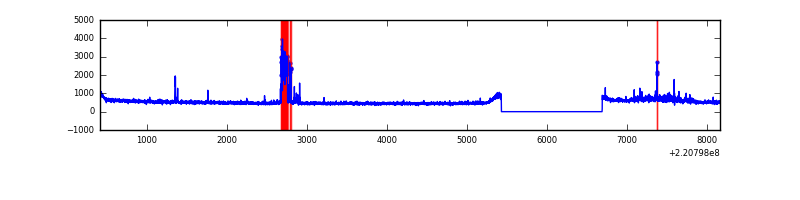 |
| C | 7747 | 6488 | 4 | 4 | 0.05% | 0.06% | 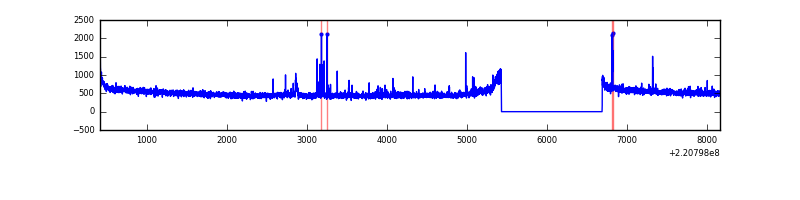 |
| D | 7747 | 6488 | 79 | 79 | 1.02% | 1.22% | 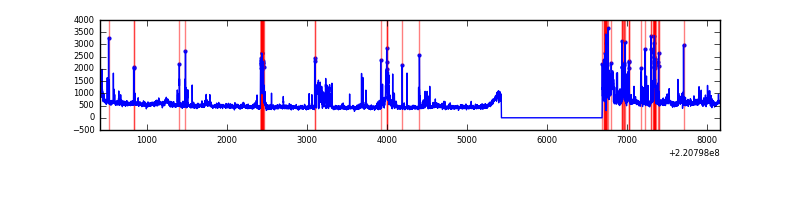 |
Top three noisy pixels from each quadrant. If the there are fewer than three noisy pixels in the level2.evt file, extra rows are filled as -1
| Pixel properties | Quadrant properties | ||||||
|---|---|---|---|---|---|---|---|
| Quadrant | DetID | PixID | Counts | Sigma | Mean | Median | Sigma |
| A | 13 | 248 | 70777 | 411.19 | 845 | 828 | 170.1 |
| A | 0 | 226 | 8309 | 43.98 | 845 | 828 | 170.1 |
| A | 12 | 194 | 7795 | 40.95 | 845 | 828 | 170.1 |
| B | 0 | 228 | 256100 | 1609.75 | 842 | 826 | 158.6 |
| B | 11 | 51 | 90323 | 564.36 | 842 | 826 | 158.6 |
| B | 12 | 111 | 15219 | 90.76 | 842 | 826 | 158.6 |
| C | 12 | 16 | 70540 | 372.89 | 816 | 822 | 187.0 |
| C | 9 | 247 | 53709 | 282.87 | 816 | 822 | 187.0 |
| C | 13 | 61 | 6402 | 29.84 | 816 | 822 | 187.0 |
| D | 13 | 169 | 496640 | 2486.06 | 813 | 787 | 199.5 |
| D | 8 | 195 | 162783 | 812.2 | 813 | 787 | 199.5 |
| D | 14 | 34 | 123200 | 613.74 | 813 | 787 | 199.5 |
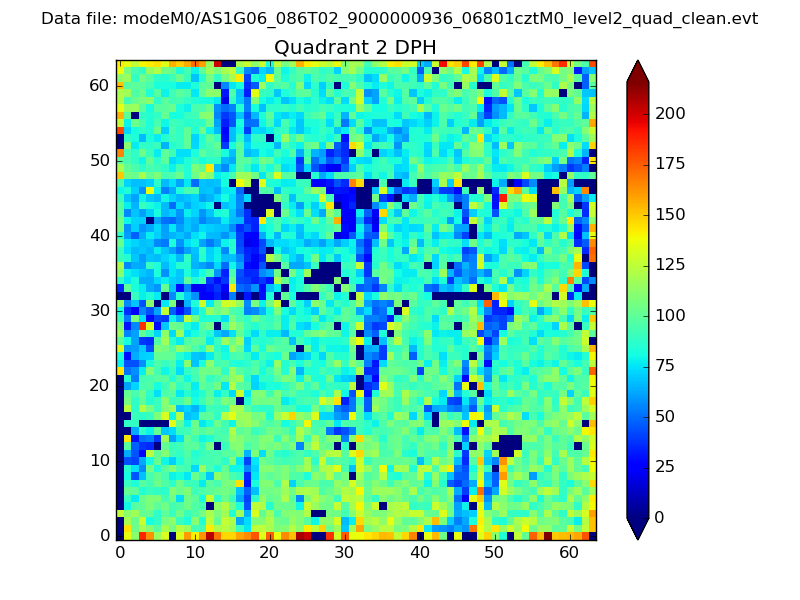
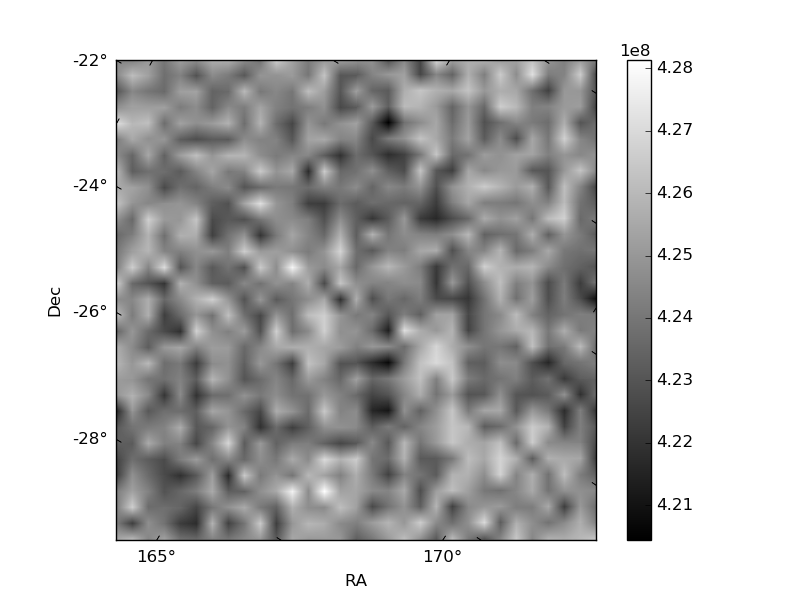
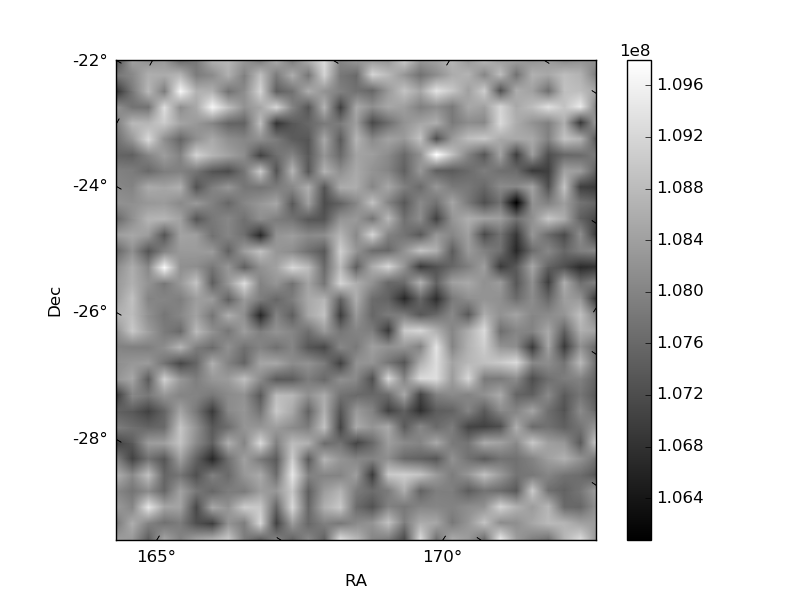
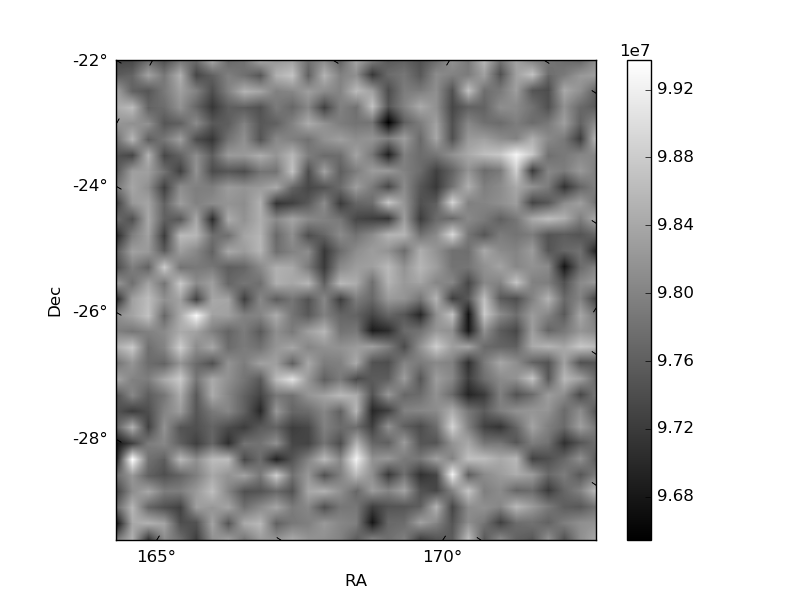
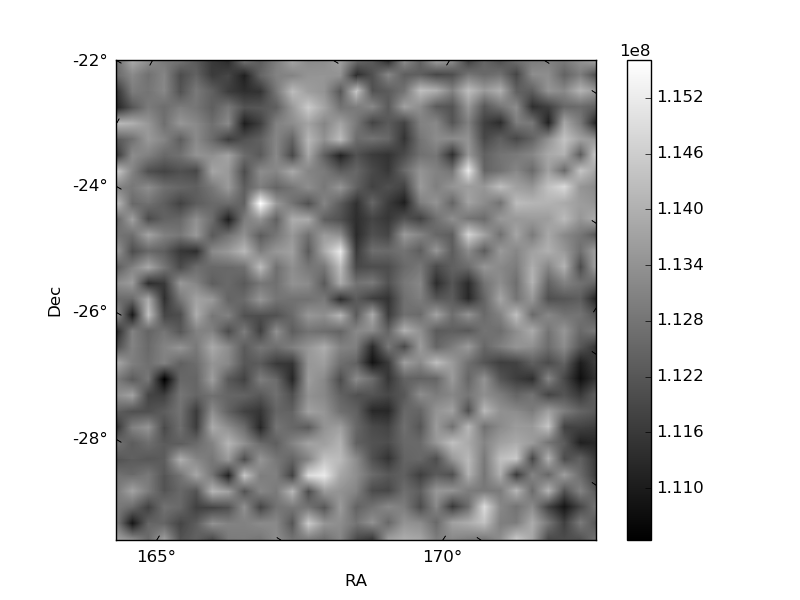
Histogram calculated using DETX and DETY for each event in the final _common_clean file
| Quadrant A | 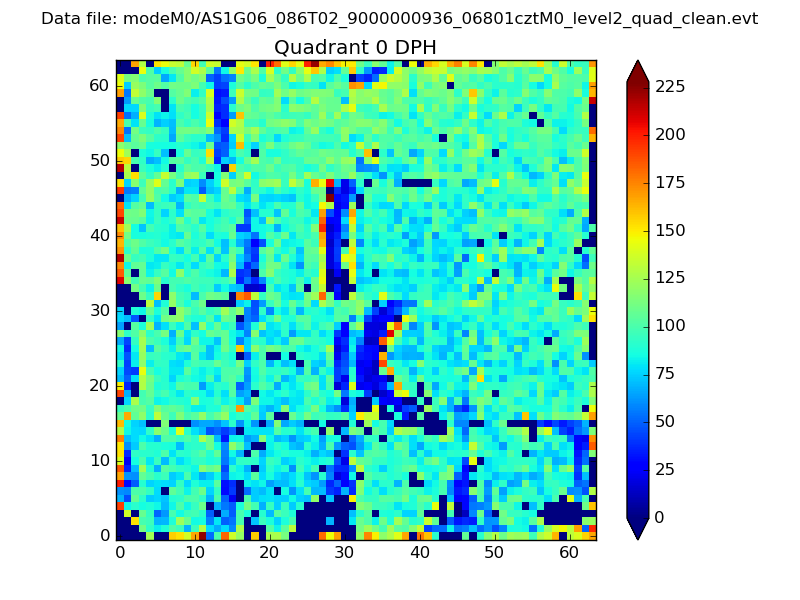 |
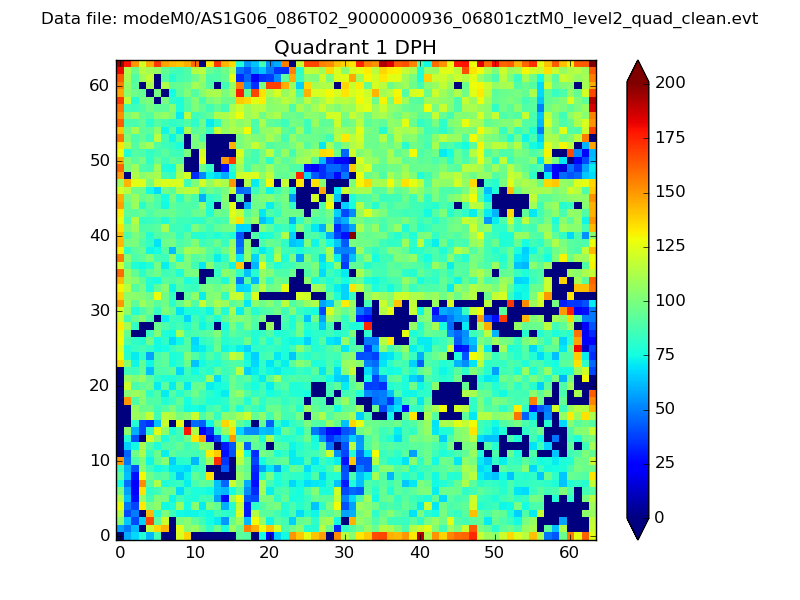 |
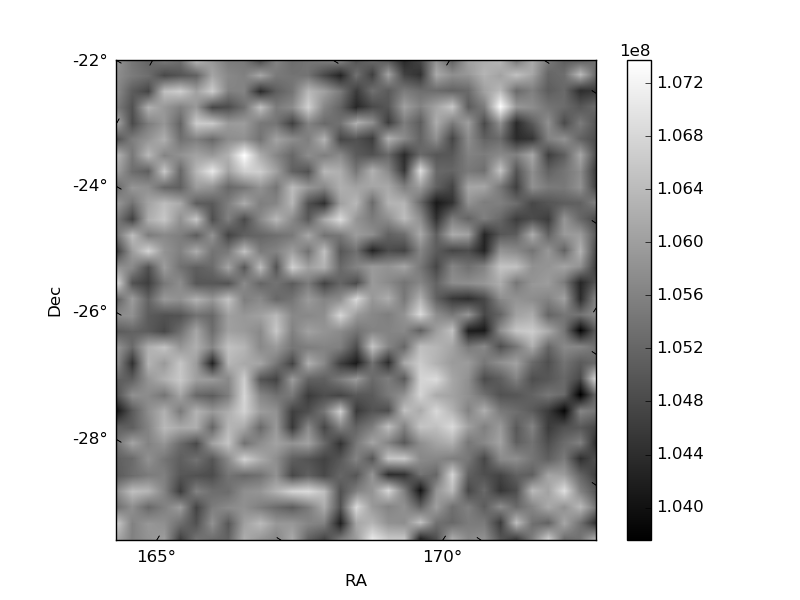
Quadrant B |
|---|---|---|---|
| Quadrant D | 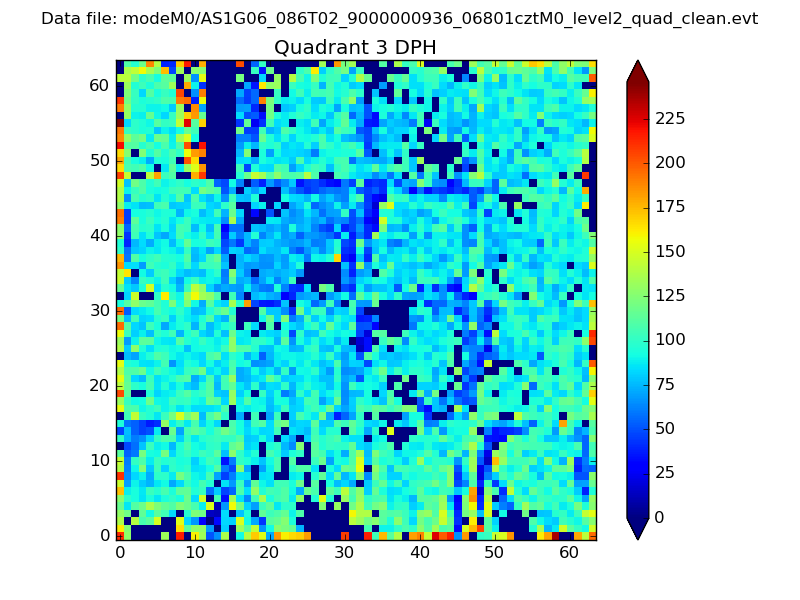 |
 |
Quadrant C |
| Plot type | Count rate plots | Images |
|---|---|---|
| Comparison with Poisson distribution Blue bars denote a histogram of data divided into 1 sec bins. Red curve is a Poisson curve with rate = median count rate of data. |
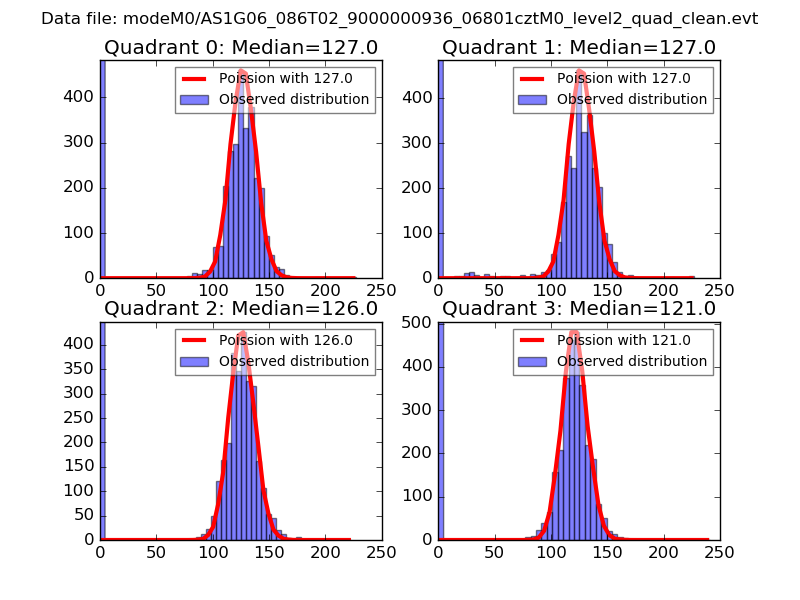 |
 |
| Quadrant-wise count rates Data is divided into 100 sec bins |
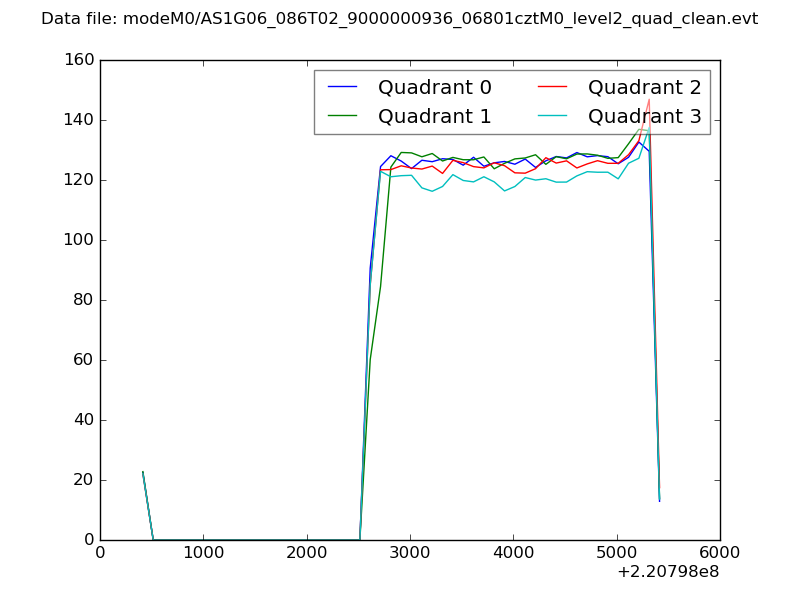 |
|
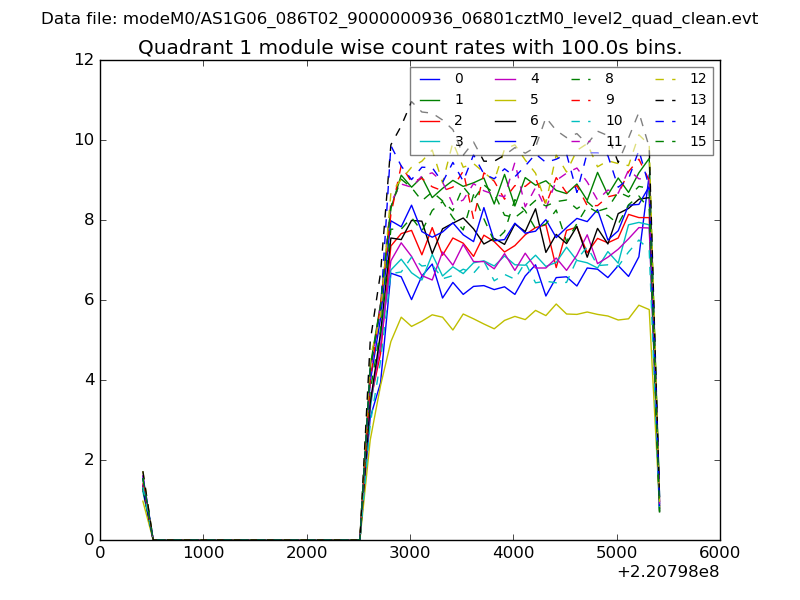
| Module-wise count rates for Quadrant A Data is divided into 100 sec bins |
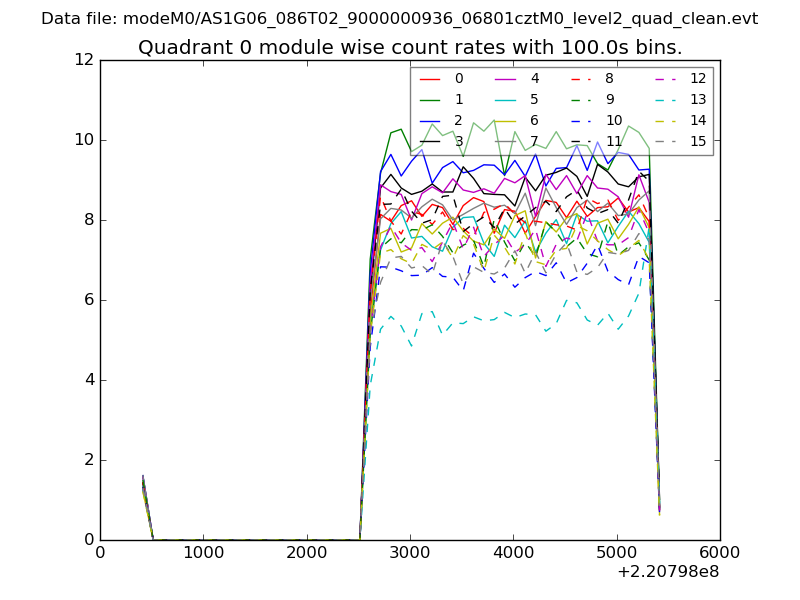 |
 |
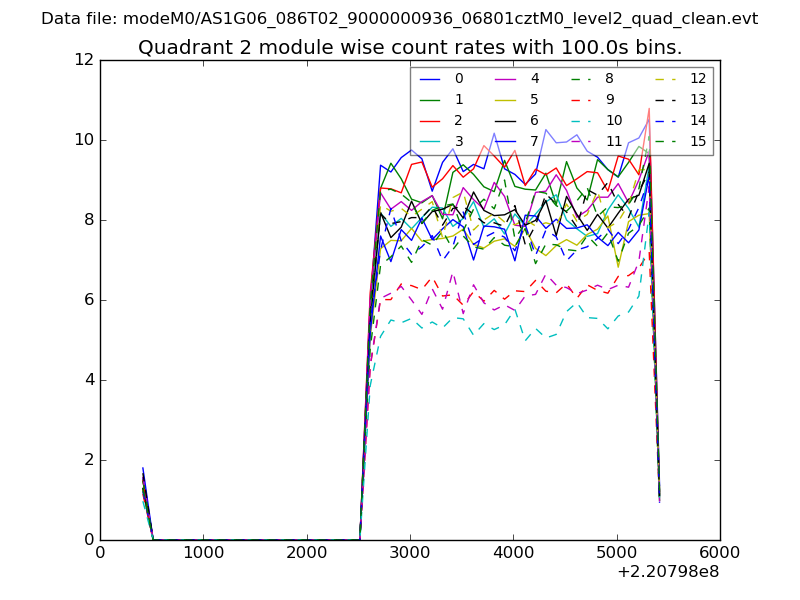
| Module-wise count rates for Quadrant B Data is divided into 100 sec bins |
 |
 |
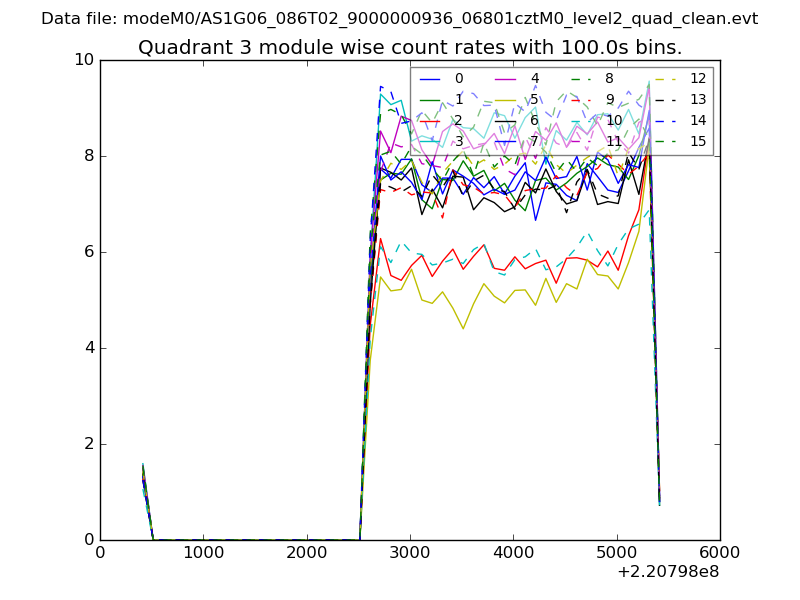
| Module-wise count rates for Quadrant C Data is divided into 100 sec bins |
 |
 |
| Module-wise count rates for Quadrant D Data is divided into 100 sec bins |
 |
 |
| Parameter | Plot |
|---|---|
| CZT HV Monitor | 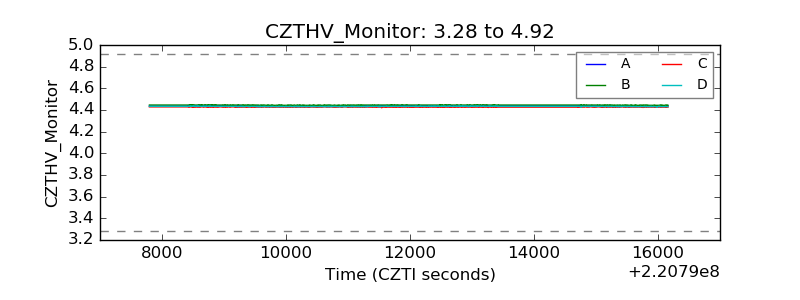 |
| D_VDD | 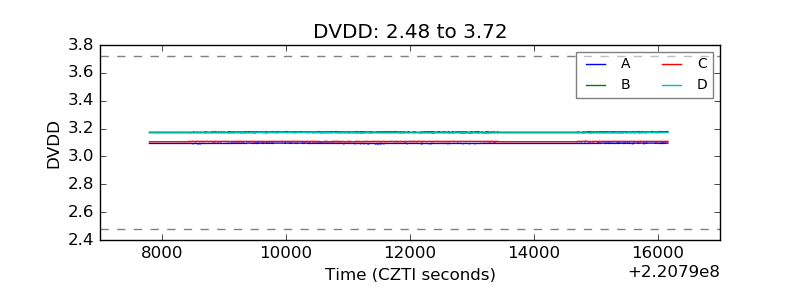 |
| Temperature 1 | 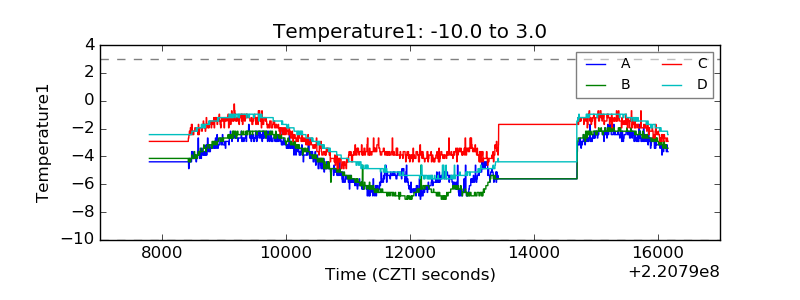 |
| Veto HV Monitor | 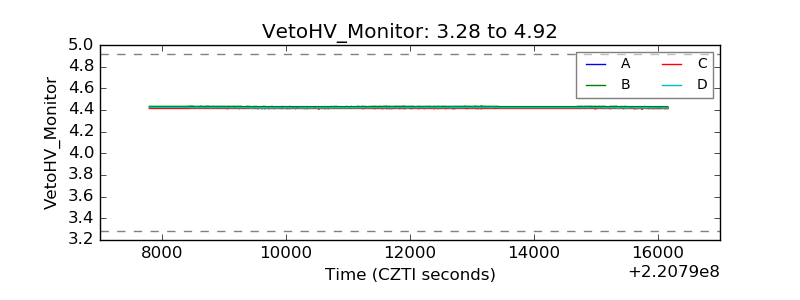 |
| Veto LLD | 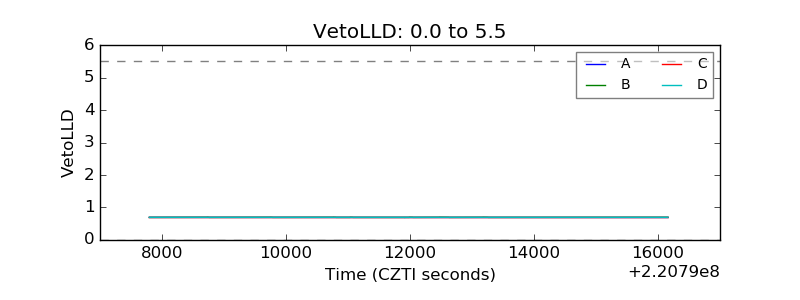 |
| Alpha Counter | 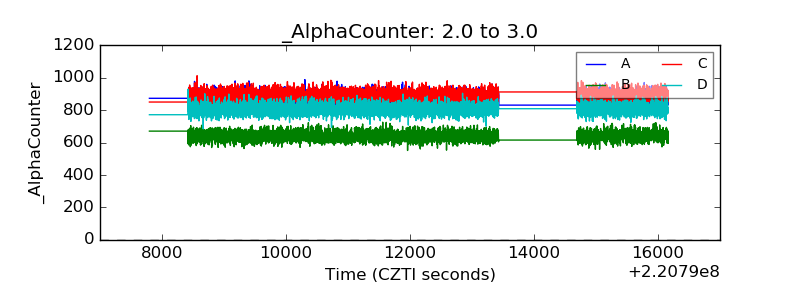 |
| _CPM_Rate | 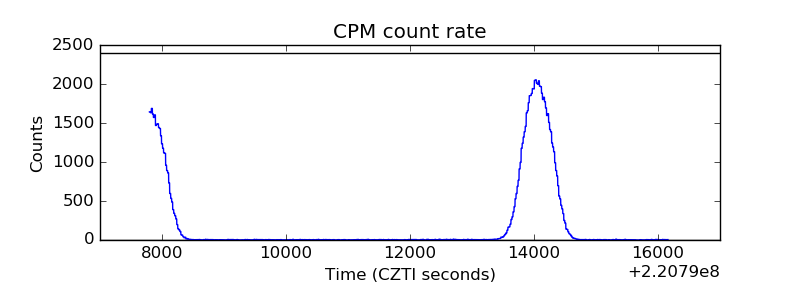 |
| CZT Counter | 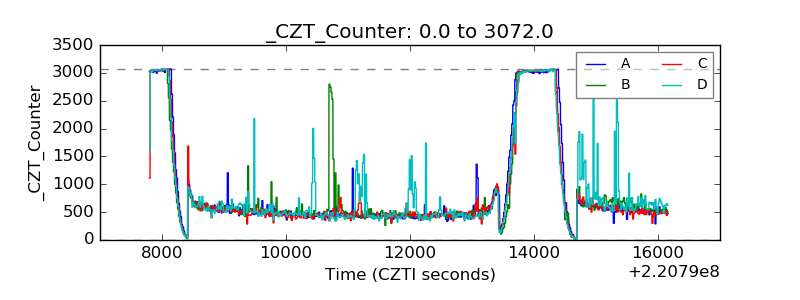 |
| +2.5 Volts monitor |  |
| +5 Volts monitor |  |
| _ROLL_ROT | 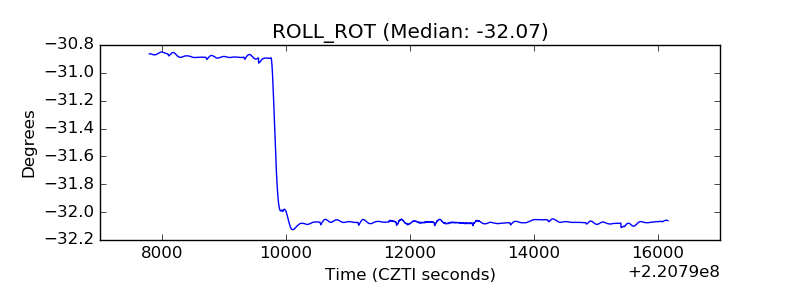 |
| _Roll_DEC | 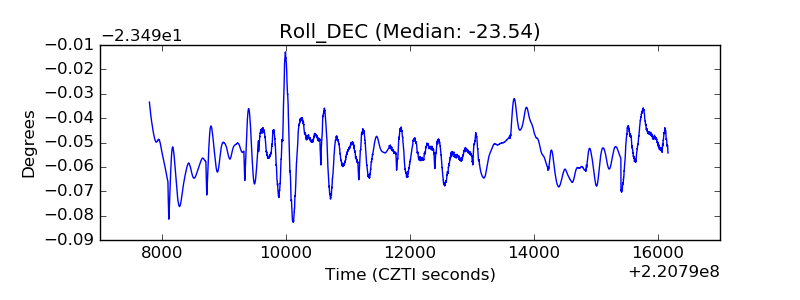 |
| _Roll_RA | 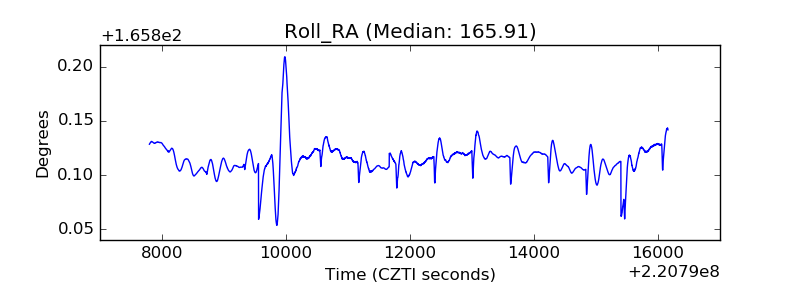 |
| Veto Counter | 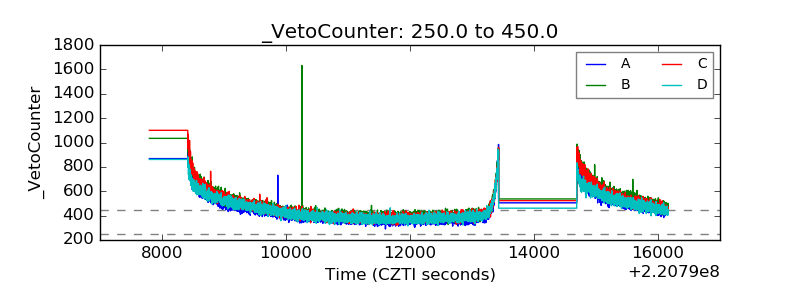 |