| Param | Original file | Final file |
|---|---|---|
| Filename | modeM0/AS1G06_086T02_9000000936_06804cztM0_level2.evt | modeM0/AS1G06_086T02_9000000936_06804cztM0_level2_quad_clean.evt |
| Size (bytes) | 464,581,440 | 87,088,320 |
| Size | 443.1 MB | 83.1 MB |
| Events in quadrant A | 3,134,257 | 555,891 |
| Events in quadrant B | 3,459,473 | 559,925 |
| Events in quadrant C | 3,311,036 | 545,158 |
| Events in quadrant D | 3,724,939 | 524,316 |
| Mode M9 | |||
|---|---|---|---|
| Quadrant | BADHDUFLAG | Total packets | Discarded packets |
| A | 0 | 22 | 0 |
| B | 0 | 22 | 0 |
| C | 0 | 22 | 0 |
| D | 0 | 23 | 0 |
| Mode M0 | |||
|---|---|---|---|
| Quadrant | BADHDUFLAG | Total packets | Discarded packets |
| A | 0 | 13613 | 3 |
| B | 0 | 14437 | 2 |
| C | 0 | 13899 | 2 |
| D | 0 | 15445 | 2 |
| Mode SS | |||
|---|---|---|---|
| Quadrant | BADHDUFLAG | Total packets | Discarded packets |
| A | 0 | 132 | 0 |
| B | 0 | 132 | 0 |
| C | 0 | 132 | 0 |
| D | 0 | 132 | 0 |
| Quadrant | Total seconds | Saturated seconds | Saturation percentage |
|---|---|---|---|
| A | 6480 | 69 | 1.064815% |
| B | 6480 | 127 | 1.959877% |
| C | 6480 | 18 | 0.277778% |
| D | 6480 | 81 | 1.250000% |
Noise dominated data is calculated using 1-second bins in cleaned event files. If a bin has >2000 counts, and if more than 50% of those come from <1% of pixels, then it is considered to be noise-dominated and hence unusable.
| Quadrant | # 1 sec bins | Bins with >0 counts | Bins with >2000 counts | High rate bins dominated by noise | Noise dominated (total time) | Noise dominated (detector-on time) | Marked lightcurve |
|---|---|---|---|---|---|---|---|
| A | 7680 | 6481 | 1 | 1 | 0.01% | 0.02% | 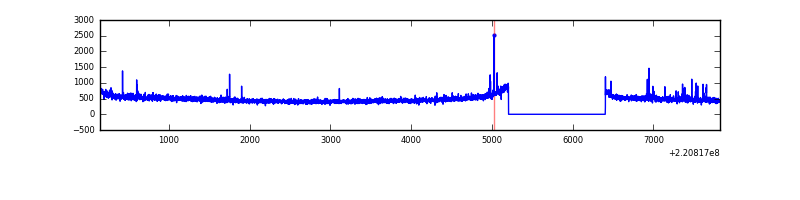 |
| B | 7680 | 6481 | 35 | 35 | 0.46% | 0.54% | 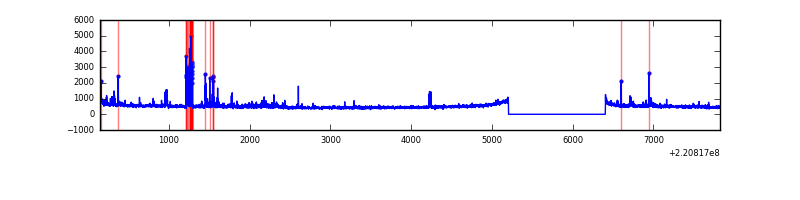 |
| C | 7680 | 6481 | 0 | 0 | 0.00% | 0.00% | 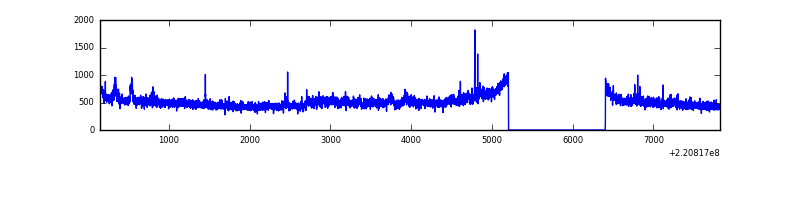 |
| D | 7680 | 6481 | 35 | 35 | 0.46% | 0.54% | 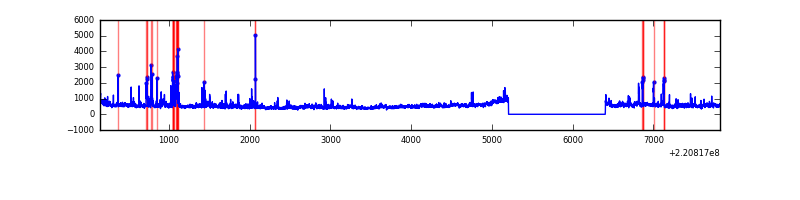 |
Top three noisy pixels from each quadrant. If the there are fewer than three noisy pixels in the level2.evt file, extra rows are filled as -1
| Pixel properties | Quadrant properties | ||||||
|---|---|---|---|---|---|---|---|
| Quadrant | DetID | PixID | Counts | Sigma | Mean | Median | Sigma |
| A | 8 | 15 | 39014 | 237.41 | 797 | 780 | 161.0 |
| A | 14 | 111 | 12118 | 70.4 | 797 | 780 | 161.0 |
| A | 0 | 226 | 7733 | 43.17 | 797 | 780 | 161.0 |
| B | 4 | 81 | 152364 | 990.45 | 802 | 786 | 153.0 |
| B | 11 | 51 | 71313 | 460.84 | 802 | 786 | 153.0 |
| B | 0 | 228 | 57912 | 373.28 | 802 | 786 | 153.0 |
| C | 9 | 247 | 284541 | 1583.88 | 771 | 774 | 179.2 |
| C | 12 | 16 | 18283 | 97.73 | 771 | 774 | 179.2 |
| C | 13 | 61 | 6140 | 29.95 | 771 | 774 | 179.2 |
| D | 8 | 195 | 421962 | 2249.55 | 762 | 738 | 187.2 |
| D | 2 | 33 | 178097 | 947.19 | 762 | 738 | 187.2 |
| D | 2 | 216 | 87899 | 465.48 | 762 | 738 | 187.2 |
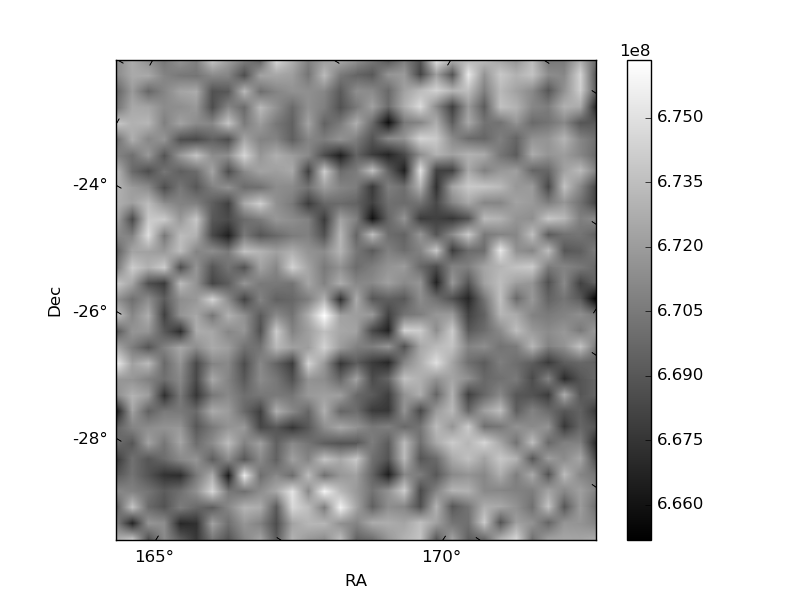
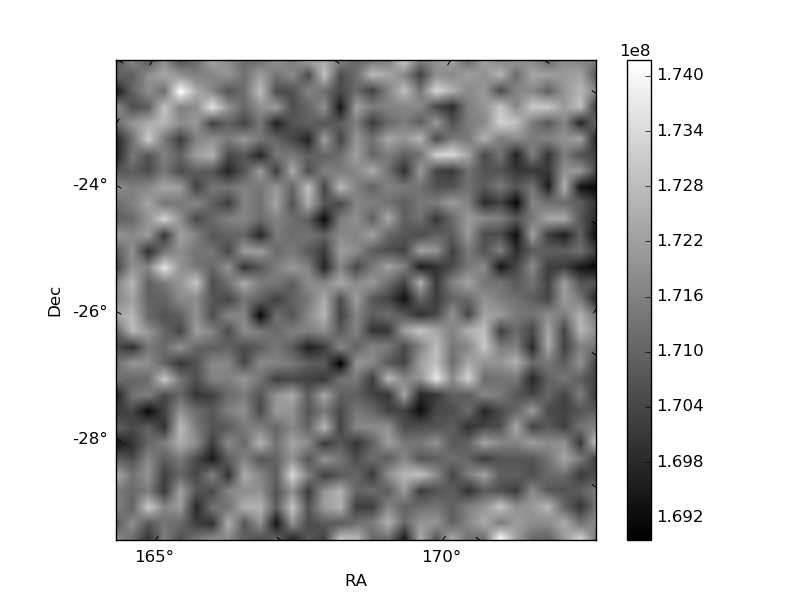
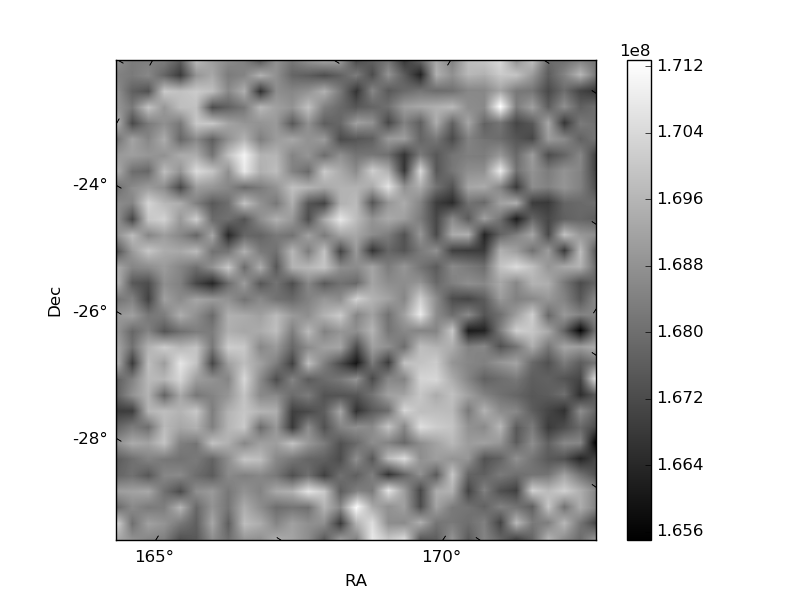
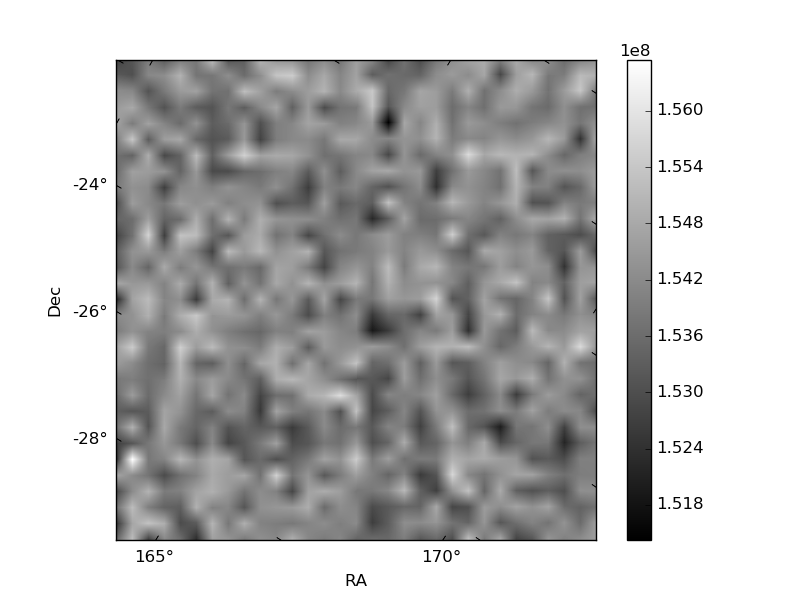
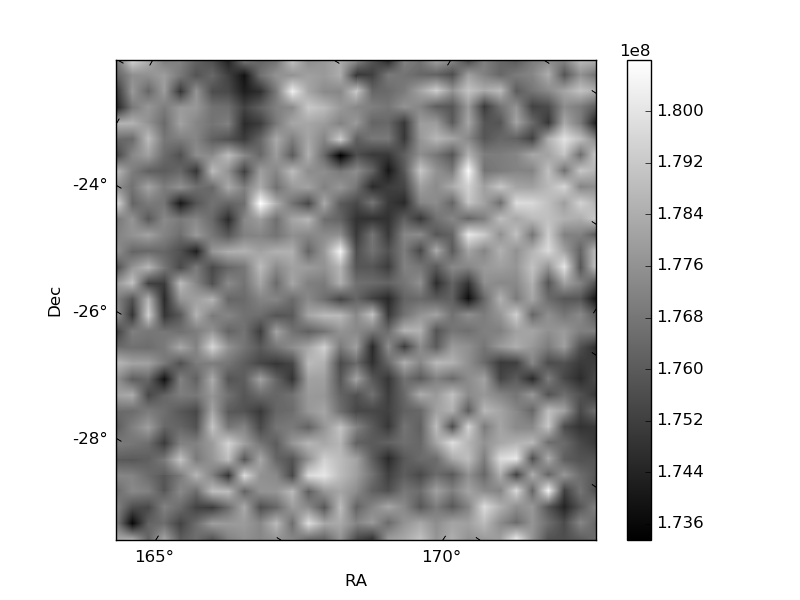
Histogram calculated using DETX and DETY for each event in the final _common_clean file
| Quadrant A | 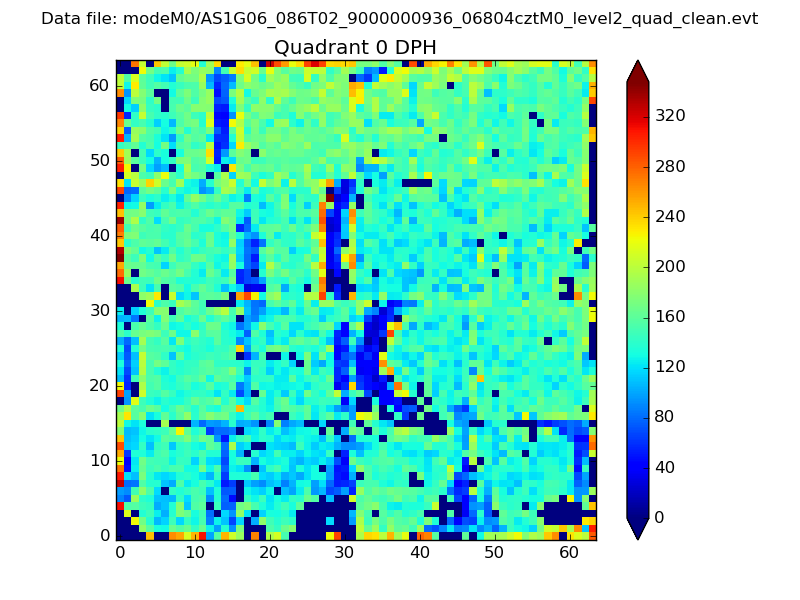 |
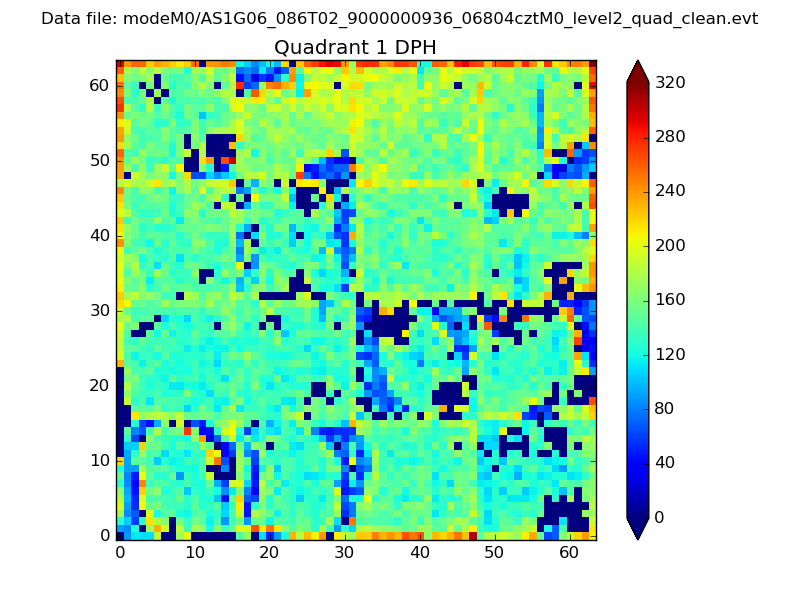 |
Quadrant B |
|---|---|---|---|
| Quadrant D | 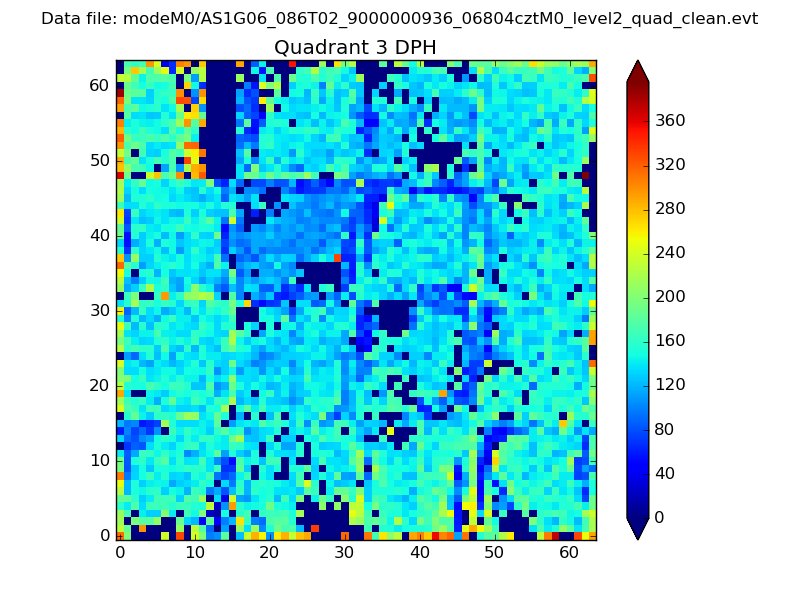 |
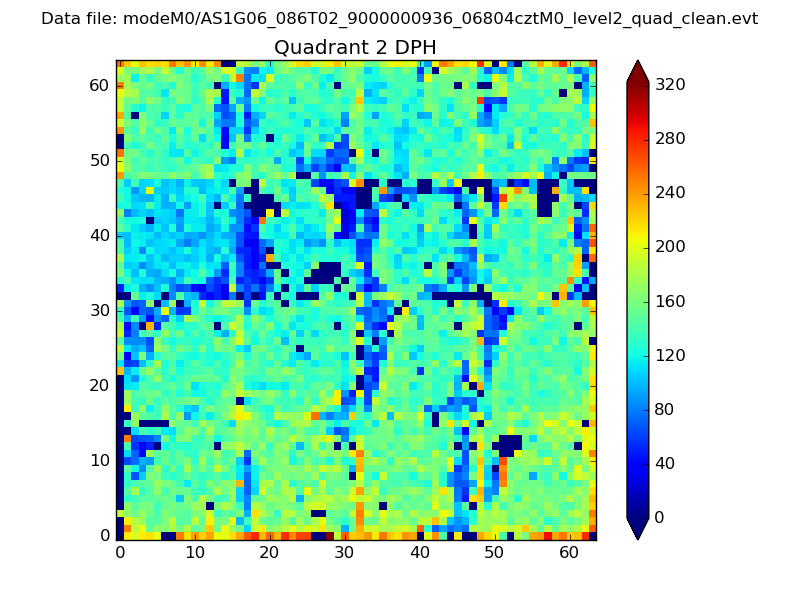 |
Quadrant C |
| Plot type | Count rate plots | Images |
|---|---|---|
| Comparison with Poisson distribution Blue bars denote a histogram of data divided into 1 sec bins. Red curve is a Poisson curve with rate = median count rate of data. |
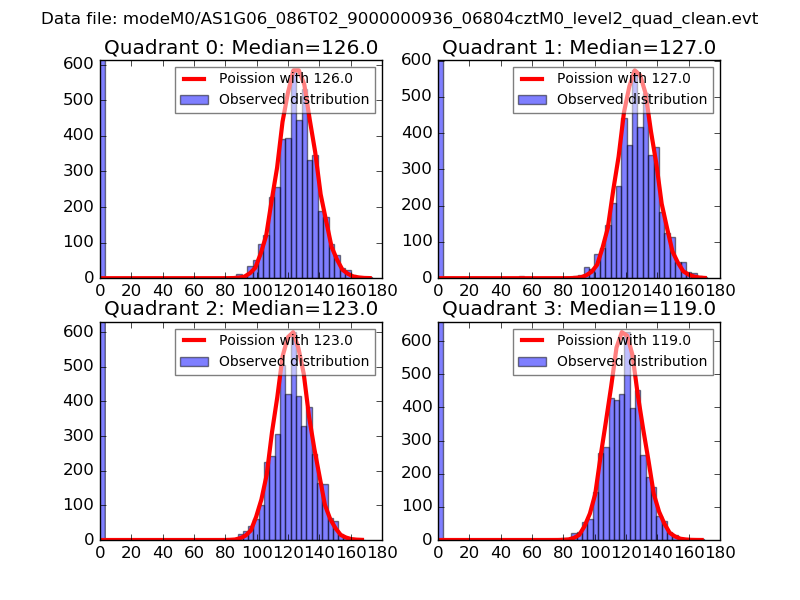 |
 |
| Quadrant-wise count rates Data is divided into 100 sec bins |
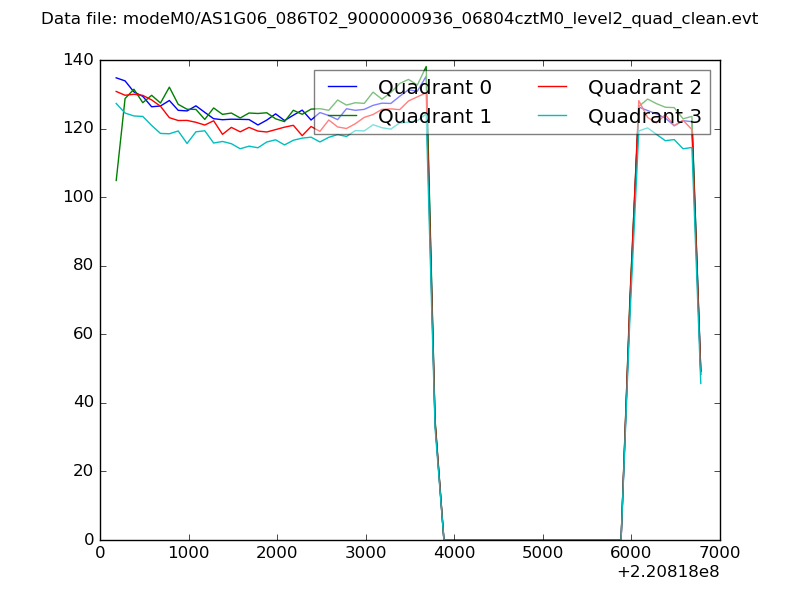 |
|
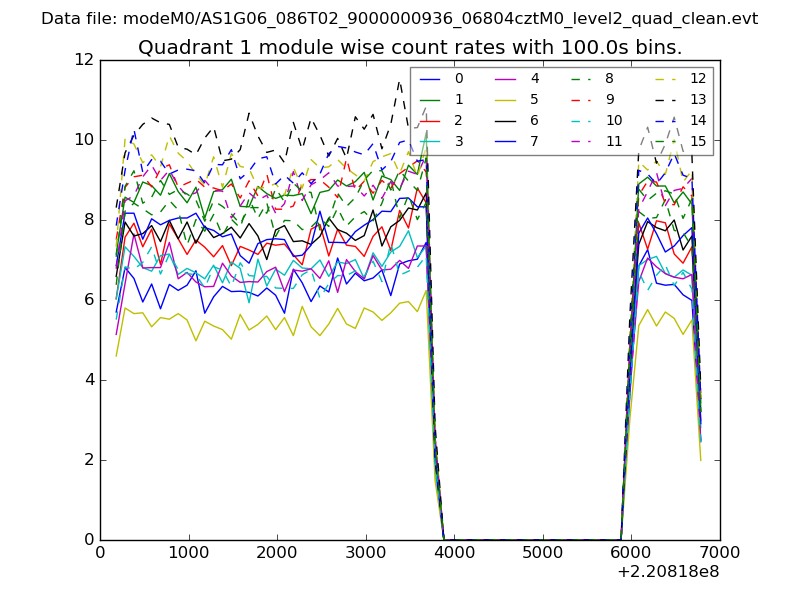
| Module-wise count rates for Quadrant A Data is divided into 100 sec bins |
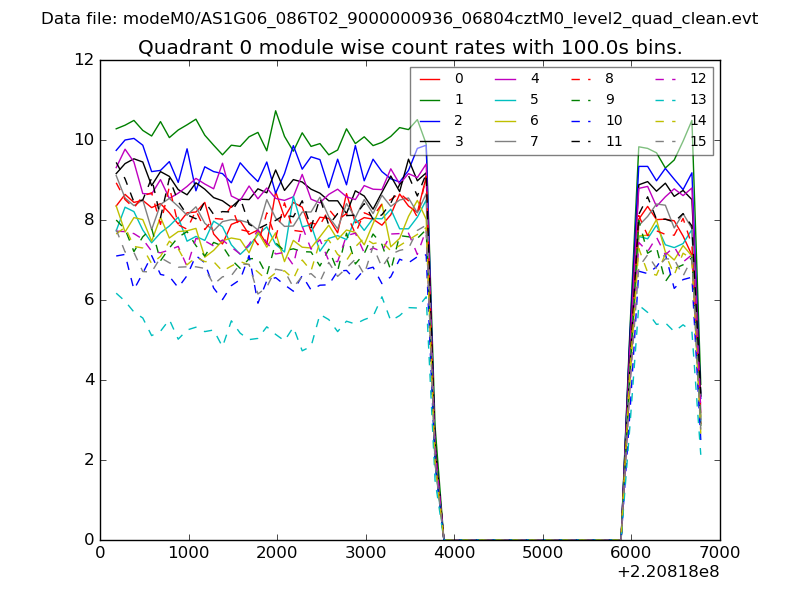 |
 |
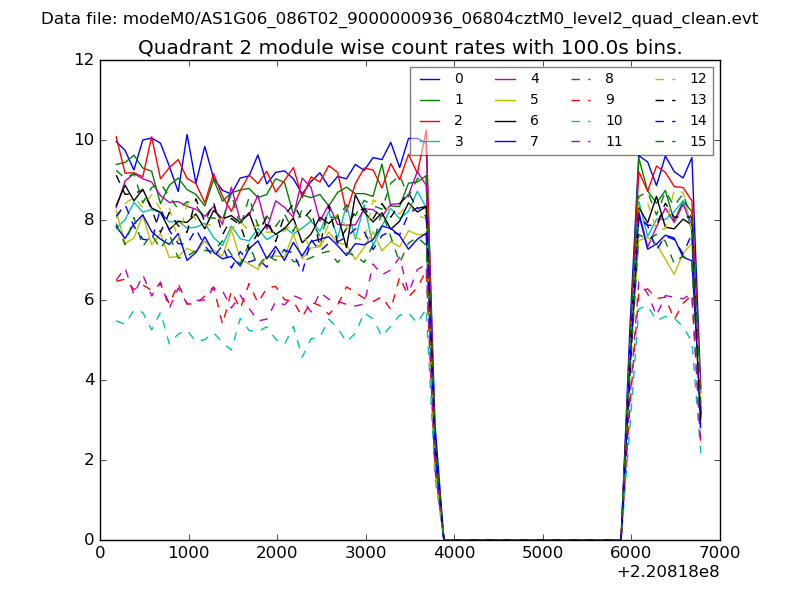
| Module-wise count rates for Quadrant B Data is divided into 100 sec bins |
 |
 |
| Module-wise count rates for Quadrant C Data is divided into 100 sec bins |
 |
 |
| Module-wise count rates for Quadrant D Data is divided into 100 sec bins |
 |
 |
| Parameter | Plot |
|---|---|
| CZT HV Monitor | 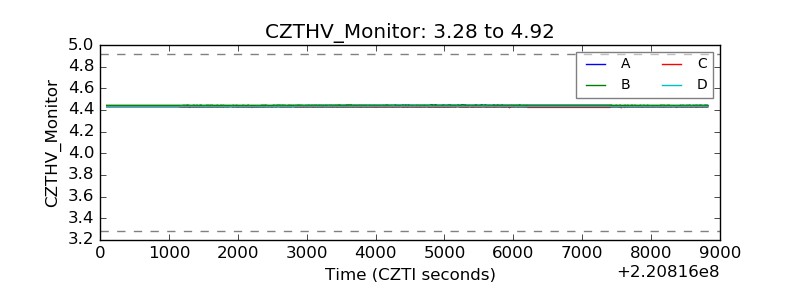 |
| D_VDD | 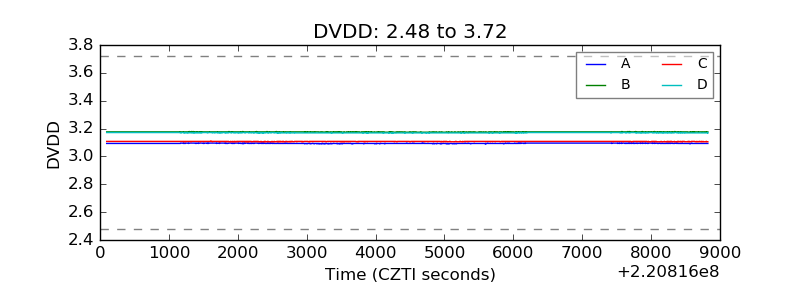 |
| Temperature 1 | 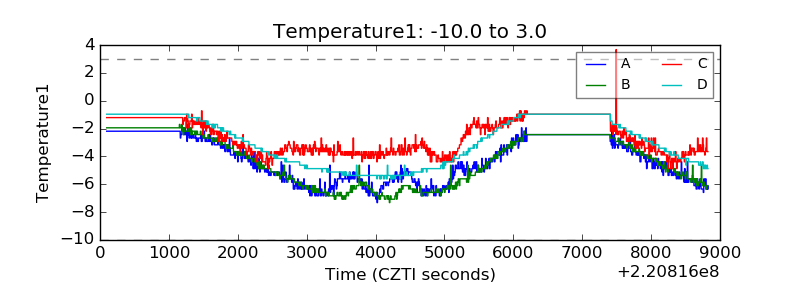 |
| Veto HV Monitor | 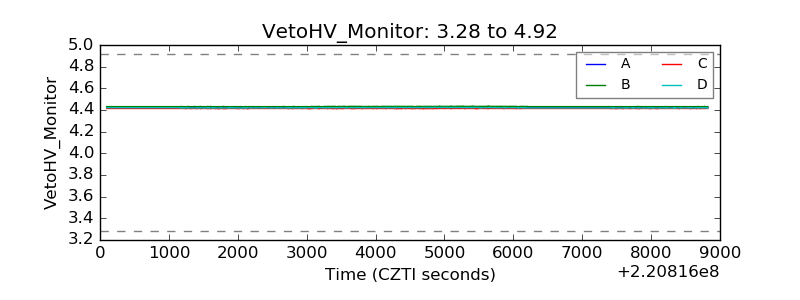 |
| Veto LLD | 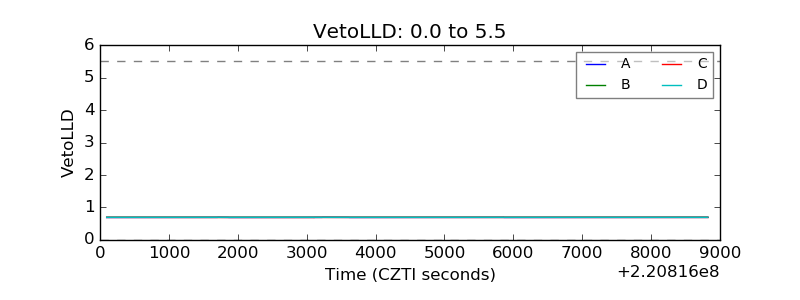 |
| Alpha Counter | 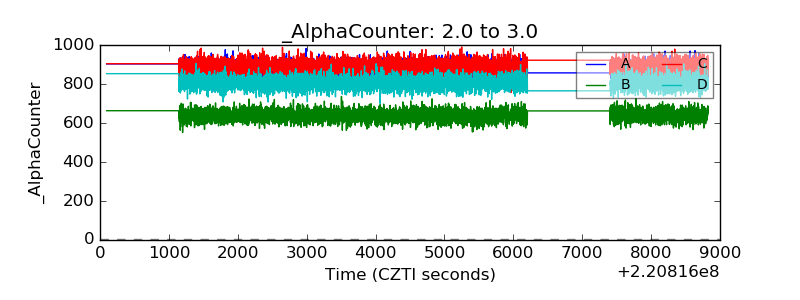 |
| _CPM_Rate | 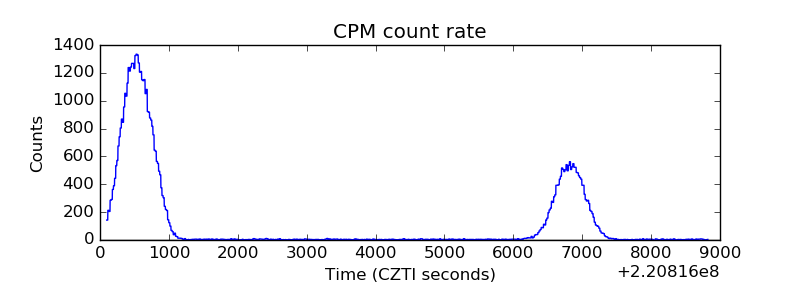 |
| CZT Counter | 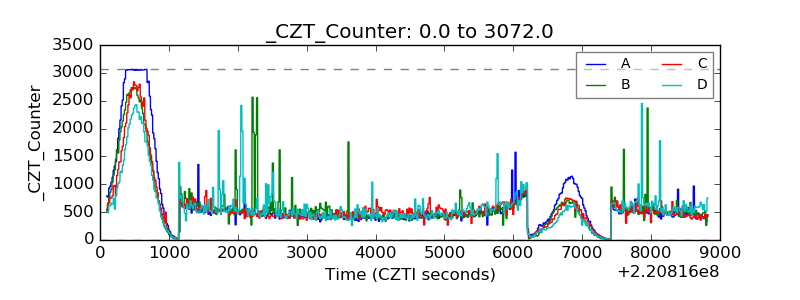 |
| +2.5 Volts monitor |  |
| +5 Volts monitor |  |
| _ROLL_ROT | 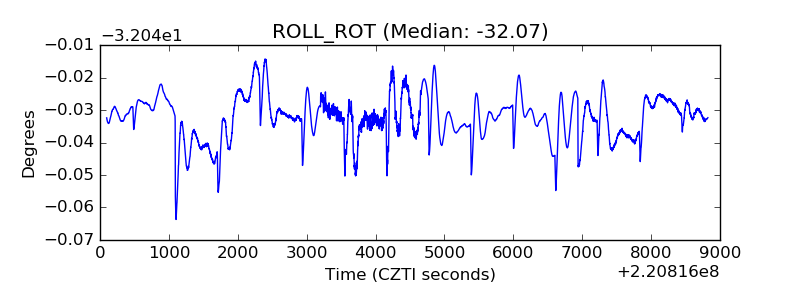 |
| _Roll_DEC | 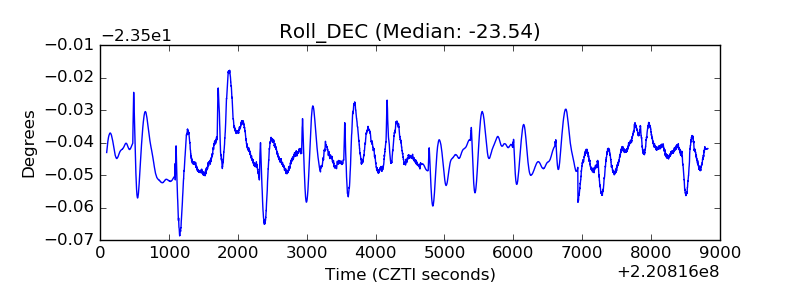 |
| _Roll_RA | 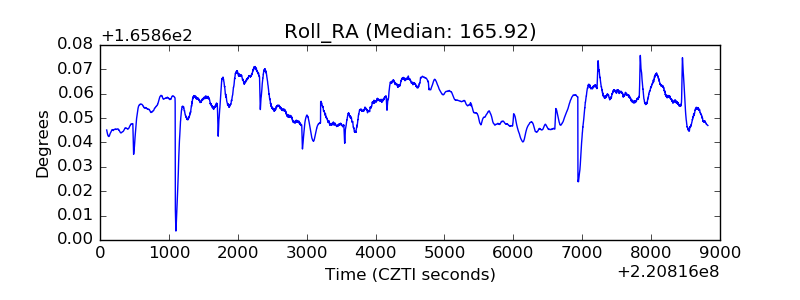 |
| Veto Counter | 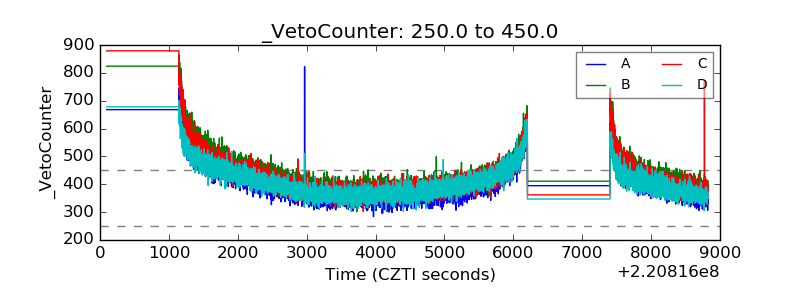 |