| Param | Original file | Final file |
|---|---|---|
| Filename | modeM0/AS1G06_086T02_9000000936_06805cztM0_level2.evt | modeM0/AS1G06_086T02_9000000936_06805cztM0_level2_quad_clean.evt |
| Size (bytes) | 512,573,760 | 92,877,120 |
| Size | 488.8 MB | 88.6 MB |
| Events in quadrant A | 3,676,629 | 582,974 |
| Events in quadrant B | 3,574,186 | 593,398 |
| Events in quadrant C | 3,522,615 | 579,047 |
| Events in quadrant D | 4,257,550 | 552,536 |
| Mode M9 | |||
|---|---|---|---|
| Quadrant | BADHDUFLAG | Total packets | Discarded packets |
| A | 0 | 21 | 0 |
| B | 0 | 21 | 0 |
| C | 0 | 21 | 0 |
| D | 0 | 21 | 0 |
| Mode M0 | |||
|---|---|---|---|
| Quadrant | BADHDUFLAG | Total packets | Discarded packets |
| A | 0 | 15823 | 3 |
| B | 0 | 15403 | 2 |
| C | 0 | 15449 | 2 |
| D | 0 | 17466 | 2 |
| Mode SS | |||
|---|---|---|---|
| Quadrant | BADHDUFLAG | Total packets | Discarded packets |
| A | 0 | 148 | 0 |
| B | 0 | 148 | 0 |
| C | 0 | 148 | 0 |
| D | 0 | 148 | 0 |
| Quadrant | Total seconds | Saturated seconds | Saturation percentage |
|---|---|---|---|
| A | 7252 | 120 | 1.654716% |
| B | 7252 | 95 | 1.309983% |
| C | 7252 | 25 | 0.344732% |
| D | 7252 | 160 | 2.206288% |
Noise dominated data is calculated using 1-second bins in cleaned event files. If a bin has >2000 counts, and if more than 50% of those come from <1% of pixels, then it is considered to be noise-dominated and hence unusable.
| Quadrant | # 1 sec bins | Bins with >0 counts | Bins with >2000 counts | High rate bins dominated by noise | Noise dominated (total time) | Noise dominated (detector-on time) | Marked lightcurve |
|---|---|---|---|---|---|---|---|
| A | 9307 | 7254 | 27 | 27 | 0.29% | 0.37% | 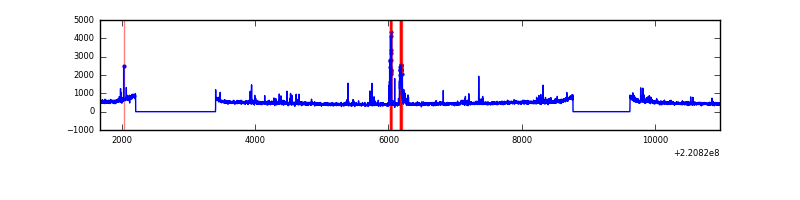 |
| B | 9307 | 7254 | 2 | 2 | 0.02% | 0.03% | 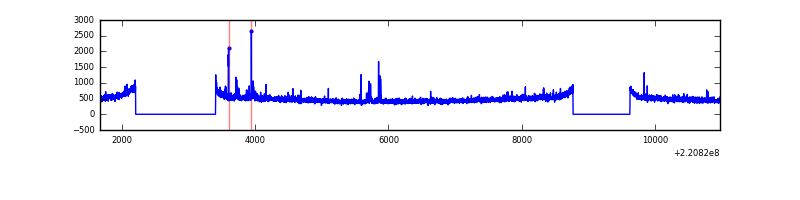 |
| C | 9307 | 7254 | 1 | 1 | 0.01% | 0.01% | 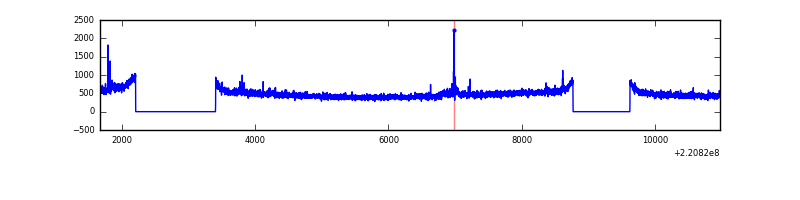 |
| D | 9307 | 7254 | 59 | 59 | 0.63% | 0.81% | 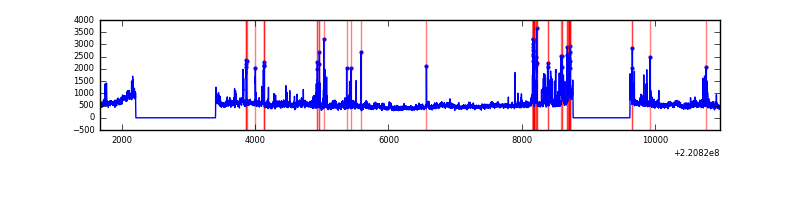 |
Top three noisy pixels from each quadrant. If the there are fewer than three noisy pixels in the level2.evt file, extra rows are filled as -1
| Pixel properties | Quadrant properties | ||||||
|---|---|---|---|---|---|---|---|
| Quadrant | DetID | PixID | Counts | Sigma | Mean | Median | Sigma |
| A | 13 | 251 | 114450 | 628.9 | 883 | 863 | 180.6 |
| A | 8 | 15 | 107209 | 588.81 | 883 | 863 | 180.6 |
| A | 13 | 248 | 43156 | 234.17 | 883 | 863 | 180.6 |
| B | 4 | 81 | 36596 | 207.86 | 893 | 872 | 171.9 |
| B | 0 | 228 | 30596 | 172.95 | 893 | 872 | 171.9 |
| B | 12 | 111 | 17107 | 94.47 | 893 | 872 | 171.9 |
| C | 9 | 247 | 147779 | 735.0 | 857 | 860 | 199.9 |
| C | 12 | 16 | 28517 | 138.36 | 857 | 860 | 199.9 |
| C | 13 | 61 | 6751 | 29.47 | 857 | 860 | 199.9 |
| D | 8 | 195 | 509576 | 2445.61 | 844 | 817 | 208.0 |
| D | 2 | 216 | 249067 | 1193.34 | 844 | 817 | 208.0 |
| D | 14 | 34 | 139612 | 667.19 | 844 | 817 | 208.0 |
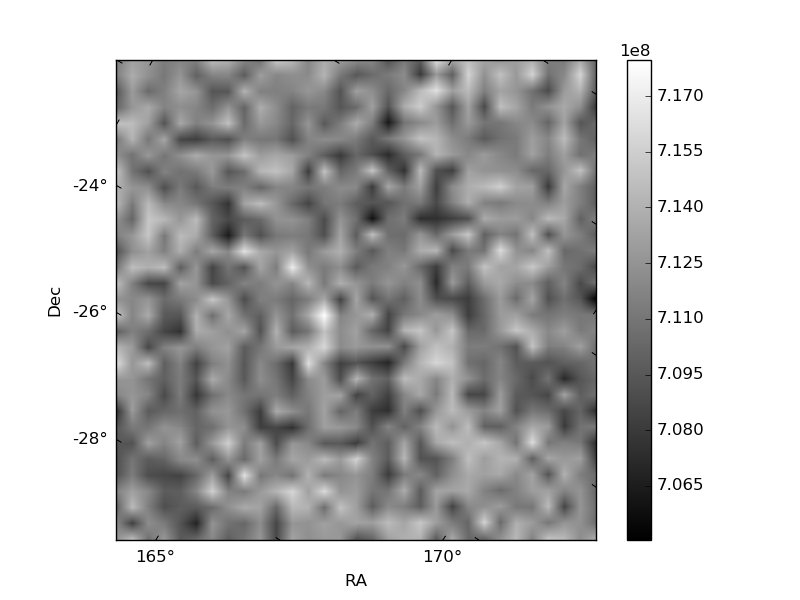
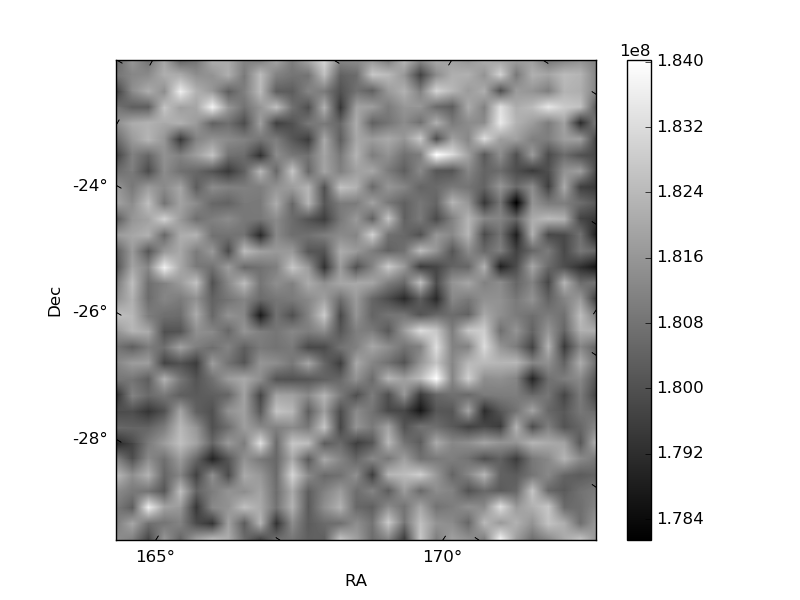
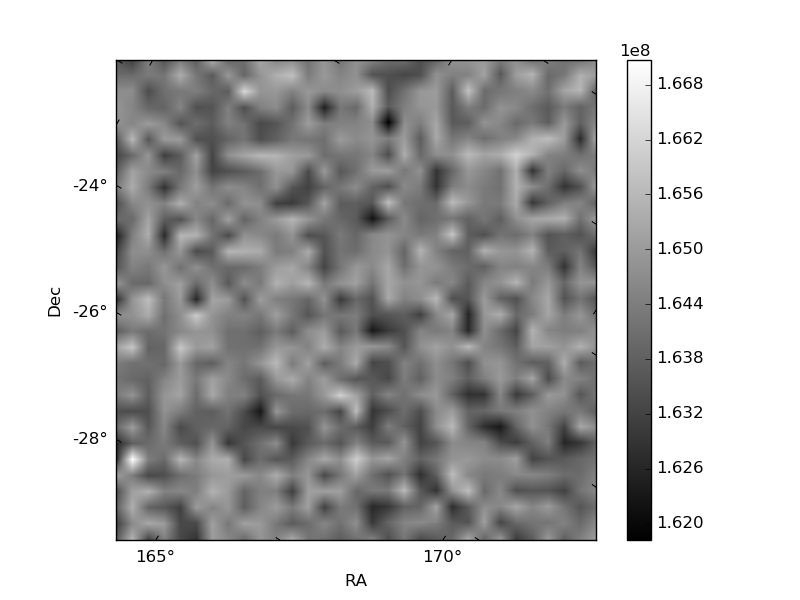
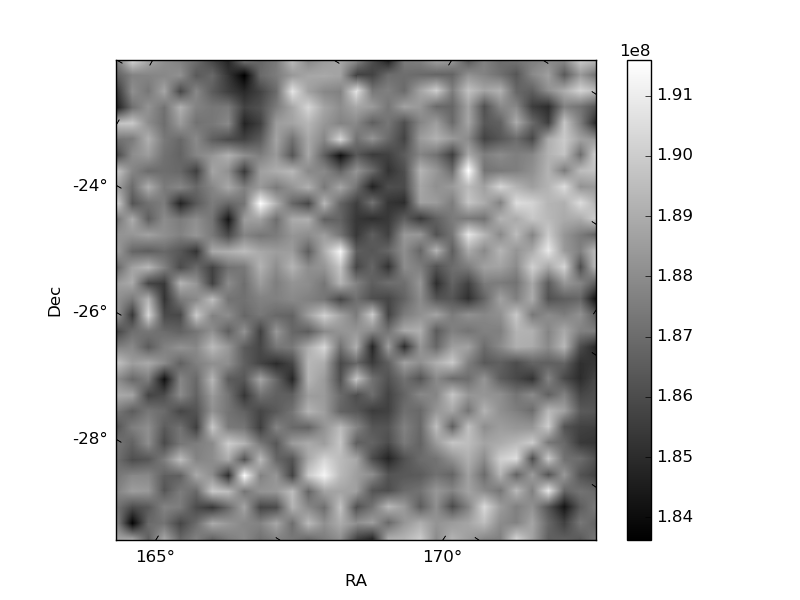
Histogram calculated using DETX and DETY for each event in the final _common_clean file
| Quadrant A | 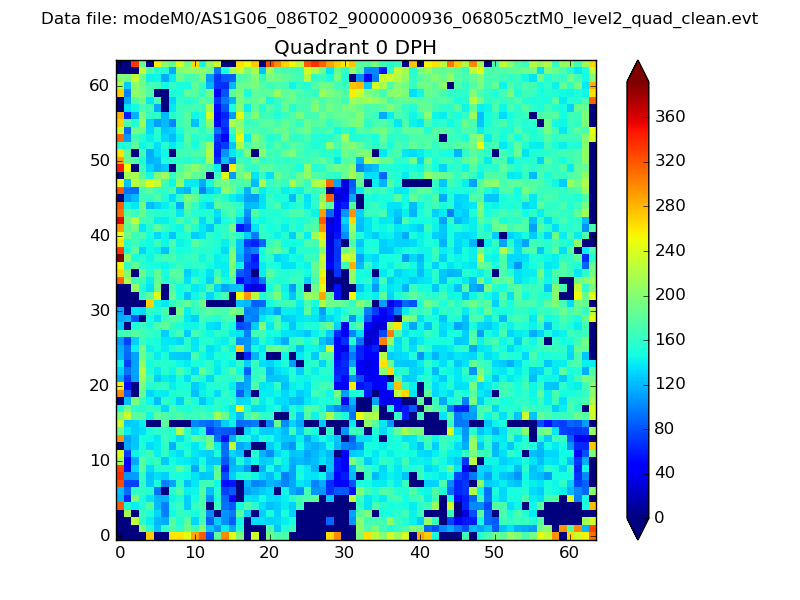 |
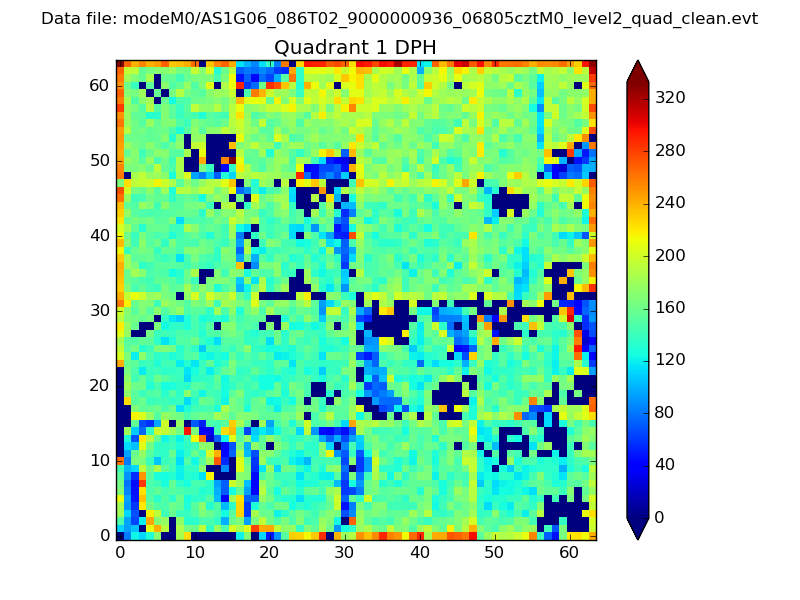 |
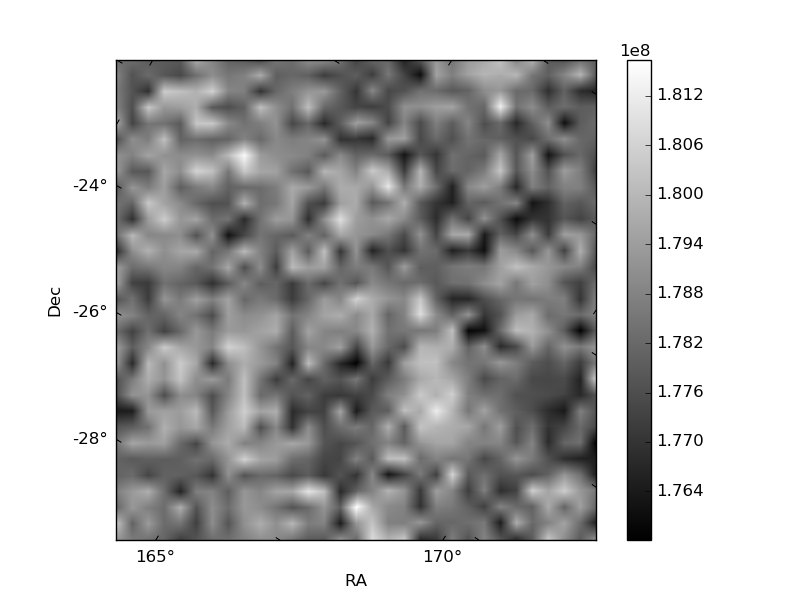
Quadrant B |
|---|---|---|---|
| Quadrant D | 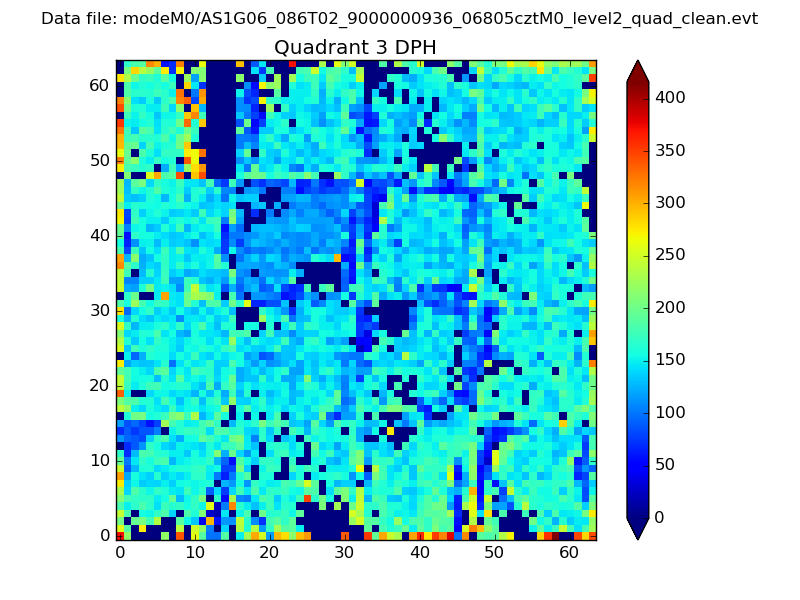 |
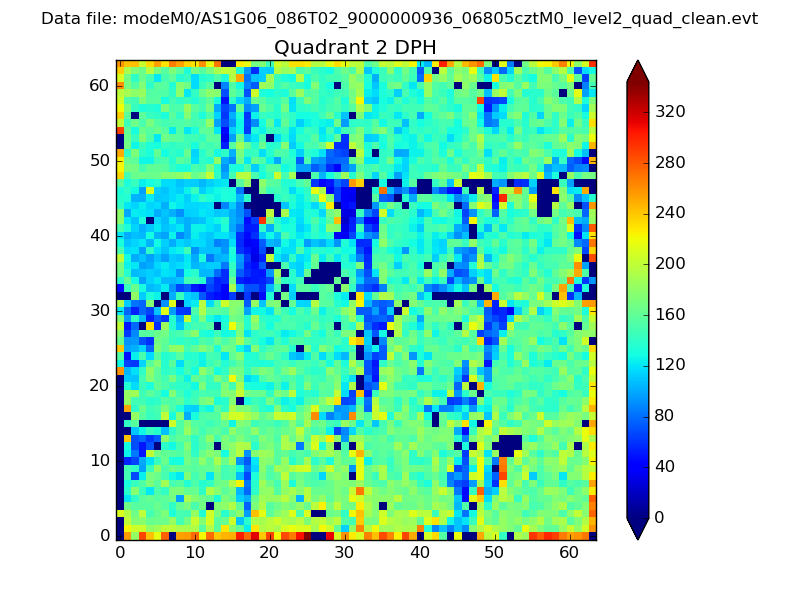 |
Quadrant C |
| Plot type | Count rate plots | Images |
|---|---|---|
| Comparison with Poisson distribution Blue bars denote a histogram of data divided into 1 sec bins. Red curve is a Poisson curve with rate = median count rate of data. |
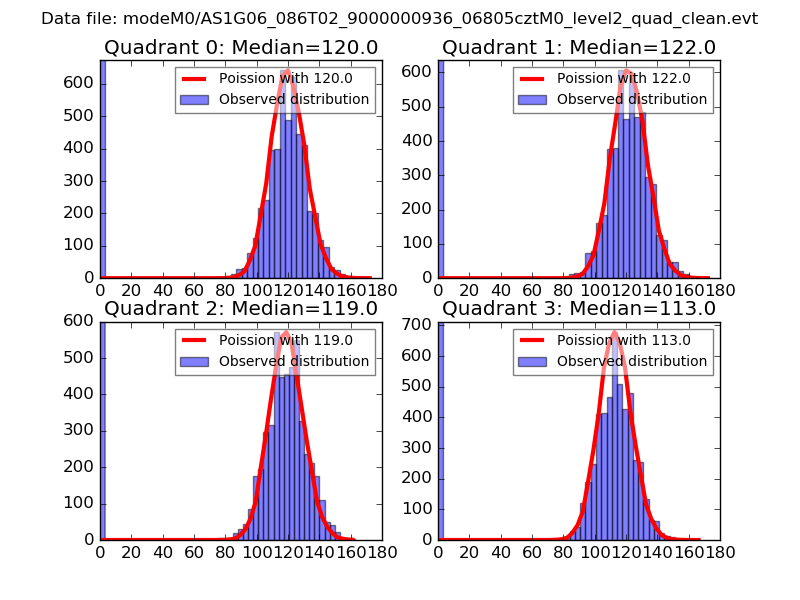 |
 |
| Quadrant-wise count rates Data is divided into 100 sec bins |
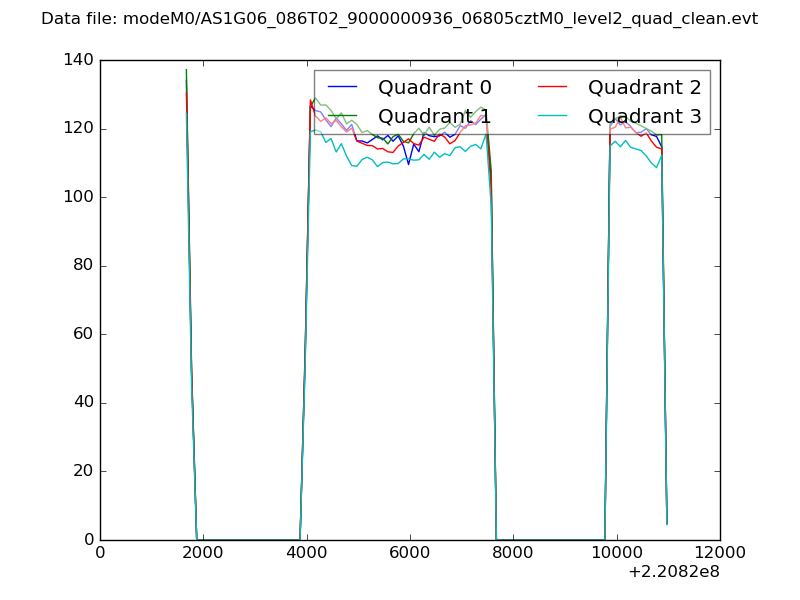 |
|
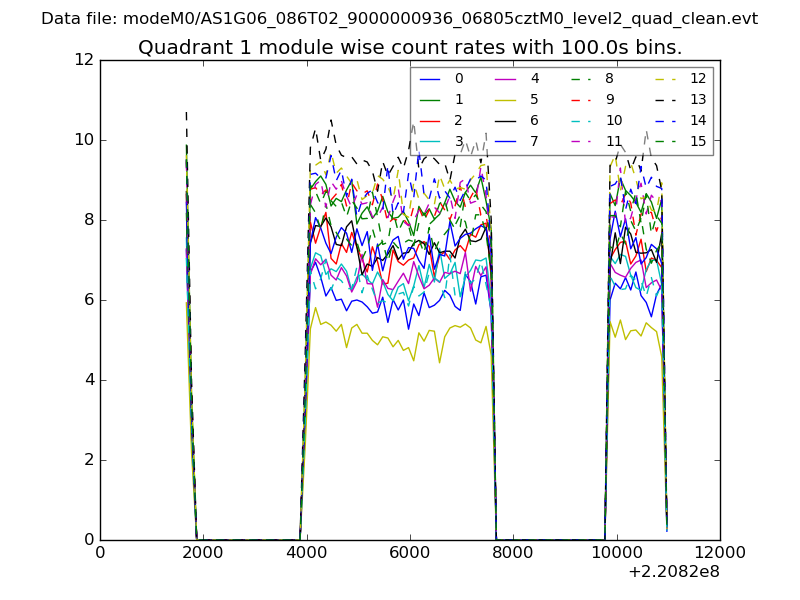
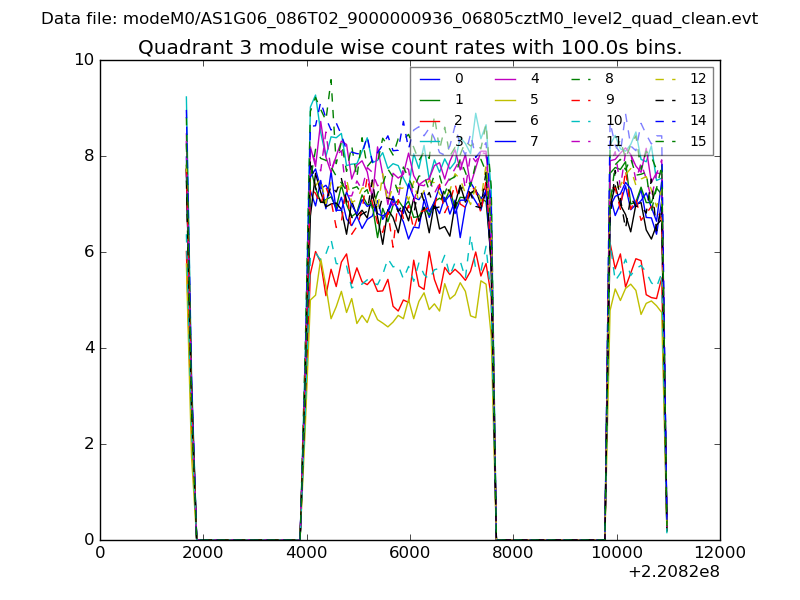
| Module-wise count rates for Quadrant A Data is divided into 100 sec bins |
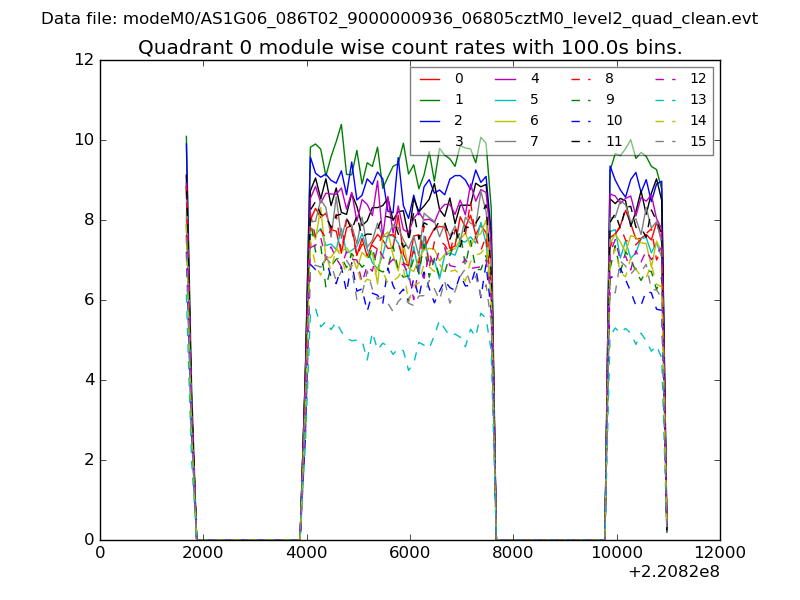 |
 |
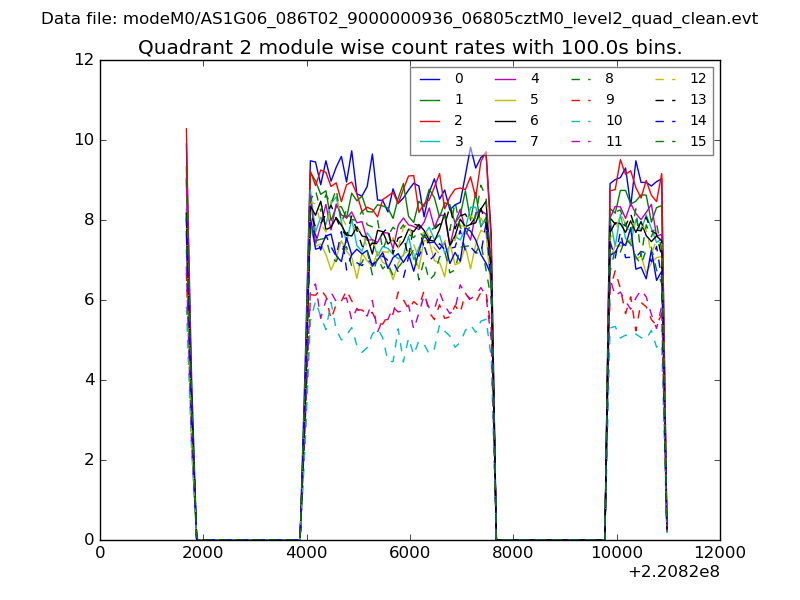
| Module-wise count rates for Quadrant B Data is divided into 100 sec bins |
 |
 |
| Module-wise count rates for Quadrant C Data is divided into 100 sec bins |
 |
 |
| Module-wise count rates for Quadrant D Data is divided into 100 sec bins |
 |
 |
| Parameter | Plot |
|---|---|
| CZT HV Monitor | 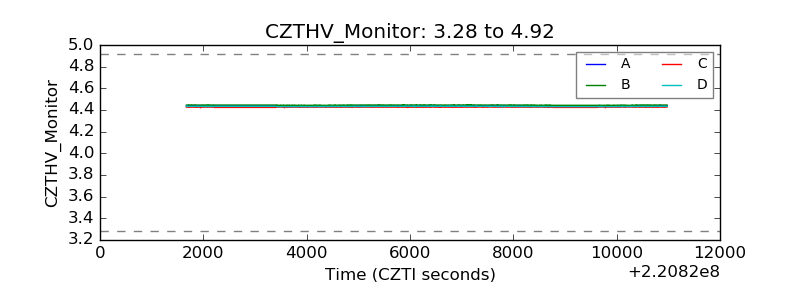 |
| D_VDD | 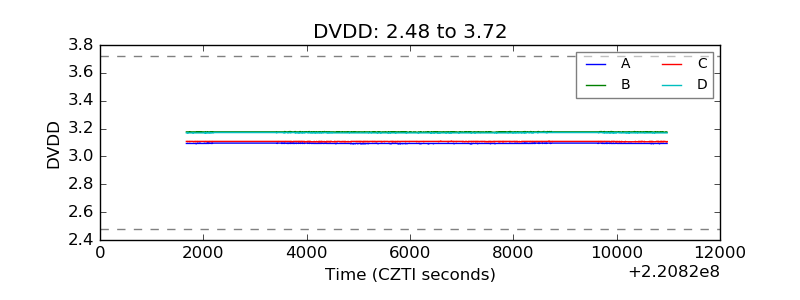 |
| Temperature 1 | 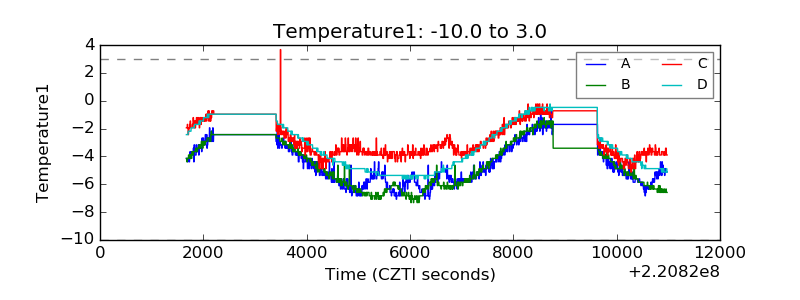 |
| Veto HV Monitor | 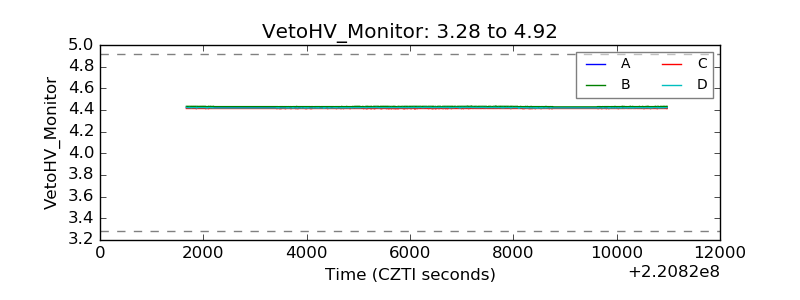 |
| Veto LLD | 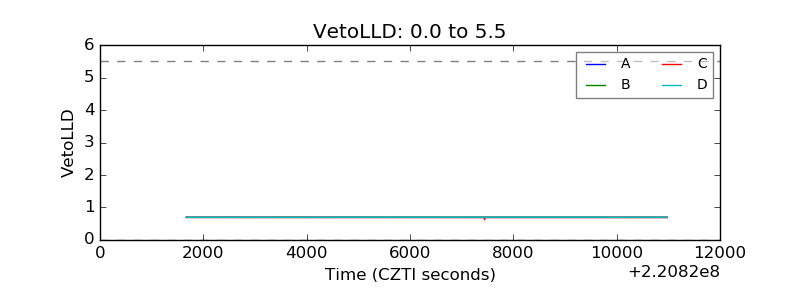 |
| Alpha Counter | 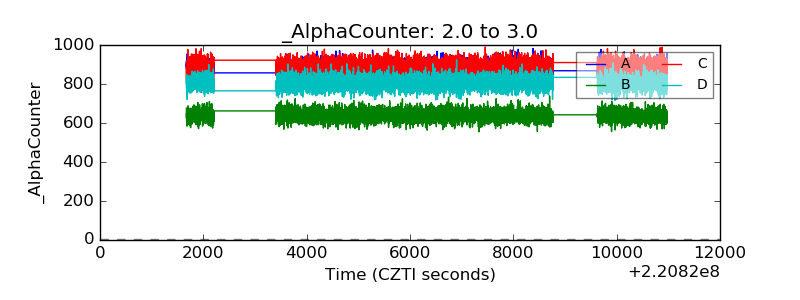 |
| _CPM_Rate | 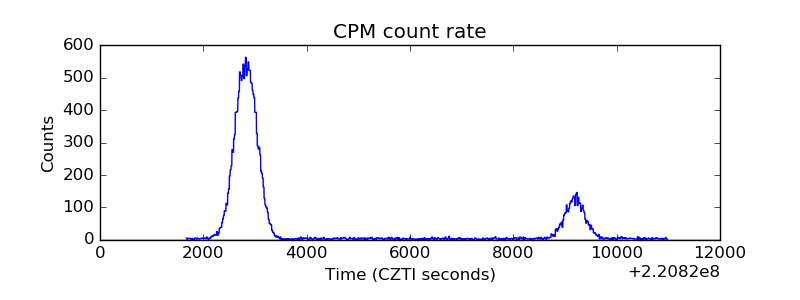 |
| CZT Counter | 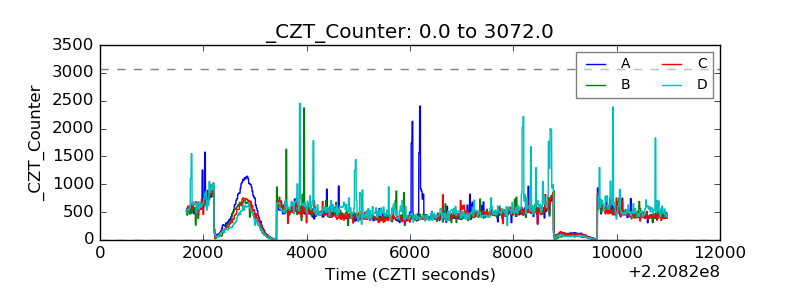 |
| +2.5 Volts monitor | 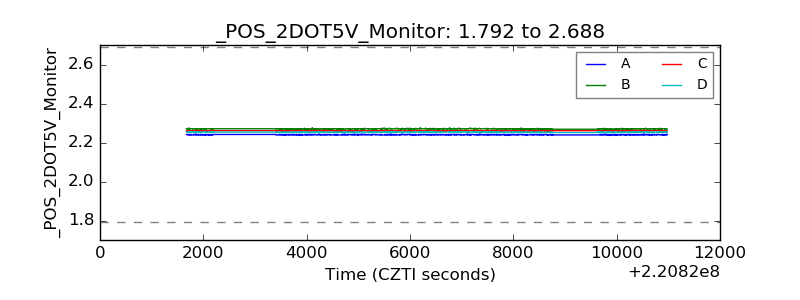 |
| +5 Volts monitor |  |
| _ROLL_ROT | 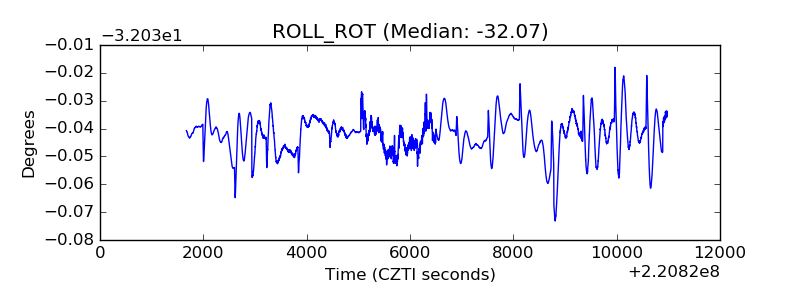 |
| _Roll_DEC | 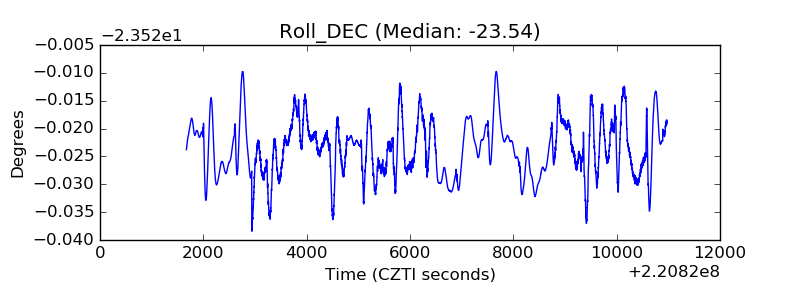 |
| _Roll_RA | 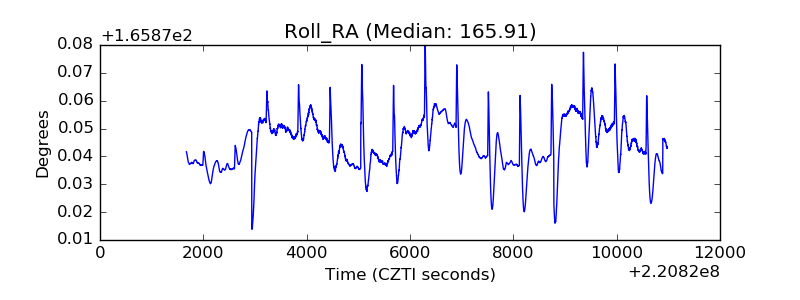 |
| Veto Counter | 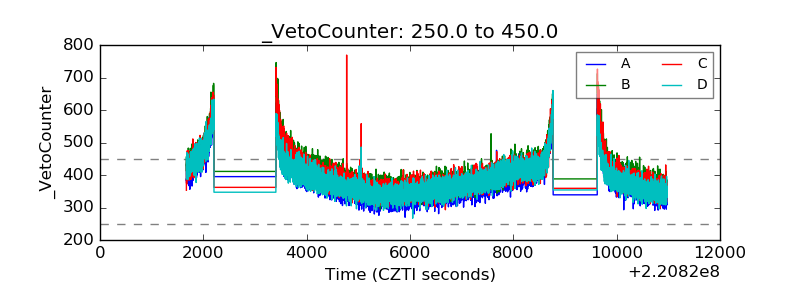 |