| Param | Original file | Final file |
|---|---|---|
| Filename | modeM0/AS1G06_086T02_9000000936_06808cztM0_level2.evt | modeM0/AS1G06_086T02_9000000936_06808cztM0_level2_quad_clean.evt |
| Size (bytes) | 255,363,840 | 56,856,960 |
| Size | 243.5 MB | 54.2 MB |
| Events in quadrant A | 1,817,154 | 364,316 |
| Events in quadrant B | 1,768,308 | 373,624 |
| Events in quadrant C | 1,740,465 | 365,240 |
| Events in quadrant D | 2,144,607 | 346,409 |
| Mode M9 | |||
|---|---|---|---|
| Quadrant | BADHDUFLAG | Total packets | Discarded packets |
| A | 0 | 1 | 0 |
| B | 0 | 1 | 0 |
| C | 0 | 1 | 0 |
| D | 0 | 1 | 0 |
| Mode M0 | |||
|---|---|---|---|
| Quadrant | BADHDUFLAG | Total packets | Discarded packets |
| A | 0 | 8214 | 2 |
| B | 0 | 8073 | 1 |
| C | 0 | 7994 | 1 |
| D | 0 | 9023 | 1 |
| Mode SS | |||
|---|---|---|---|
| Quadrant | BADHDUFLAG | Total packets | Discarded packets |
| A | 0 | 78 | 0 |
| B | 0 | 78 | 0 |
| C | 0 | 78 | 0 |
| D | 0 | 78 | 0 |
| Quadrant | Total seconds | Saturated seconds | Saturation percentage |
|---|---|---|---|
| A | 3851 | 37 | 0.960789% |
| B | 3851 | 47 | 1.220462% |
| C | 3851 | 23 | 0.597247% |
| D | 3851 | 68 | 1.765775% |
Noise dominated data is calculated using 1-second bins in cleaned event files. If a bin has >2000 counts, and if more than 50% of those come from <1% of pixels, then it is considered to be noise-dominated and hence unusable.
| Quadrant | # 1 sec bins | Bins with >0 counts | Bins with >2000 counts | High rate bins dominated by noise | Noise dominated (total time) | Noise dominated (detector-on time) | Marked lightcurve |
|---|---|---|---|---|---|---|---|
| A | 3946 | 3853 | 0 | 0 | 0.00% | 0.00% | 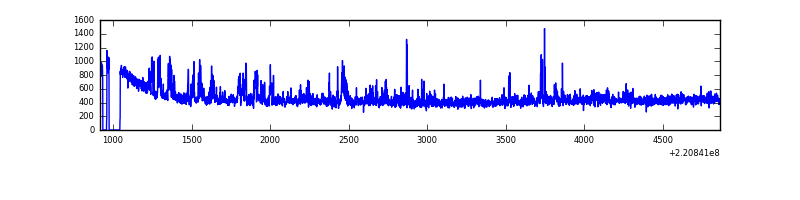 |
| B | 3946 | 3853 | 0 | 0 | 0.00% | 0.00% | 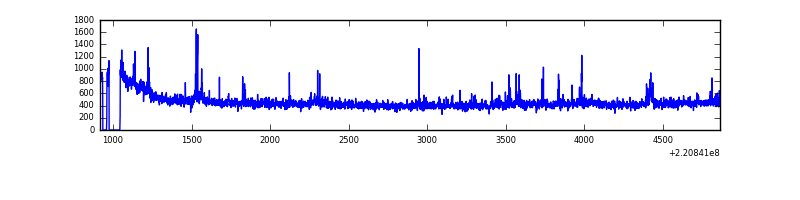 |
| C | 3946 | 3853 | 2 | 2 | 0.05% | 0.05% | 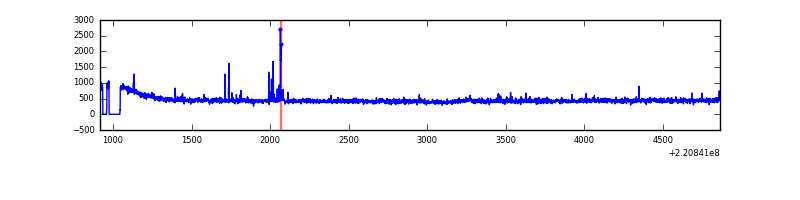 |
| D | 3946 | 3853 | 58 | 58 | 1.47% | 1.51% | 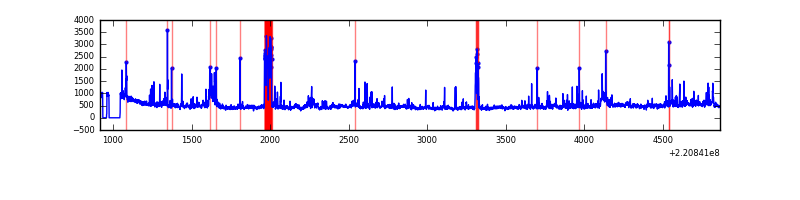 |
Top three noisy pixels from each quadrant. If the there are fewer than three noisy pixels in the level2.evt file, extra rows are filled as -1
| Pixel properties | Quadrant properties | ||||||
|---|---|---|---|---|---|---|---|
| Quadrant | DetID | PixID | Counts | Sigma | Mean | Median | Sigma |
| A | 8 | 15 | 160472 | 1803.34 | 429 | 419 | 88.8 |
| A | 0 | 226 | 4116 | 41.65 | 429 | 419 | 88.8 |
| A | 12 | 194 | 3926 | 39.51 | 429 | 419 | 88.8 |
| B | 4 | 81 | 43066 | 496.83 | 435 | 425 | 85.8 |
| B | 0 | 228 | 11527 | 129.35 | 435 | 425 | 85.8 |
| B | 4 | 48 | 11171 | 125.21 | 435 | 425 | 85.8 |
| C | 9 | 247 | 47579 | 468.2 | 424 | 425 | 100.7 |
| C | 12 | 4 | 25332 | 247.3 | 424 | 425 | 100.7 |
| C | 12 | 16 | 10707 | 102.09 | 424 | 425 | 100.7 |
| D | 2 | 216 | 188178 | 1816.31 | 416 | 402 | 103.4 |
| D | 14 | 34 | 180884 | 1745.76 | 416 | 402 | 103.4 |
| D | 8 | 195 | 162092 | 1563.99 | 416 | 402 | 103.4 |
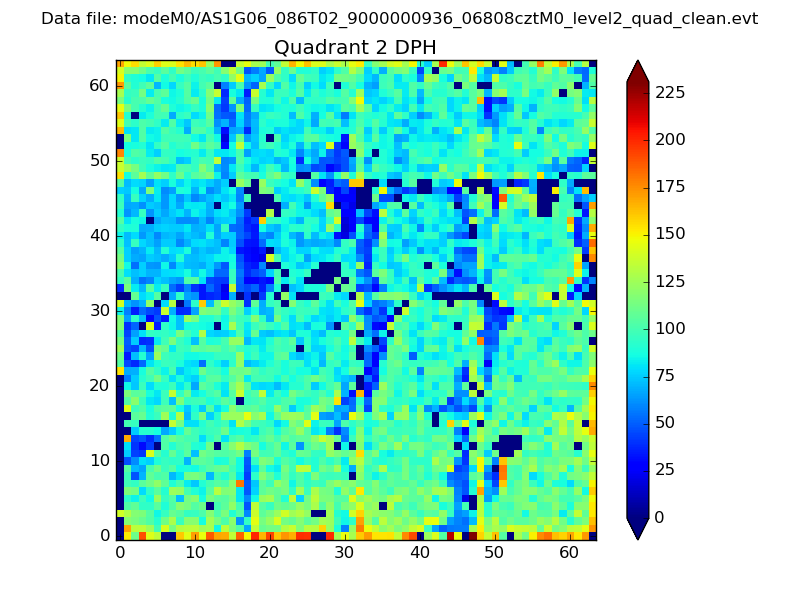
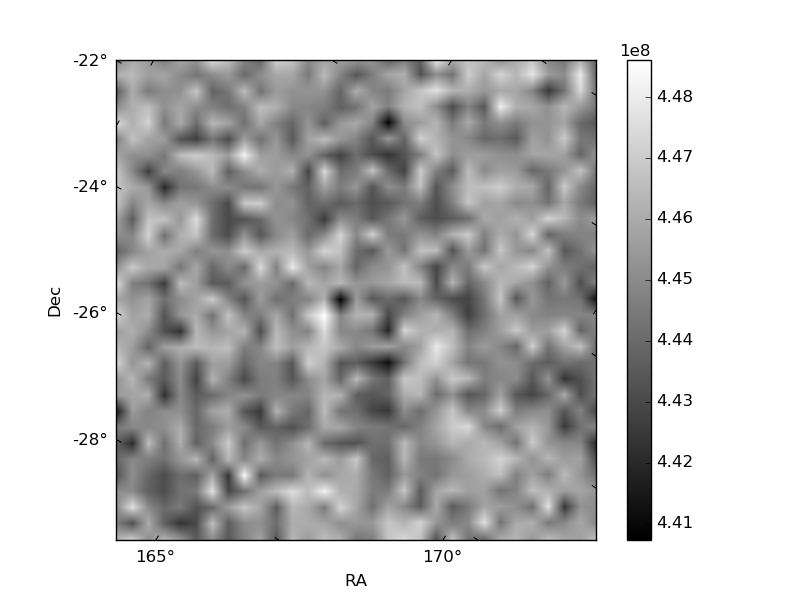
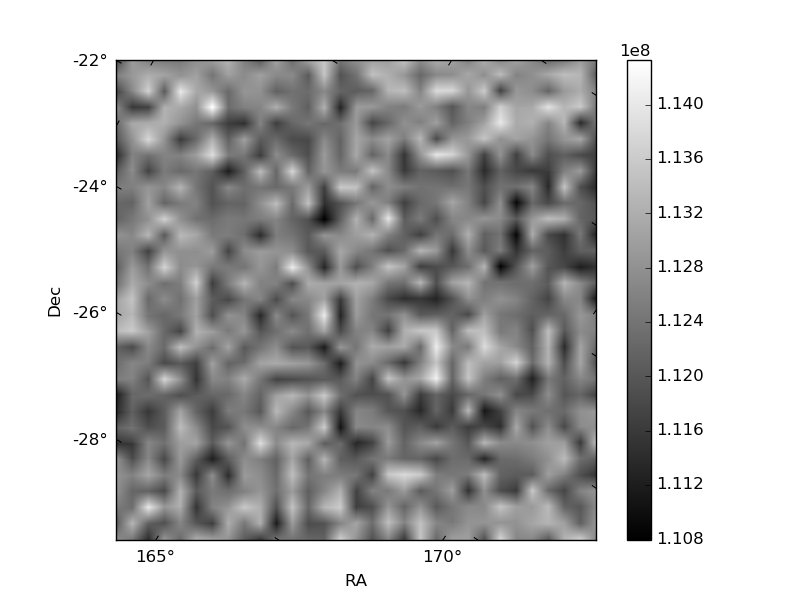
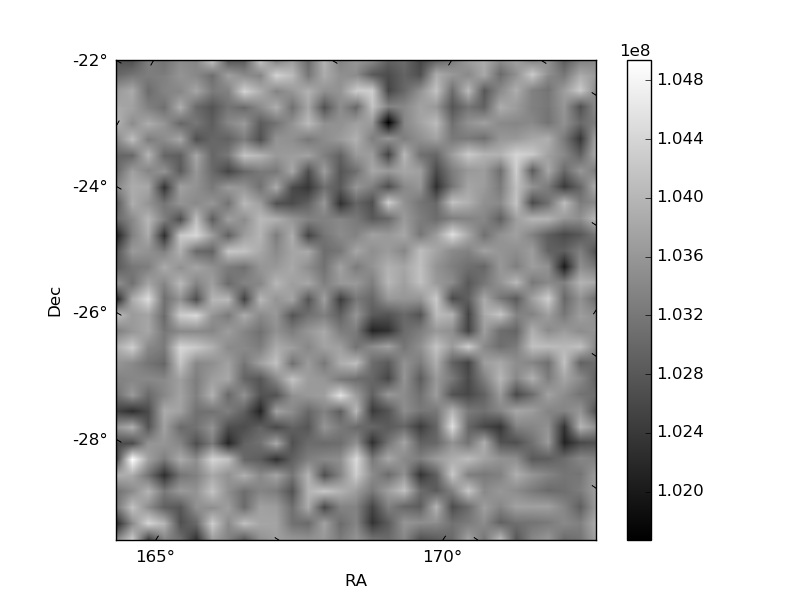
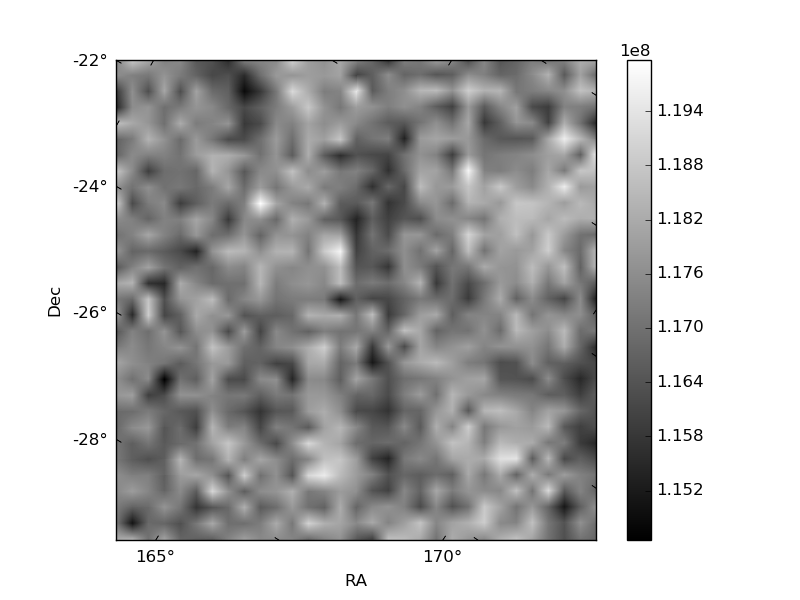
Histogram calculated using DETX and DETY for each event in the final _common_clean file
| Quadrant A | 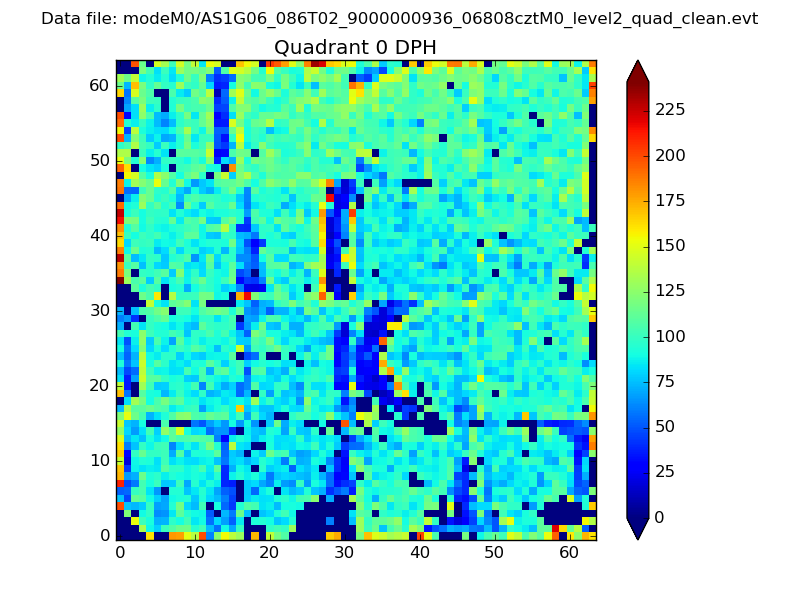 |
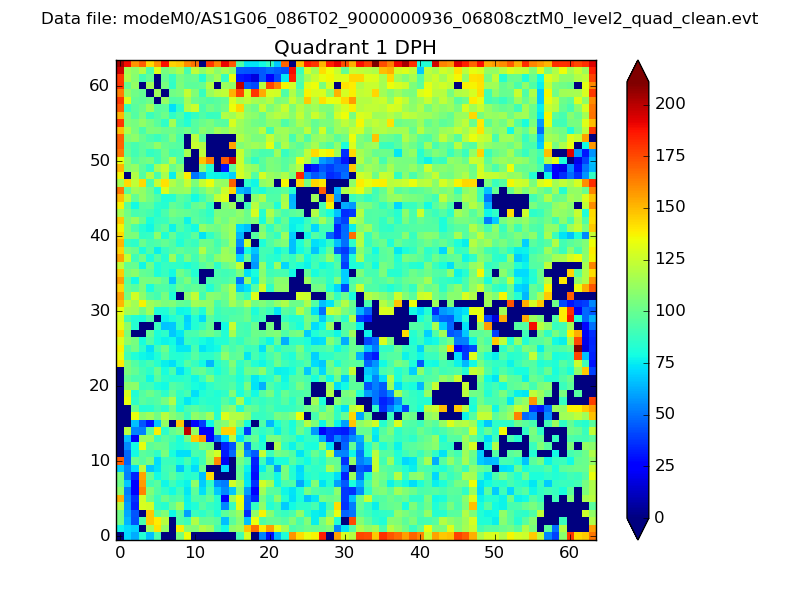 |
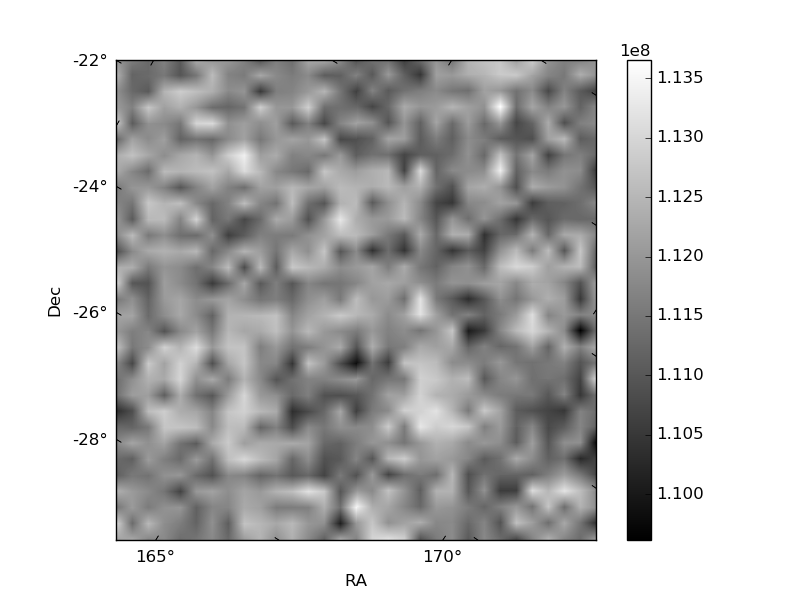
Quadrant B |
|---|---|---|---|
| Quadrant D | 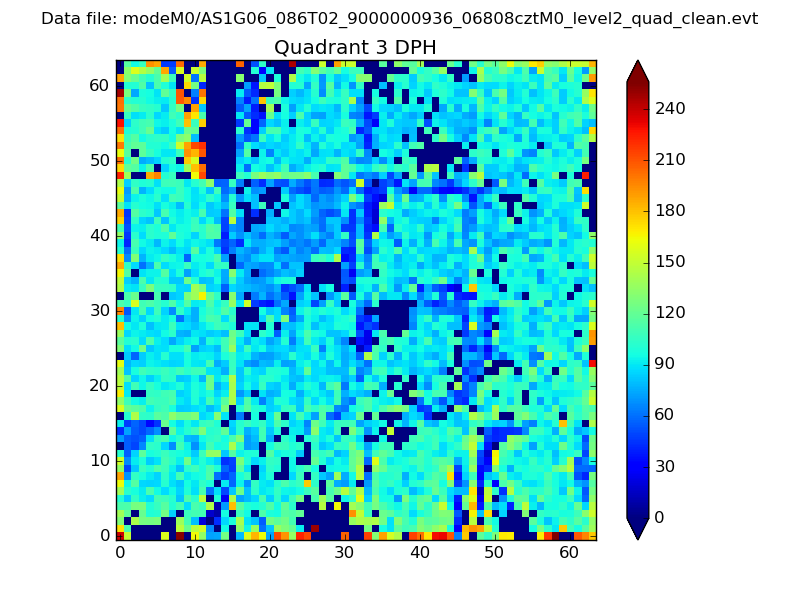 |
 |
Quadrant C |
| Plot type | Count rate plots | Images |
|---|---|---|
| Comparison with Poisson distribution Blue bars denote a histogram of data divided into 1 sec bins. Red curve is a Poisson curve with rate = median count rate of data. |
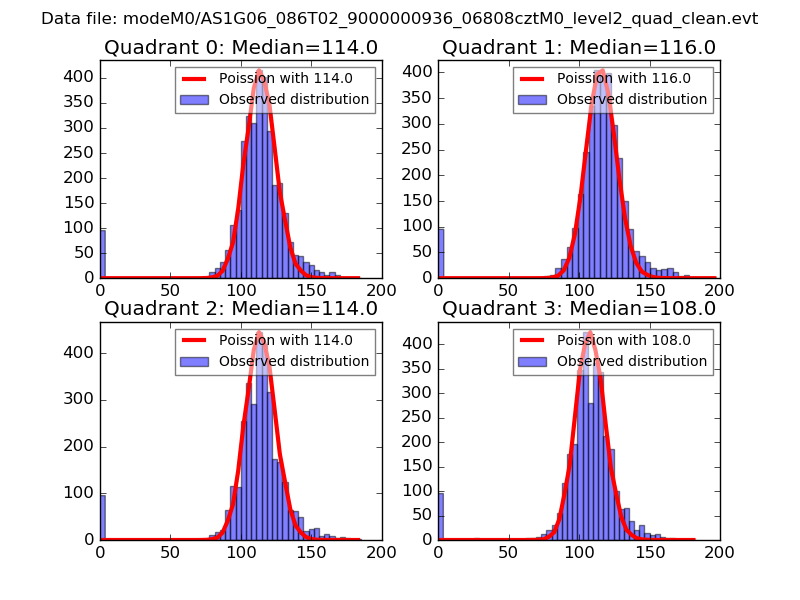 |
 |
| Quadrant-wise count rates Data is divided into 100 sec bins |
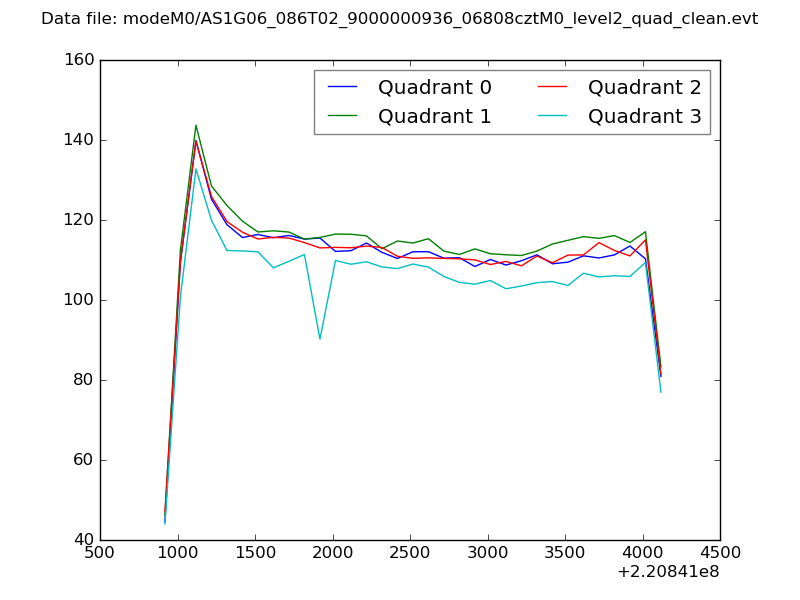 |
|
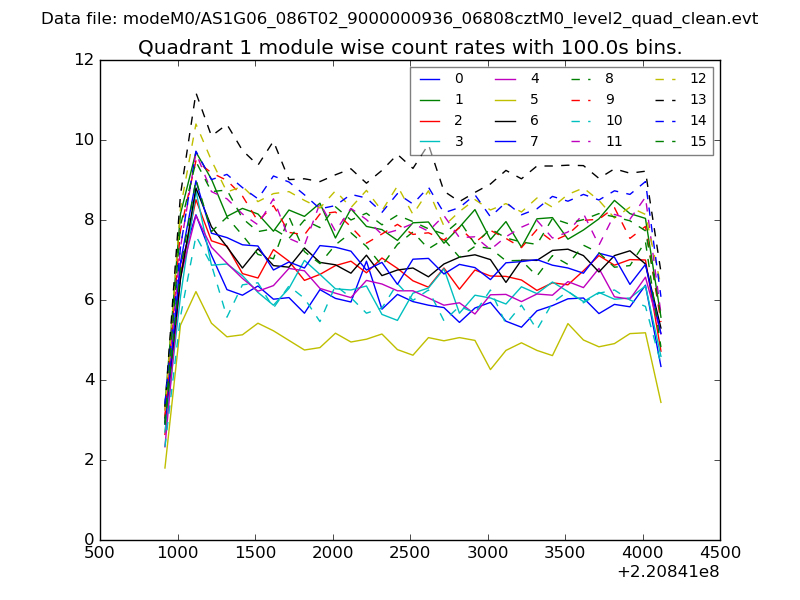
| Module-wise count rates for Quadrant A Data is divided into 100 sec bins |
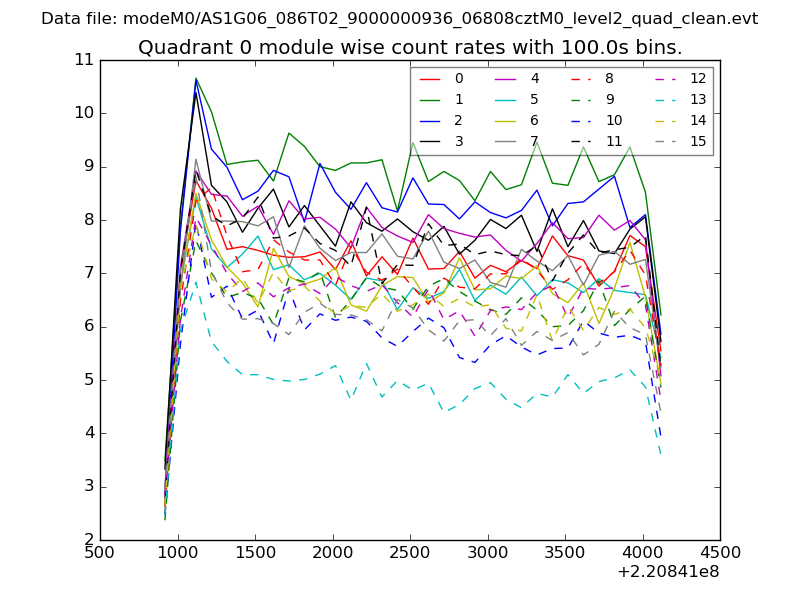 |
 |
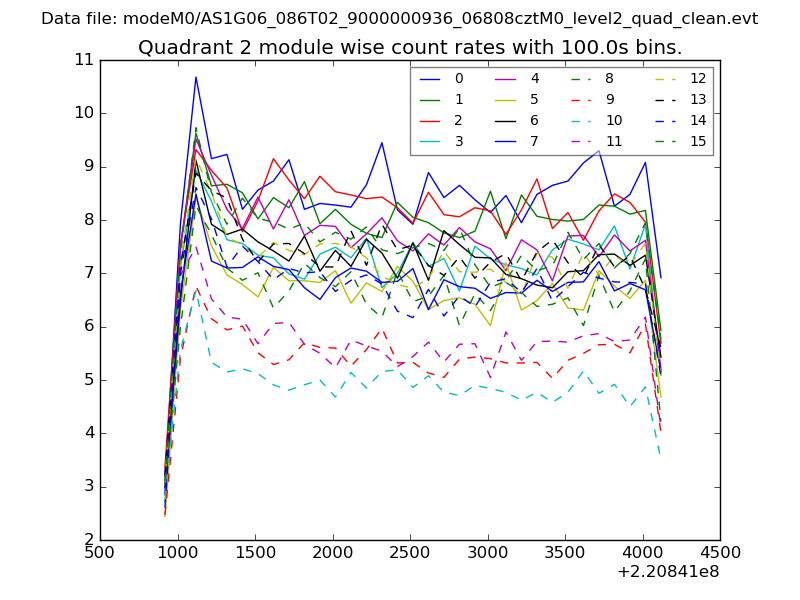
| Module-wise count rates for Quadrant B Data is divided into 100 sec bins |
 |
 |
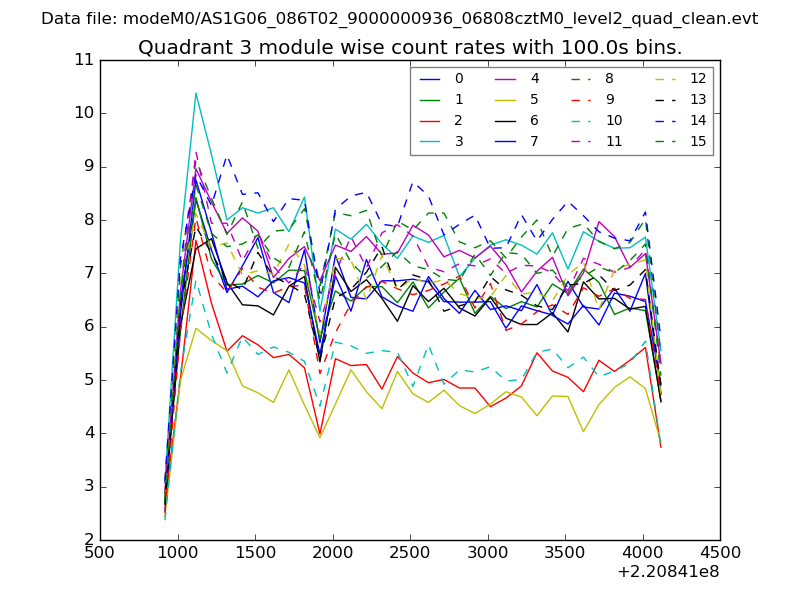
| Module-wise count rates for Quadrant C Data is divided into 100 sec bins |
 |
 |
| Module-wise count rates for Quadrant D Data is divided into 100 sec bins |
 |
 |
| Parameter | Plot |
|---|---|
| CZT HV Monitor | 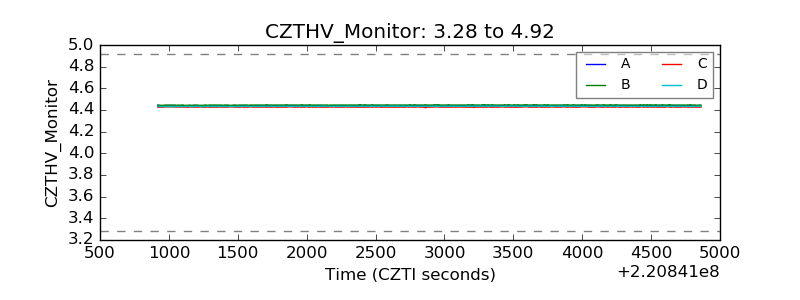 |
| D_VDD | 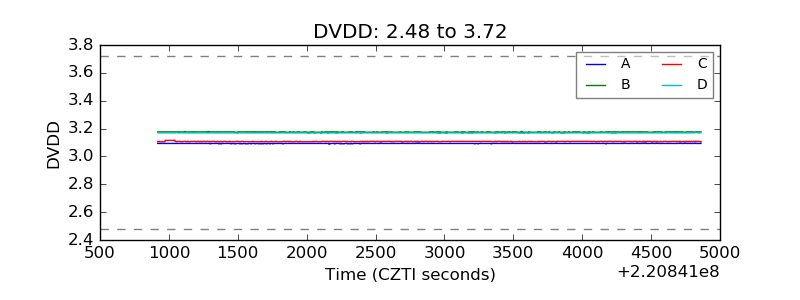 |
| Temperature 1 |  |
| Veto HV Monitor |  |
| Veto LLD | 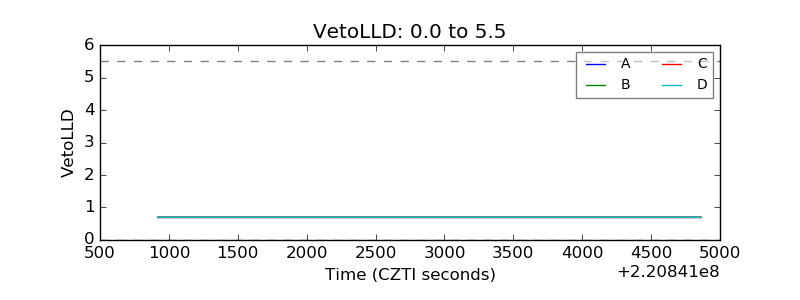 |
| Alpha Counter | 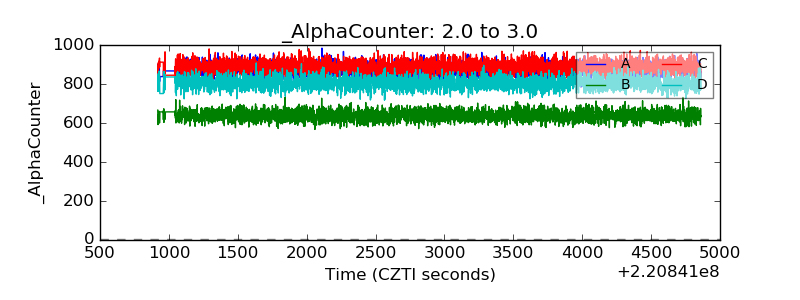 |
| _CPM_Rate | 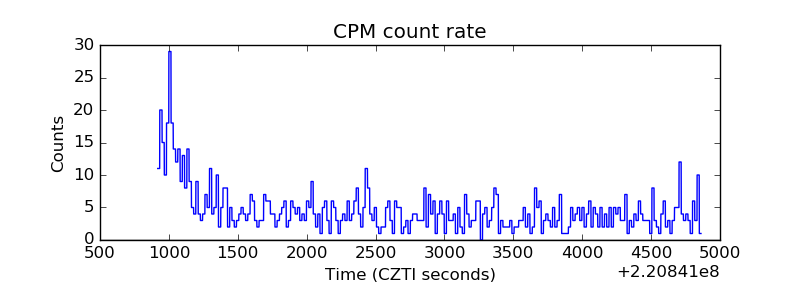 |
| CZT Counter | 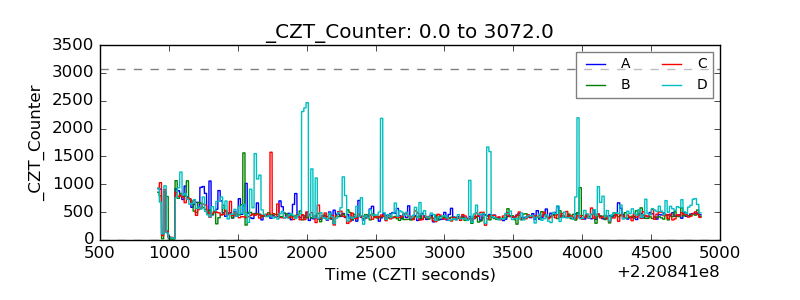 |
| +2.5 Volts monitor |  |
| +5 Volts monitor | 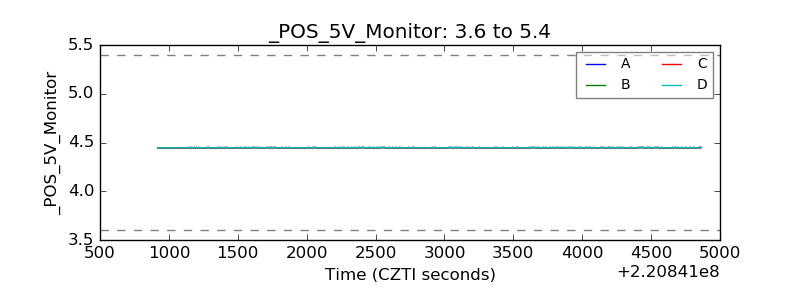 |
| _ROLL_ROT | 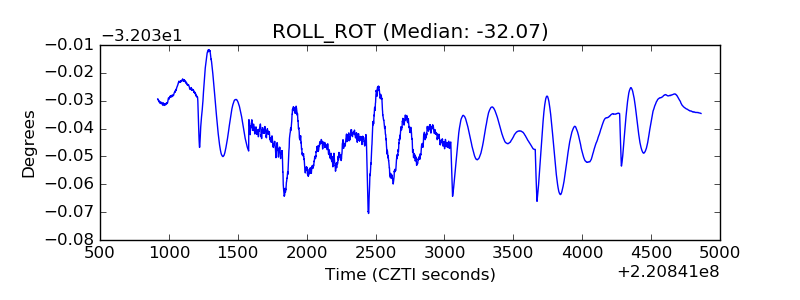 |
| _Roll_DEC | 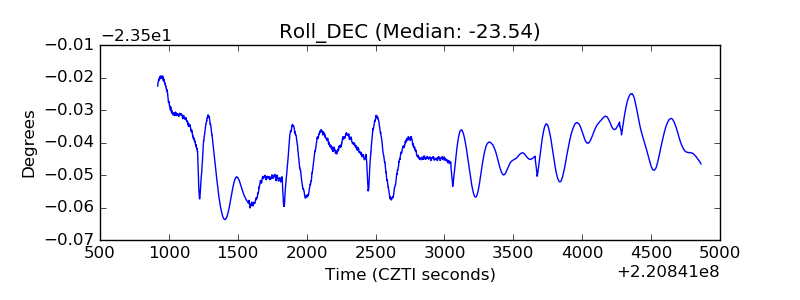 |
| _Roll_RA | 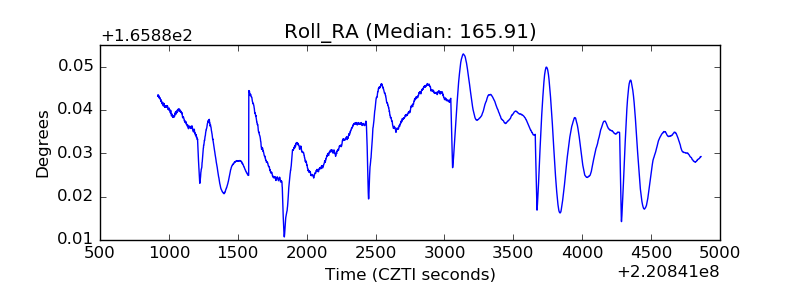 |
| Veto Counter | 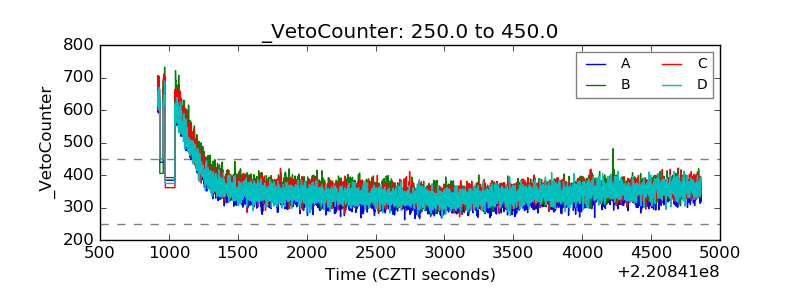 |