| Param | Original file | Final file |
|---|---|---|
| Filename | modeM0/AS1G06_086T02_9000000936_06812cztM0_level2.evt | modeM0/AS1G06_086T02_9000000936_06812cztM0_level2_quad_clean.evt |
| Size (bytes) | 1,245,268,800 | 214,439,040 |
| Size | 1.2 GB | 204.5 MB |
| Events in quadrant A | 8,707,779 | 1,315,839 |
| Events in quadrant B | 9,593,543 | 1,343,140 |
| Events in quadrant C | 8,520,140 | 1,319,000 |
| Events in quadrant D | 9,658,149 | 1,259,698 |
| Mode M9 | |||
|---|---|---|---|
| Quadrant | BADHDUFLAG | Total packets | Discarded packets |
| A | 0 | 19 | 0 |
| B | 0 | 19 | 0 |
| C | 0 | 19 | 0 |
| D | 0 | 19 | 0 |
| Mode M0 | |||
|---|---|---|---|
| Quadrant | BADHDUFLAG | Total packets | Discarded packets |
| A | 0 | 38062 | 5 |
| B | 0 | 40931 | 4 |
| C | 0 | 37620 | 4 |
| D | 0 | 40607 | 7 |
| Mode SS | |||
|---|---|---|---|
| Quadrant | BADHDUFLAG | Total packets | Discarded packets |
| A | 0 | 372 | 0 |
| B | 0 | 372 | 0 |
| C | 0 | 372 | 0 |
| D | 0 | 372 | 0 |
| Quadrant | Total seconds | Saturated seconds | Saturation percentage |
|---|---|---|---|
| A | 18225 | 194 | 1.064472% |
| B | 18225 | 527 | 2.891632% |
| C | 18225 | 131 | 0.718793% |
| D | 18224 | 236 | 1.294996% |
Noise dominated data is calculated using 1-second bins in cleaned event files. If a bin has >2000 counts, and if more than 50% of those come from <1% of pixels, then it is considered to be noise-dominated and hence unusable.
| Quadrant | # 1 sec bins | Bins with >0 counts | Bins with >2000 counts | High rate bins dominated by noise | Noise dominated (total time) | Noise dominated (detector-on time) | Marked lightcurve |
|---|---|---|---|---|---|---|---|
| A | 31271 | 18230 | 20 | 20 | 0.06% | 0.11% | 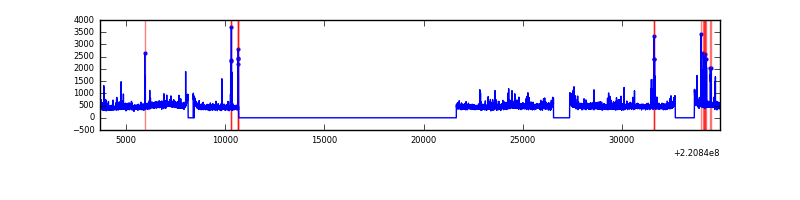 |
| B | 31271 | 18230 | 117 | 117 | 0.37% | 0.64% | 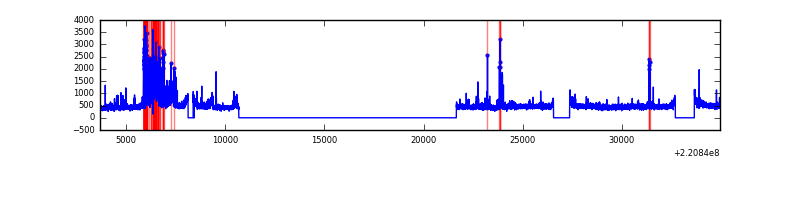 |
| C | 31271 | 18230 | 3 | 3 | 0.01% | 0.02% | 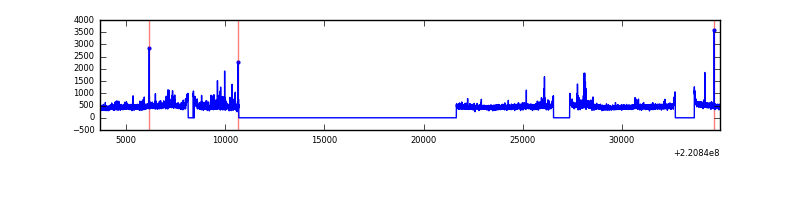 |
| D | 31271 | 18229 | 92 | 92 | 0.29% | 0.50% | 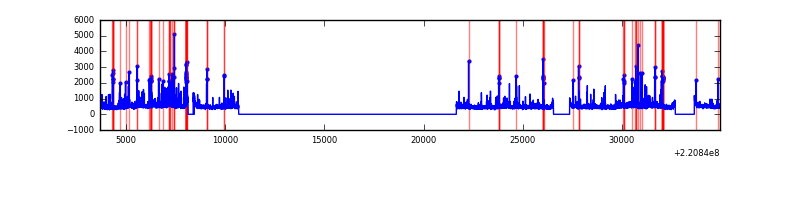 |
Top three noisy pixels from each quadrant. If the there are fewer than three noisy pixels in the level2.evt file, extra rows are filled as -1
| Pixel properties | Quadrant properties | ||||||
|---|---|---|---|---|---|---|---|
| Quadrant | DetID | PixID | Counts | Sigma | Mean | Median | Sigma |
| A | 8 | 15 | 469287 | 1078.34 | 2123 | 2073 | 433.3 |
| A | 13 | 14 | 45535 | 100.31 | 2123 | 2073 | 433.3 |
| A | 0 | 226 | 20065 | 41.52 | 2123 | 2073 | 433.3 |
| B | 4 | 81 | 1167377 | 2877.62 | 2123 | 2073 | 405.0 |
| B | 3 | 220 | 73959 | 177.52 | 2123 | 2073 | 405.0 |
| B | 0 | 228 | 65178 | 155.83 | 2123 | 2073 | 405.0 |
| C | 12 | 16 | 200571 | 412.23 | 2080 | 2092 | 481.5 |
| C | 9 | 247 | 156059 | 319.78 | 2080 | 2092 | 481.5 |
| C | 1 | 3 | 24442 | 46.42 | 2080 | 2092 | 481.5 |
| D | 8 | 195 | 816674 | 1598.51 | 2075 | 2008 | 509.6 |
| D | 14 | 34 | 518481 | 1013.4 | 2075 | 2008 | 509.6 |
| D | 2 | 216 | 254410 | 495.25 | 2075 | 2008 | 509.6 |
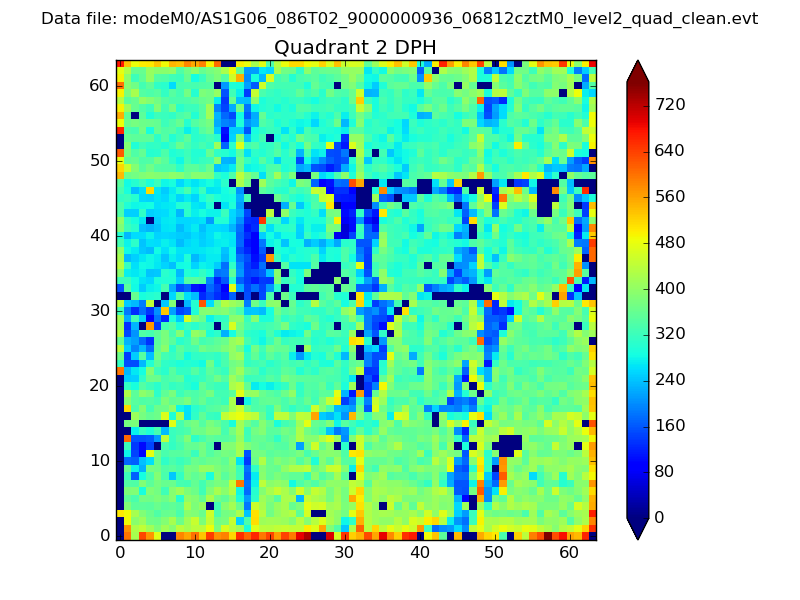
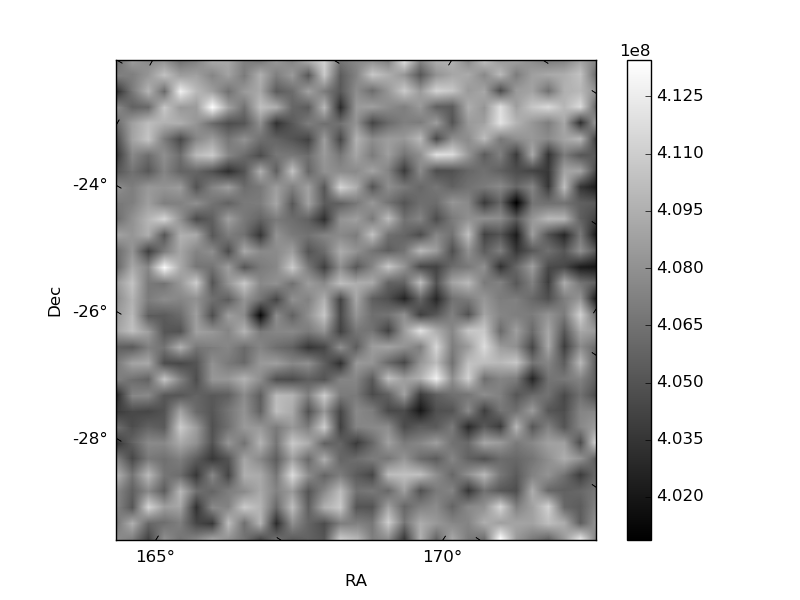
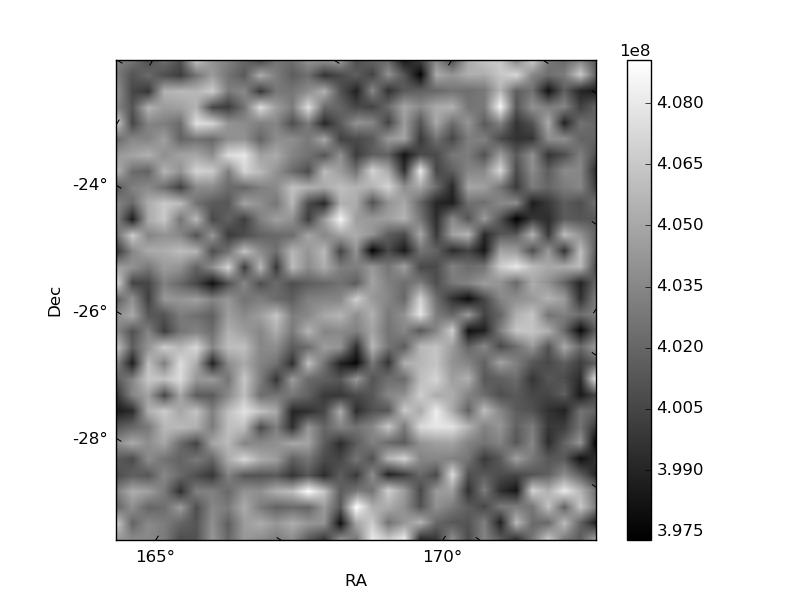
Histogram calculated using DETX and DETY for each event in the final _common_clean file
| Quadrant A | 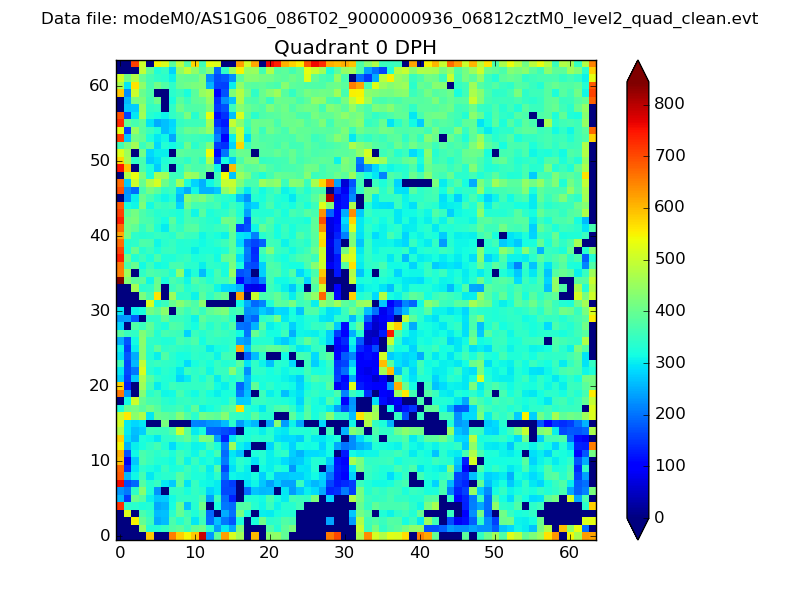 |
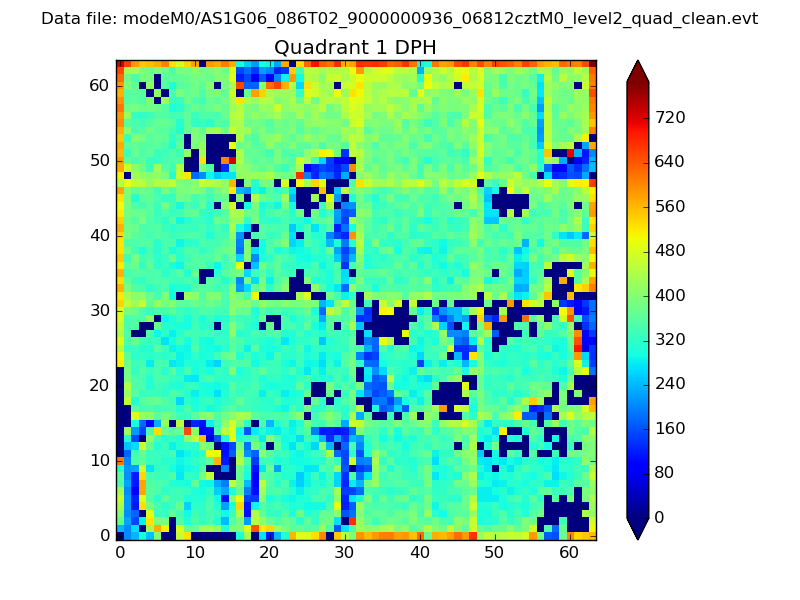 |
Quadrant B |
|---|---|---|---|
| Quadrant D | 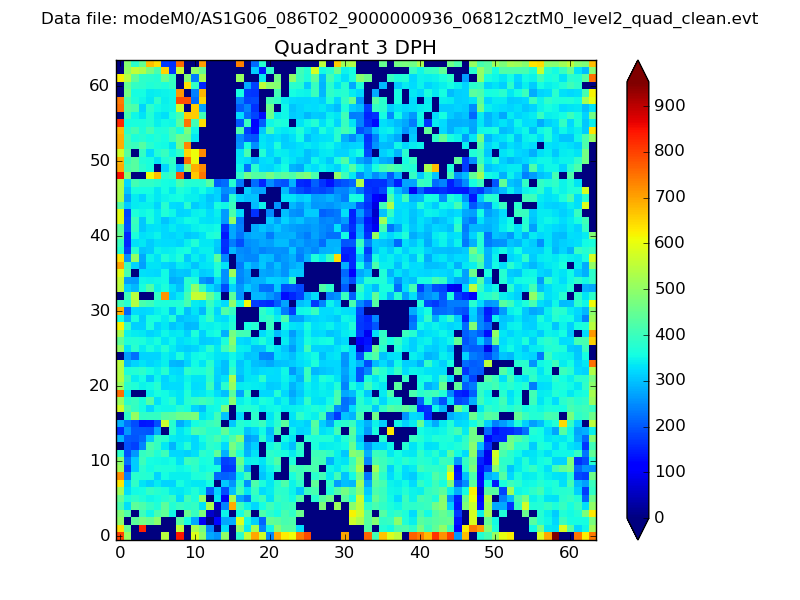 |
 |
Quadrant C |
| Plot type | Count rate plots | Images |
|---|---|---|
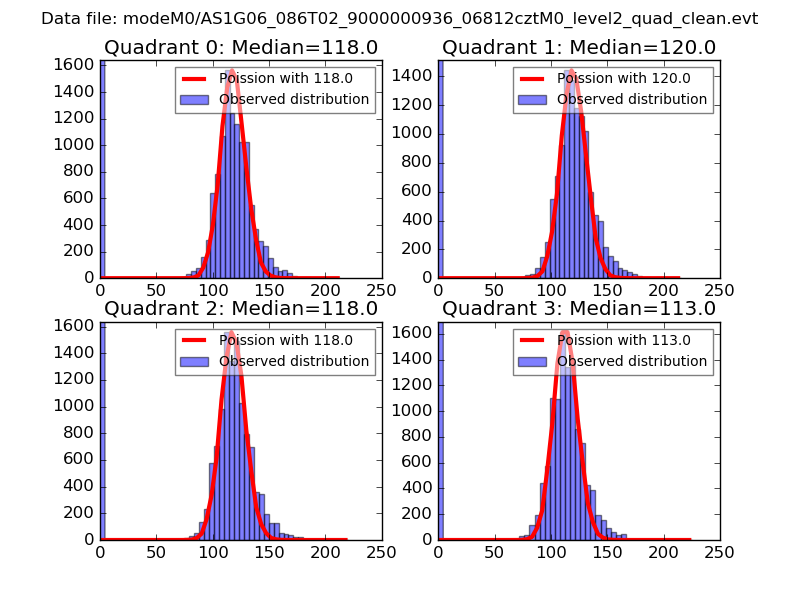
| Comparison with Poisson distribution Blue bars denote a histogram of data divided into 1 sec bins. Red curve is a Poisson curve with rate = median count rate of data. |
 |
 |
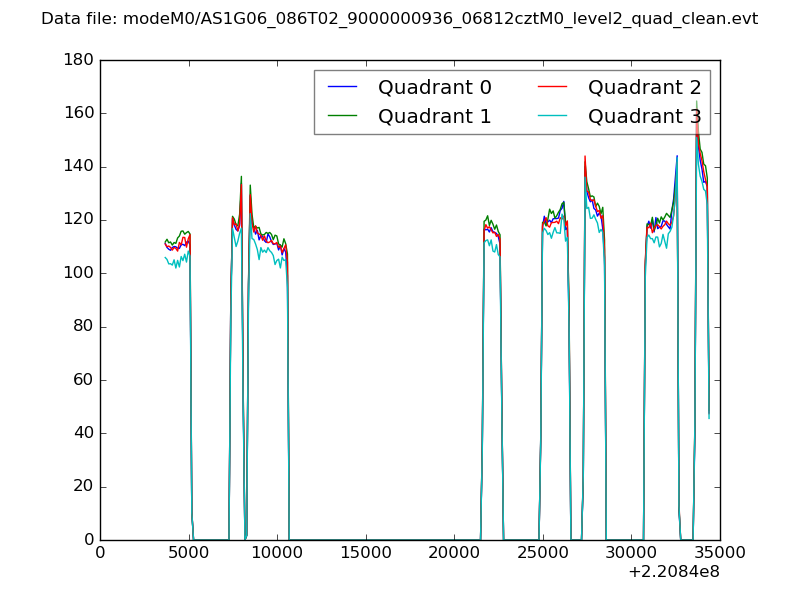
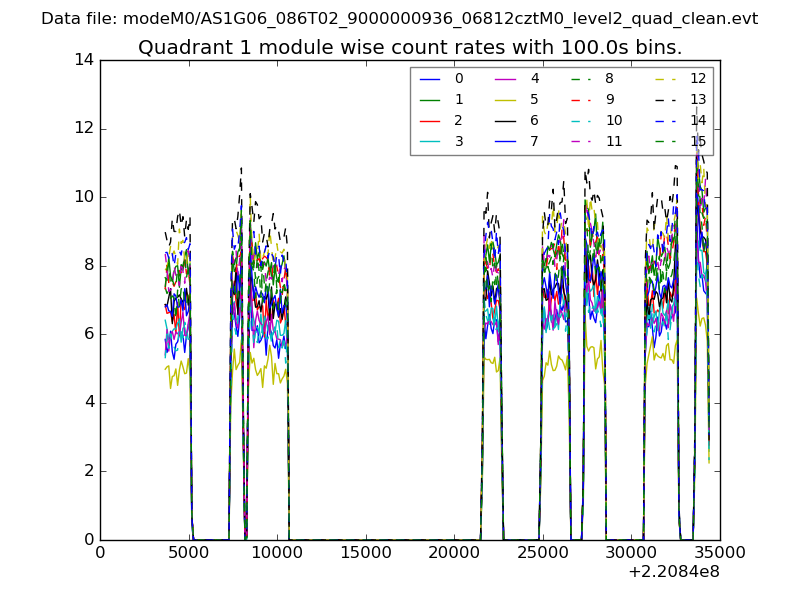
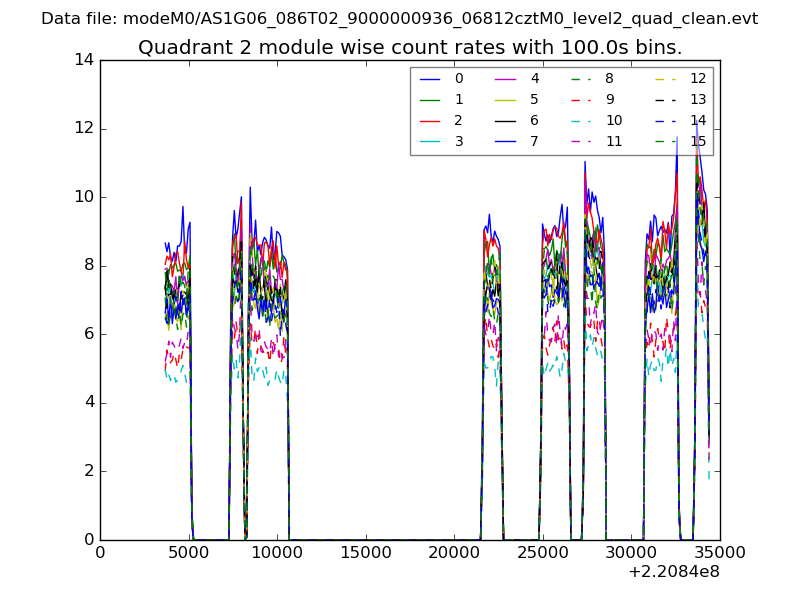
| Quadrant-wise count rates Data is divided into 100 sec bins |
 |
|
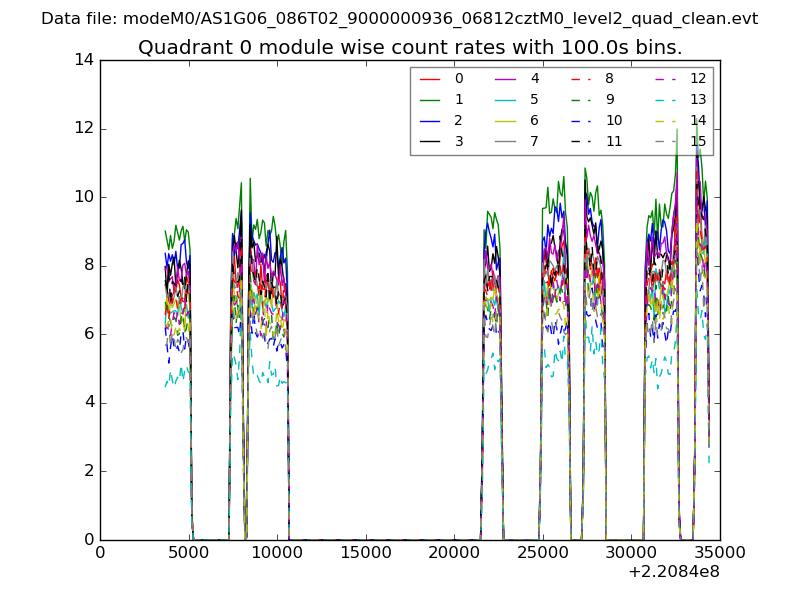
| Module-wise count rates for Quadrant A Data is divided into 100 sec bins |
 |
 |
| Module-wise count rates for Quadrant B Data is divided into 100 sec bins |
 |
 |
| Module-wise count rates for Quadrant C Data is divided into 100 sec bins |
 |
 |
| Module-wise count rates for Quadrant D Data is divided into 100 sec bins |
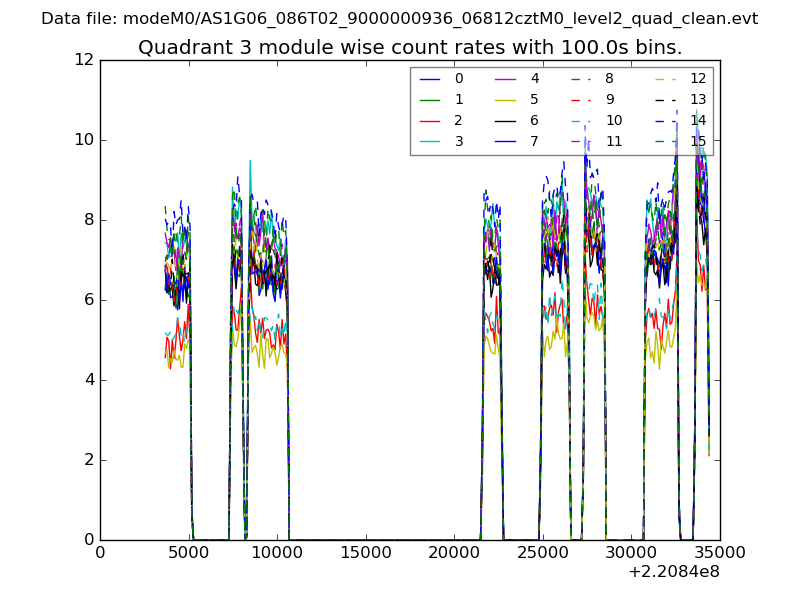 |
 |
| Parameter | Plot |
|---|---|
| CZT HV Monitor | 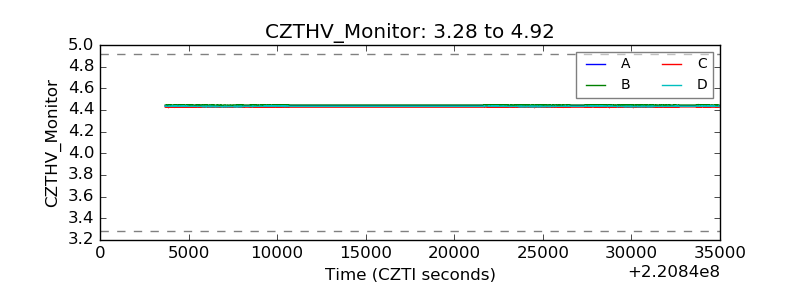 |
| D_VDD | 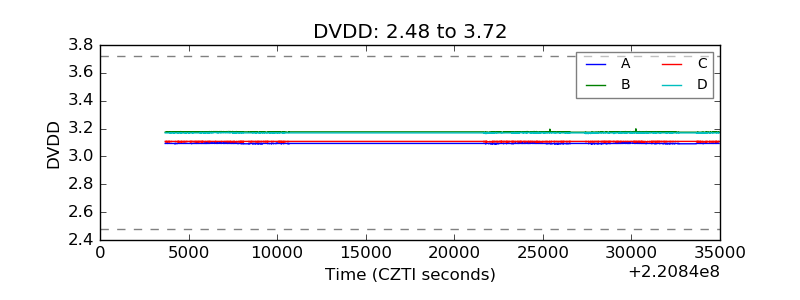 |
| Temperature 1 |  |
| Veto HV Monitor | 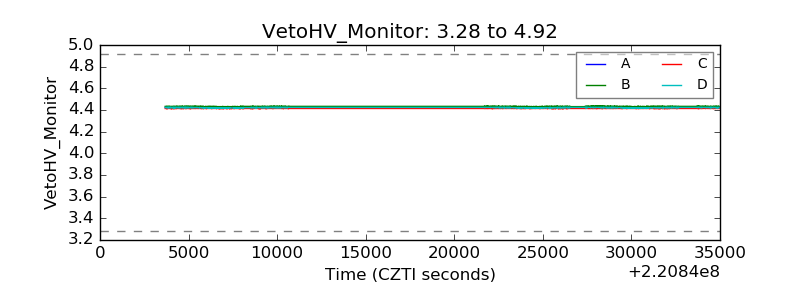 |
| Veto LLD |  |
| Alpha Counter | 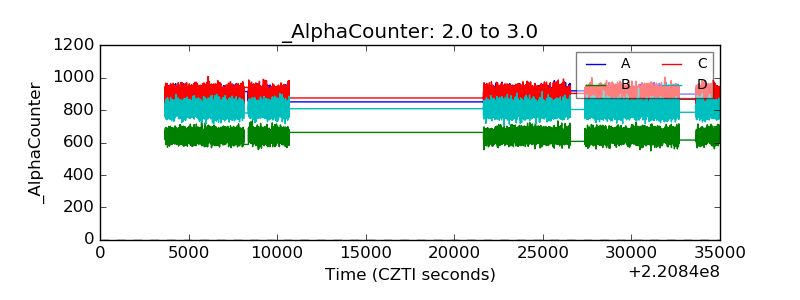 |
| _CPM_Rate | 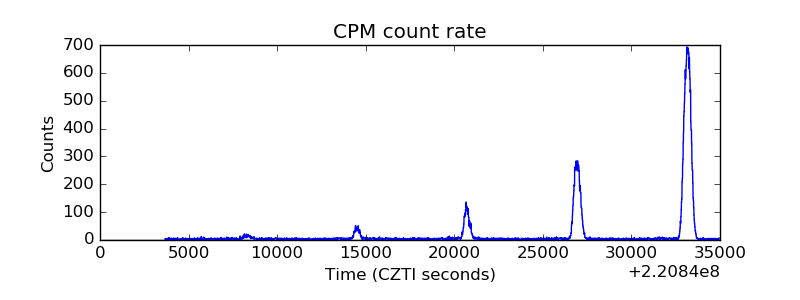 |
| CZT Counter | 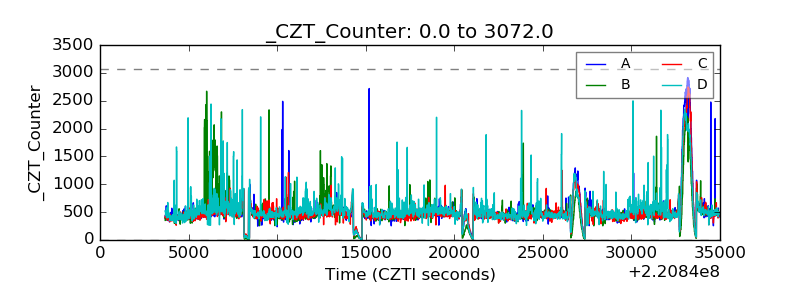 |
| +2.5 Volts monitor |  |
| +5 Volts monitor |  |
| _ROLL_ROT | 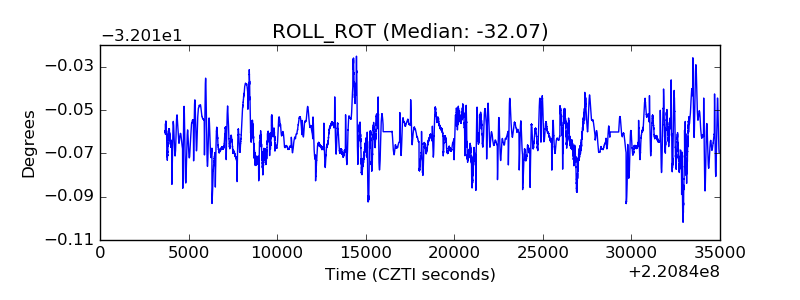 |
| _Roll_DEC | 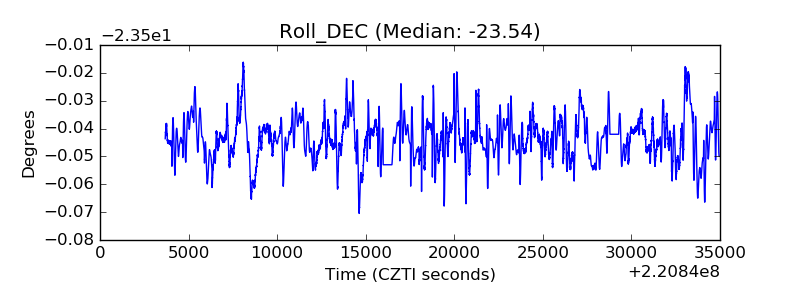 |
| _Roll_RA | 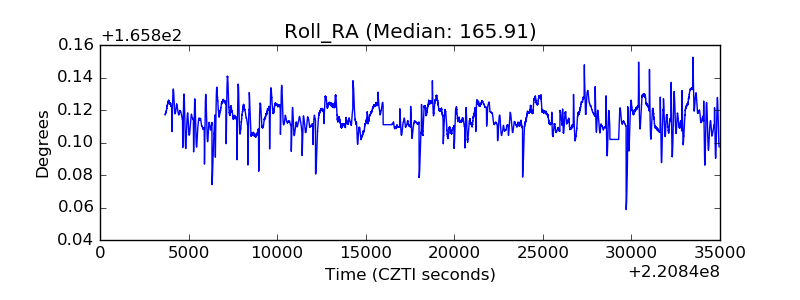 |
| Veto Counter | 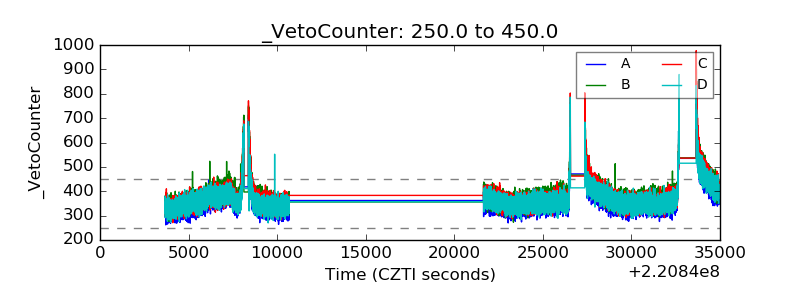 |