| Param | Original file | Final file |
|---|---|---|
| Filename | modeM0/AS1G06_086T02_9000000936_06814cztM0_level2.evt | modeM0/AS1G06_086T02_9000000936_06814cztM0_level2_quad_clean.evt |
| Size (bytes) | 458,861,760 | 72,181,440 |
| Size | 437.6 MB | 68.8 MB |
| Events in quadrant A | 3,319,205 | 439,553 |
| Events in quadrant B | 3,166,867 | 443,675 |
| Events in quadrant C | 3,112,644 | 433,238 |
| Events in quadrant D | 3,860,299 | 419,662 |
| Mode M9 | |||
|---|---|---|---|
| Quadrant | BADHDUFLAG | Total packets | Discarded packets |
| A | 0 | 12 | 0 |
| B | 0 | 12 | 0 |
| C | 0 | 12 | 0 |
| D | 0 | 13 | 0 |
| Mode M0 | |||
|---|---|---|---|
| Quadrant | BADHDUFLAG | Total packets | Discarded packets |
| A | 0 | 13981 | 3 |
| B | 0 | 13486 | 2 |
| C | 0 | 13498 | 2 |
| D | 0 | 15614 | 2 |
| Mode SS | |||
|---|---|---|---|
| Quadrant | BADHDUFLAG | Total packets | Discarded packets |
| A | 0 | 132 | 0 |
| B | 0 | 132 | 0 |
| C | 0 | 132 | 0 |
| D | 0 | 132 | 0 |
| Quadrant | Total seconds | Saturated seconds | Saturation percentage |
|---|---|---|---|
| A | 6439 | 100 | 1.553036% |
| B | 6439 | 70 | 1.087125% |
| C | 6439 | 48 | 0.745457% |
| D | 6439 | 107 | 1.661749% |
Noise dominated data is calculated using 1-second bins in cleaned event files. If a bin has >2000 counts, and if more than 50% of those come from <1% of pixels, then it is considered to be noise-dominated and hence unusable.
| Quadrant | # 1 sec bins | Bins with >0 counts | Bins with >2000 counts | High rate bins dominated by noise | Noise dominated (total time) | Noise dominated (detector-on time) | Marked lightcurve |
|---|---|---|---|---|---|---|---|
| A | 7564 | 6440 | 14 | 14 | 0.19% | 0.22% |  |
| B | 7564 | 6440 | 0 | 0 | 0.00% | 0.00% |  |
| C | 7564 | 6440 | 2 | 2 | 0.03% | 0.03% | 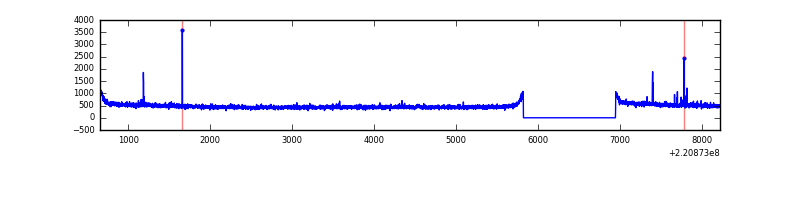 |
| D | 7564 | 6440 | 61 | 61 | 0.81% | 0.95% | 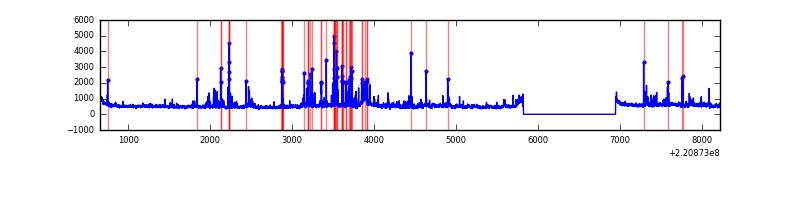 |
Top three noisy pixels from each quadrant. If the there are fewer than three noisy pixels in the level2.evt file, extra rows are filled as -1
| Pixel properties | Quadrant properties | ||||||
|---|---|---|---|---|---|---|---|
| Quadrant | DetID | PixID | Counts | Sigma | Mean | Median | Sigma |
| A | 8 | 15 | 182718 | 1124.71 | 800 | 782 | 161.8 |
| A | 13 | 248 | 22807 | 136.16 | 800 | 782 | 161.8 |
| A | 15 | 234 | 14707 | 86.08 | 800 | 782 | 161.8 |
| B | 4 | 81 | 26135 | 164.59 | 801 | 783 | 154.0 |
| B | 4 | 173 | 24142 | 151.65 | 801 | 783 | 154.0 |
| B | 12 | 111 | 15392 | 94.84 | 801 | 783 | 154.0 |
| C | 12 | 16 | 28775 | 156.77 | 778 | 784 | 178.6 |
| C | 9 | 247 | 26474 | 143.88 | 778 | 784 | 178.6 |
| C | 12 | 4 | 9764 | 50.29 | 778 | 784 | 178.6 |
| D | 8 | 195 | 346630 | 1805.38 | 779 | 756 | 191.6 |
| D | 14 | 34 | 340616 | 1773.99 | 779 | 756 | 191.6 |
| D | 2 | 216 | 118355 | 613.84 | 779 | 756 | 191.6 |
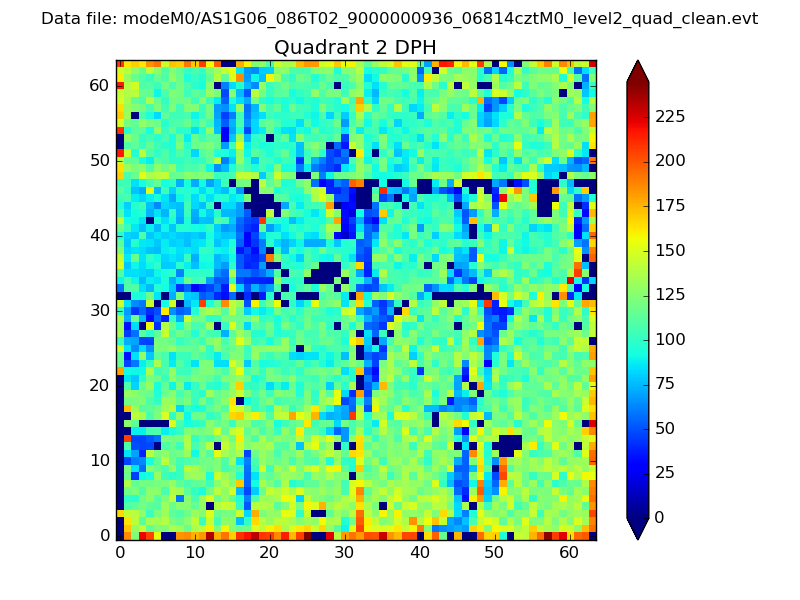
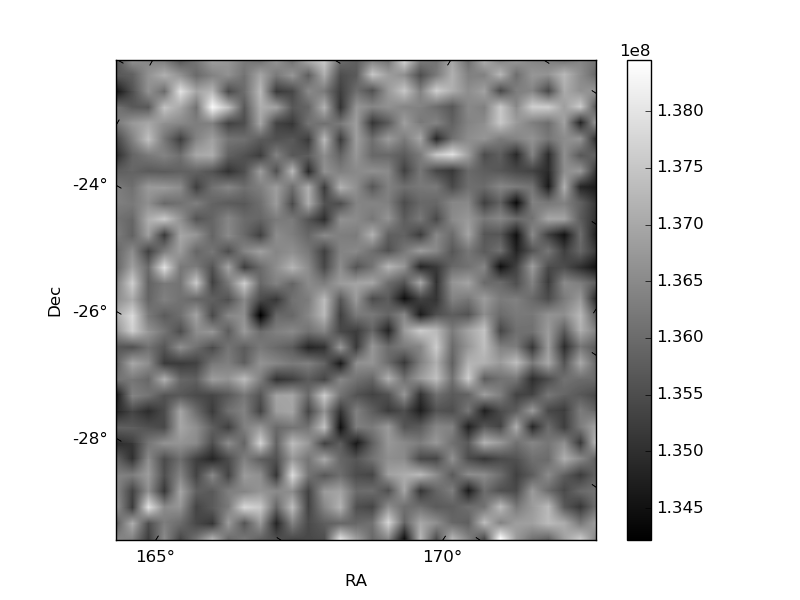
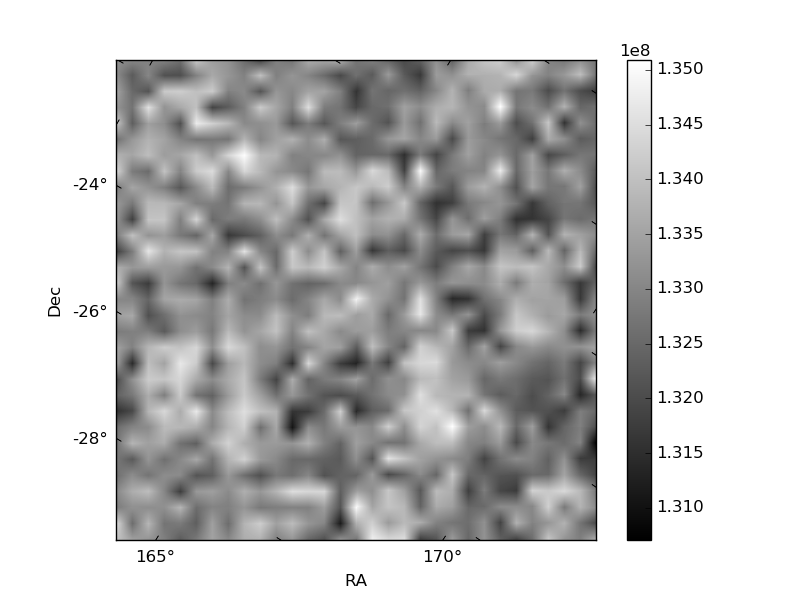
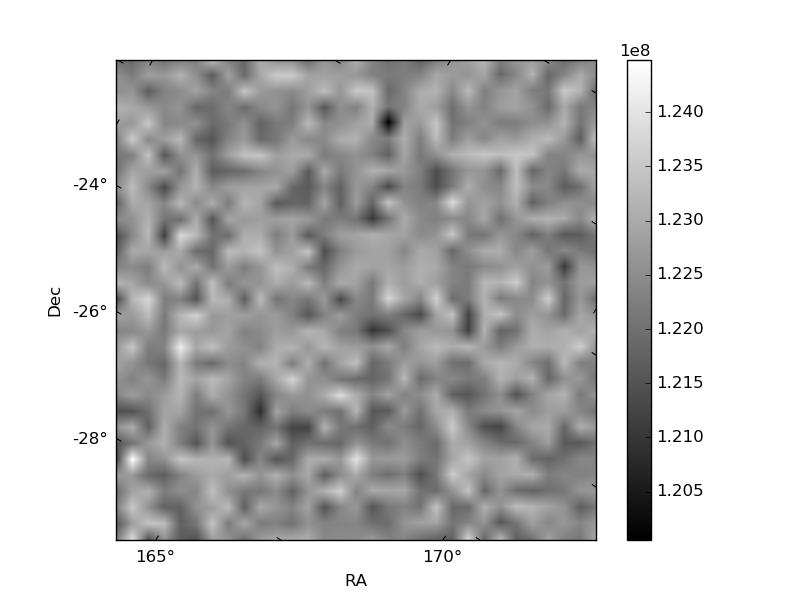
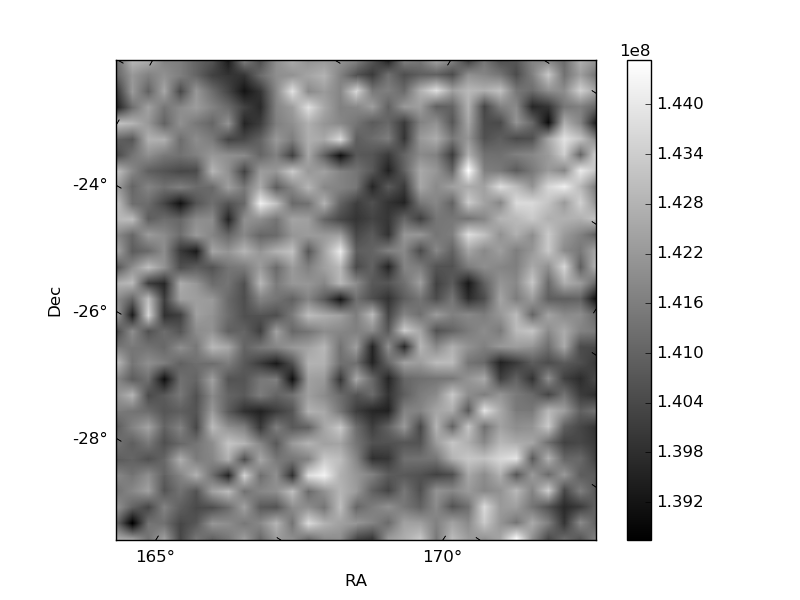
Histogram calculated using DETX and DETY for each event in the final _common_clean file
| Quadrant A | 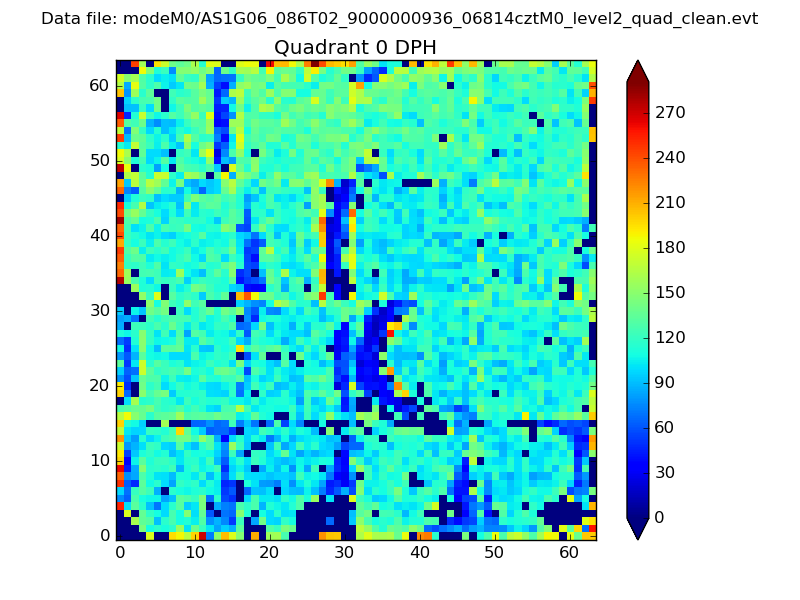 |
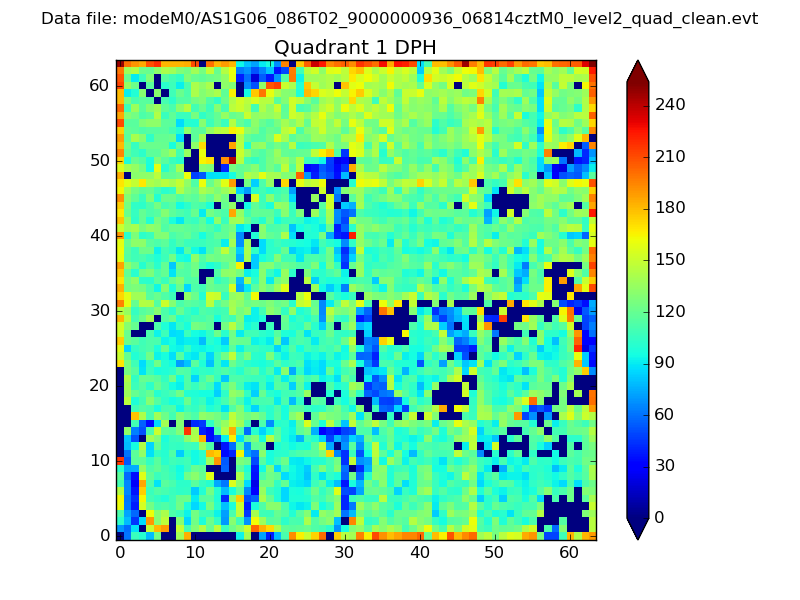 |
Quadrant B |
|---|---|---|---|
| Quadrant D | 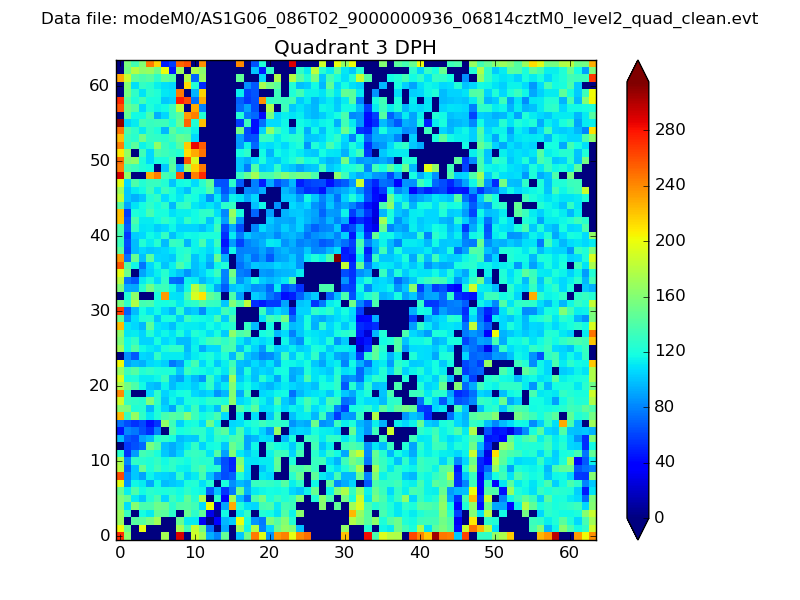 |
 |
Quadrant C |
| Plot type | Count rate plots | Images |
|---|---|---|
| Comparison with Poisson distribution Blue bars denote a histogram of data divided into 1 sec bins. Red curve is a Poisson curve with rate = median count rate of data. |
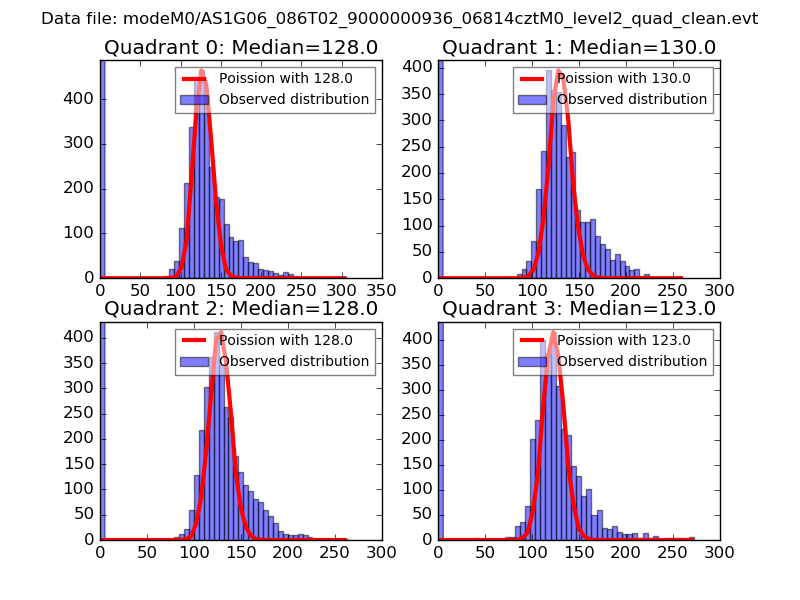 |
 |
| Quadrant-wise count rates Data is divided into 100 sec bins |
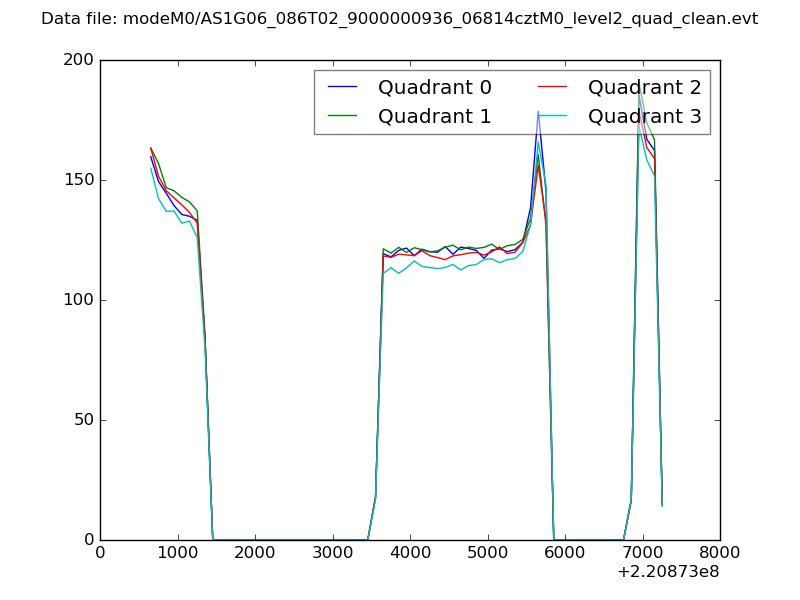 |
|
| Module-wise count rates for Quadrant A Data is divided into 100 sec bins |
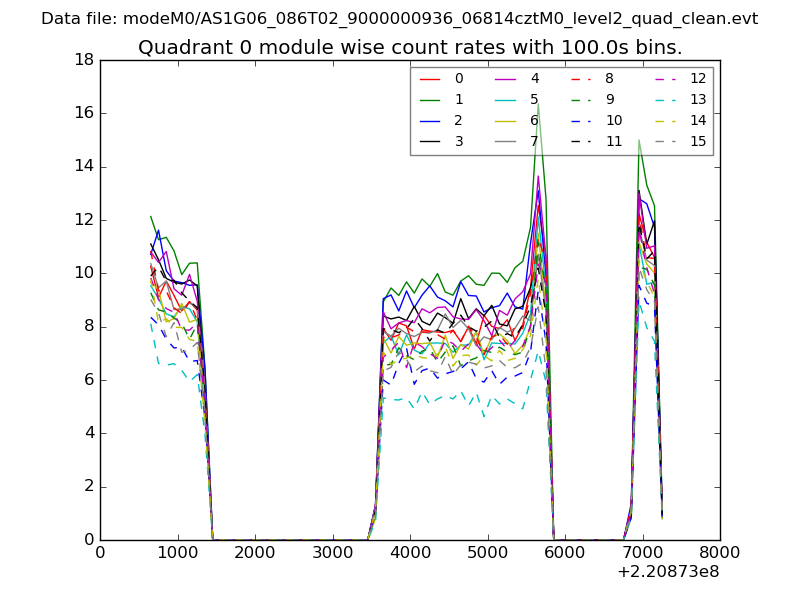 |
 |
| Module-wise count rates for Quadrant B Data is divided into 100 sec bins |
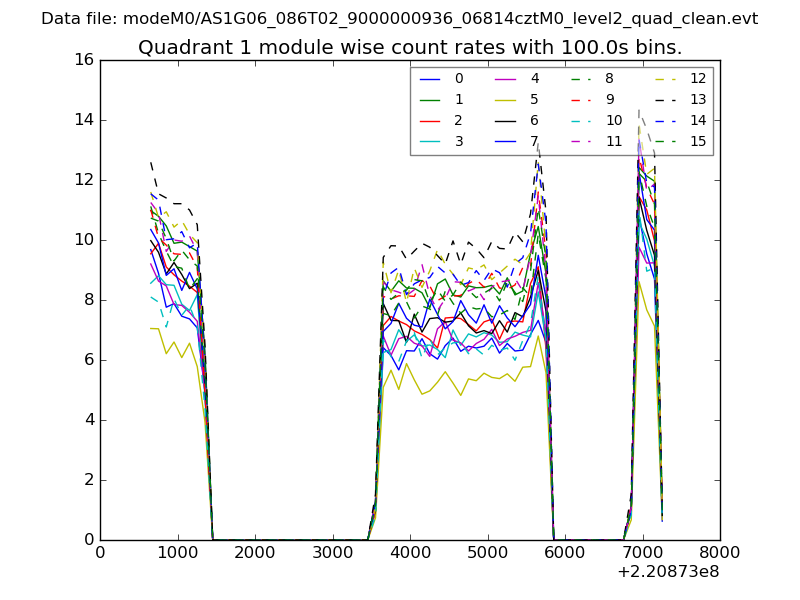 |
 |
| Module-wise count rates for Quadrant C Data is divided into 100 sec bins |
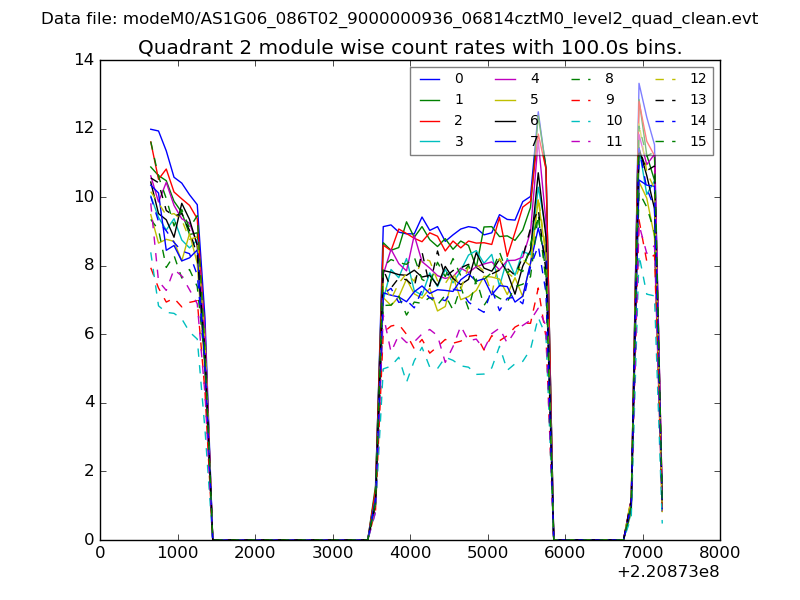 |
 |
| Module-wise count rates for Quadrant D Data is divided into 100 sec bins |
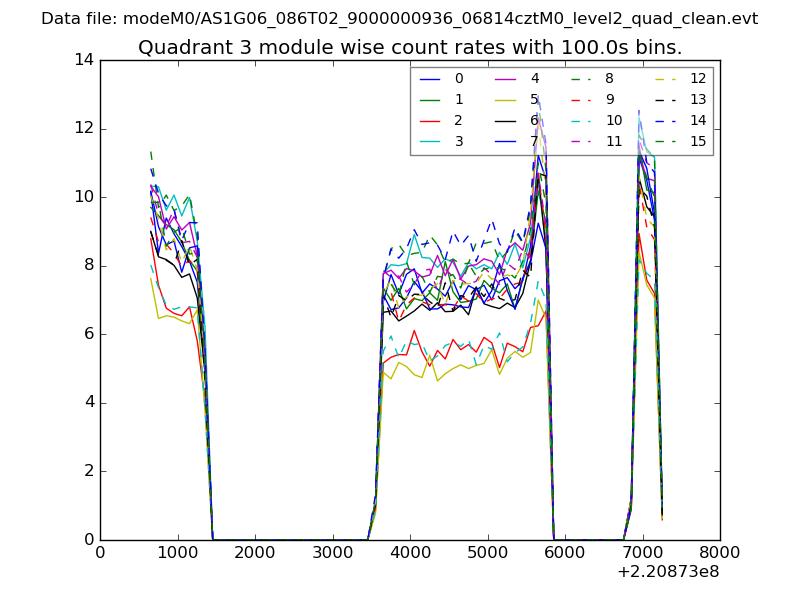 |
 |
| Parameter | Plot |
|---|---|
| CZT HV Monitor | 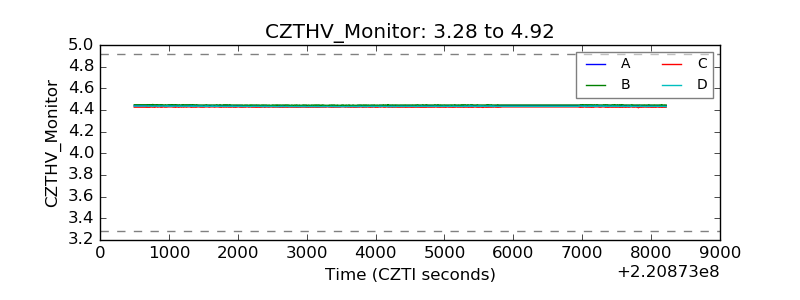 |
| D_VDD | 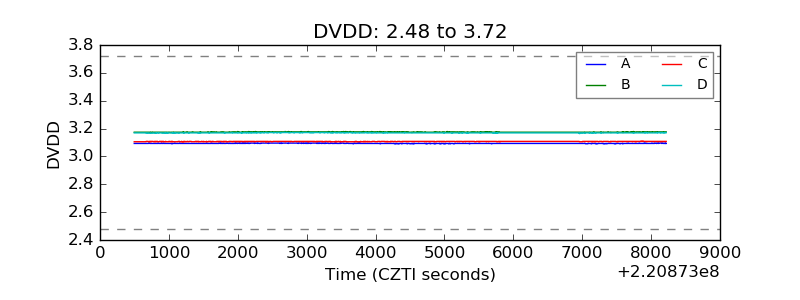 |
| Temperature 1 | 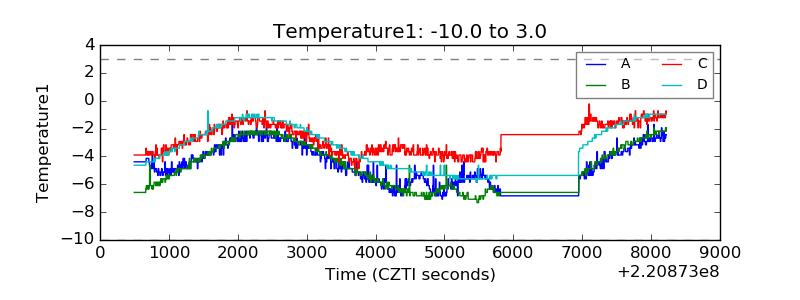 |
| Veto HV Monitor | 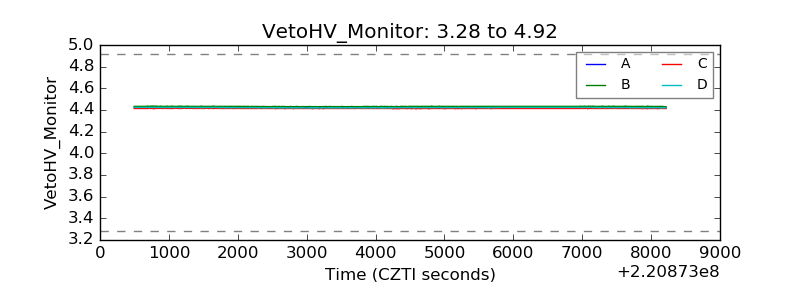 |
| Veto LLD |  |
| Alpha Counter | 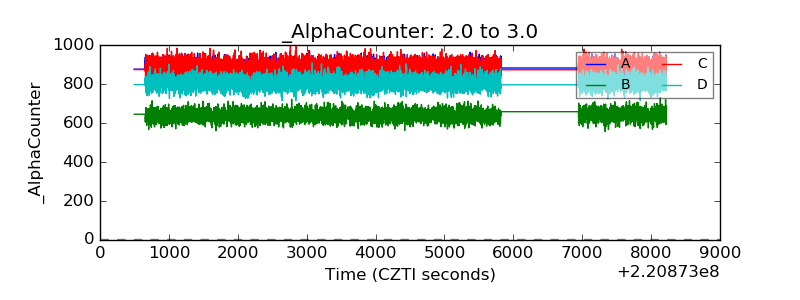 |
| _CPM_Rate | 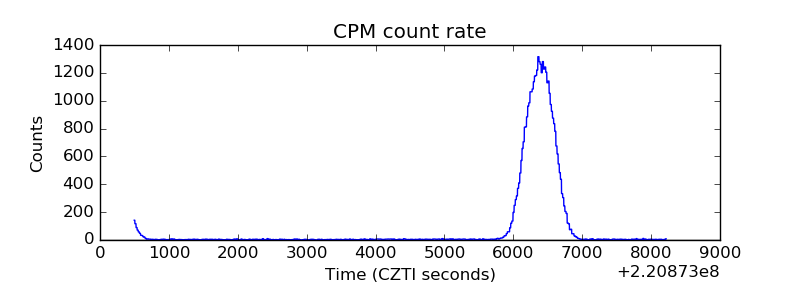 |
| CZT Counter | 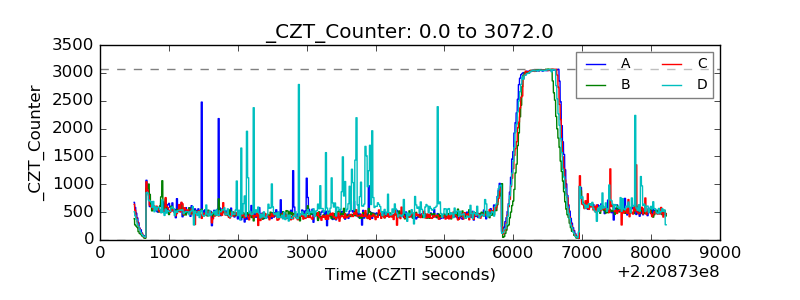 |
| +2.5 Volts monitor |  |
| +5 Volts monitor |  |
| _ROLL_ROT | 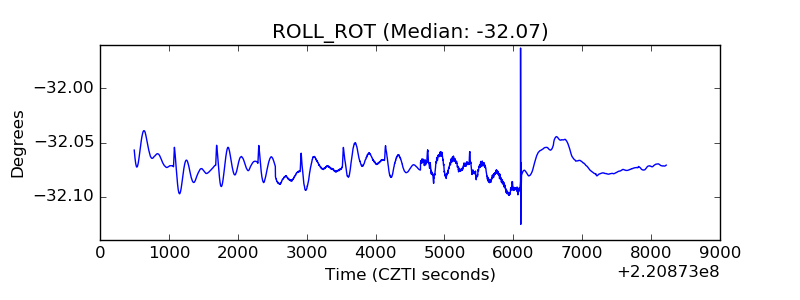 |
| _Roll_DEC | 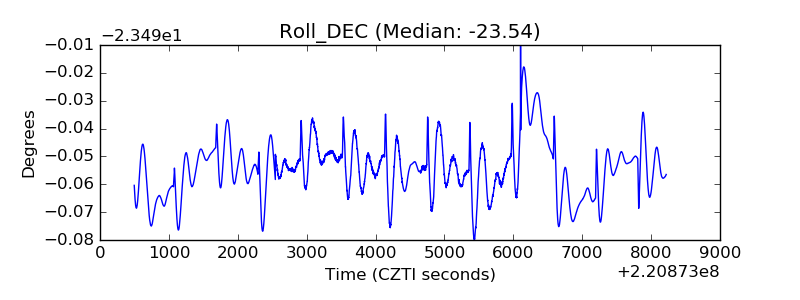 |
| _Roll_RA | 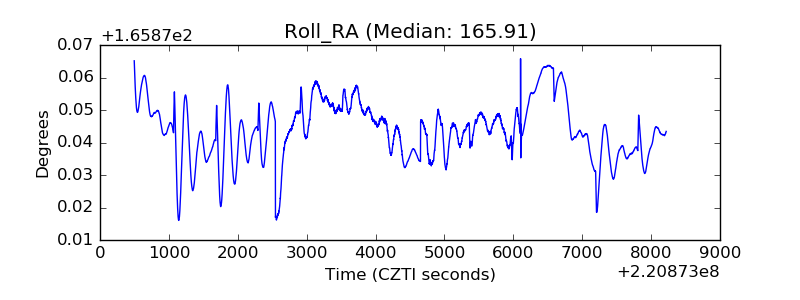 |
| Veto Counter | 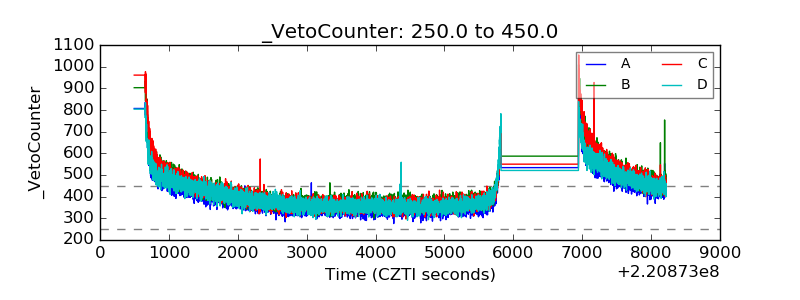 |