| Param | Original file | Final file |
|---|---|---|
| Filename | modeM0/AS1G06_086T02_9000000936_06815cztM0_level2.evt | modeM0/AS1G06_086T02_9000000936_06815cztM0_level2_quad_clean.evt |
| Size (bytes) | 2,657,865,600 | 429,071,040 |
| Size | 2.5 GB | 409.2 MB |
| Events in quadrant A | 18,642,637 | 2,604,236 |
| Events in quadrant B | 19,599,774 | 2,649,535 |
| Events in quadrant C | 18,132,248 | 2,596,649 |
| Events in quadrant D | 21,507,169 | 2,488,055 |
| Mode M9 | |||
|---|---|---|---|
| Quadrant | BADHDUFLAG | Total packets | Discarded packets |
| A | 0 | 52 | 0 |
| B | 0 | 52 | 0 |
| C | 0 | 52 | 0 |
| D | 0 | 52 | 0 |
| Mode M0 | |||
|---|---|---|---|
| Quadrant | BADHDUFLAG | Total packets | Discarded packets |
| A | 0 | 80836 | 9 |
| B | 0 | 83977 | 8 |
| C | 0 | 79863 | 8 |
| D | 0 | 88976 | 8 |
| Mode SS | |||
|---|---|---|---|
| Quadrant | BADHDUFLAG | Total packets | Discarded packets |
| A | 0 | 792 | 0 |
| B | 0 | 792 | 0 |
| C | 0 | 792 | 0 |
| D | 0 | 792 | 0 |
| Quadrant | Total seconds | Saturated seconds | Saturation percentage |
|---|---|---|---|
| A | 38667 | 434 | 1.122404% |
| B | 38667 | 777 | 2.009465% |
| C | 38667 | 314 | 0.812062% |
| D | 38667 | 541 | 1.399126% |
Noise dominated data is calculated using 1-second bins in cleaned event files. If a bin has >2000 counts, and if more than 50% of those come from <1% of pixels, then it is considered to be noise-dominated and hence unusable.
| Quadrant | # 1 sec bins | Bins with >0 counts | Bins with >2000 counts | High rate bins dominated by noise | Noise dominated (total time) | Noise dominated (detector-on time) | Marked lightcurve |
|---|---|---|---|---|---|---|---|
| A | 44172 | 38675 | 32 | 32 | 0.07% | 0.08% | 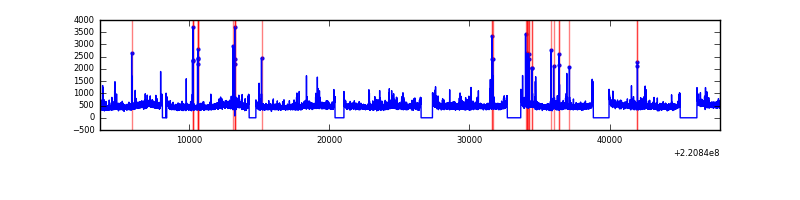 |
| B | 44172 | 38675 | 123 | 123 | 0.28% | 0.32% |  |
| C | 44172 | 38675 | 5 | 5 | 0.01% | 0.01% | 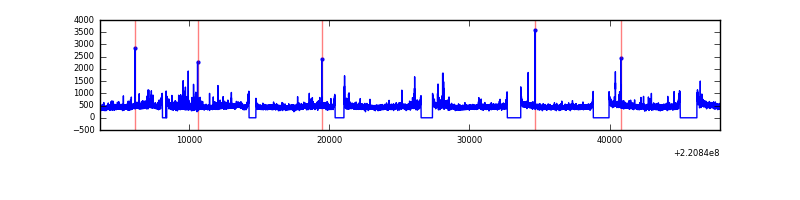 |
| D | 44172 | 38675 | 191 | 191 | 0.43% | 0.49% |  |
Top three noisy pixels from each quadrant. If the there are fewer than three noisy pixels in the level2.evt file, extra rows are filled as -1
| Pixel properties | Quadrant properties | ||||||
|---|---|---|---|---|---|---|---|
| Quadrant | DetID | PixID | Counts | Sigma | Mean | Median | Sigma |
| A | 8 | 15 | 817435 | 879.2 | 4586 | 4488 | 924.6 |
| A | 13 | 14 | 82941 | 84.85 | 4586 | 4488 | 924.6 |
| A | 13 | 248 | 44028 | 42.76 | 4586 | 4488 | 924.6 |
| B | 4 | 81 | 1403781 | 1601.06 | 4598 | 4490 | 874.0 |
| B | 3 | 220 | 110966 | 121.83 | 4598 | 4490 | 874.0 |
| B | 0 | 228 | 98002 | 107.0 | 4598 | 4490 | 874.0 |
| C | 9 | 247 | 285275 | 271.67 | 4480 | 4504 | 1033.5 |
| C | 12 | 16 | 281435 | 267.95 | 4480 | 4504 | 1033.5 |
| C | 13 | 61 | 35158 | 29.66 | 4480 | 4504 | 1033.5 |
| D | 8 | 195 | 2341116 | 2124.08 | 4477 | 4336 | 1100.1 |
| D | 14 | 34 | 1189564 | 1077.34 | 4477 | 4336 | 1100.1 |
| D | 2 | 216 | 584780 | 527.61 | 4477 | 4336 | 1100.1 |
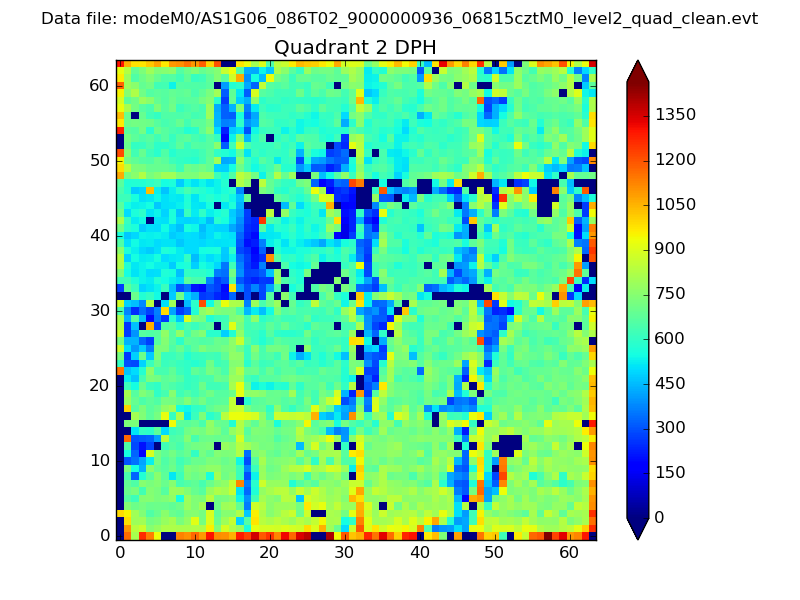
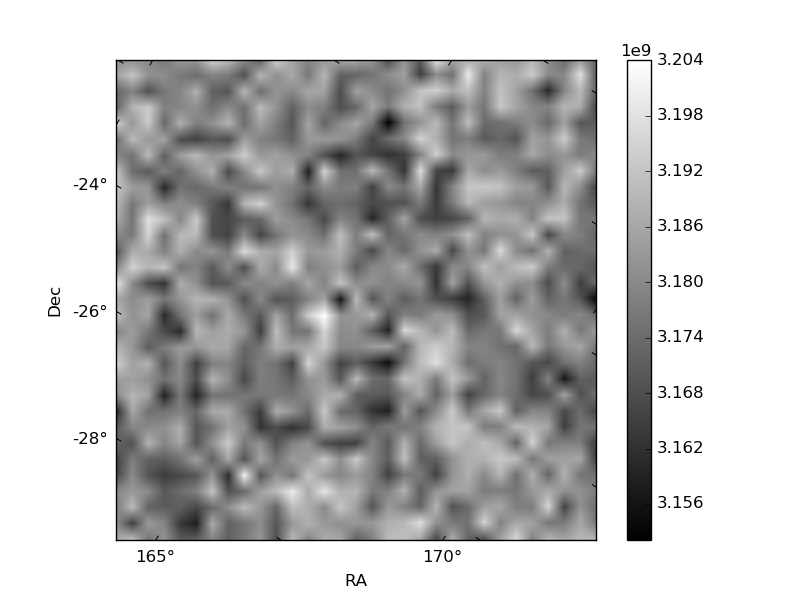
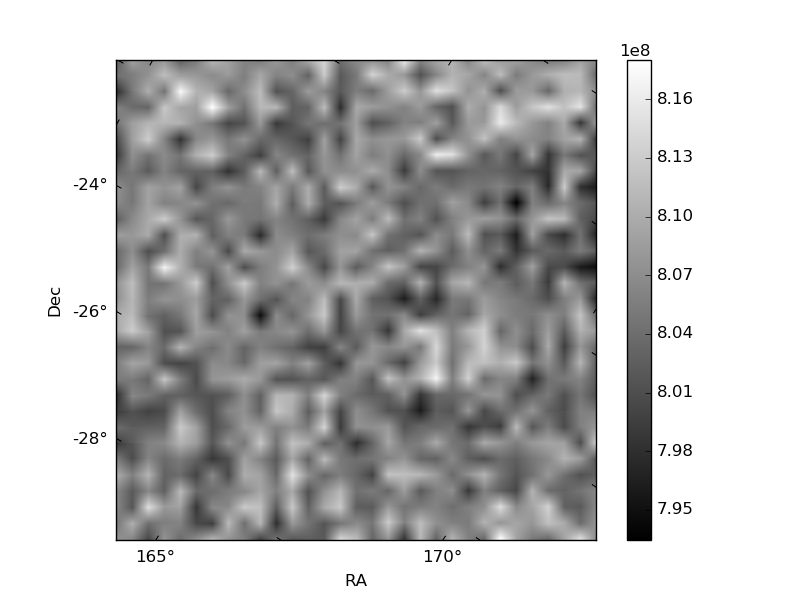
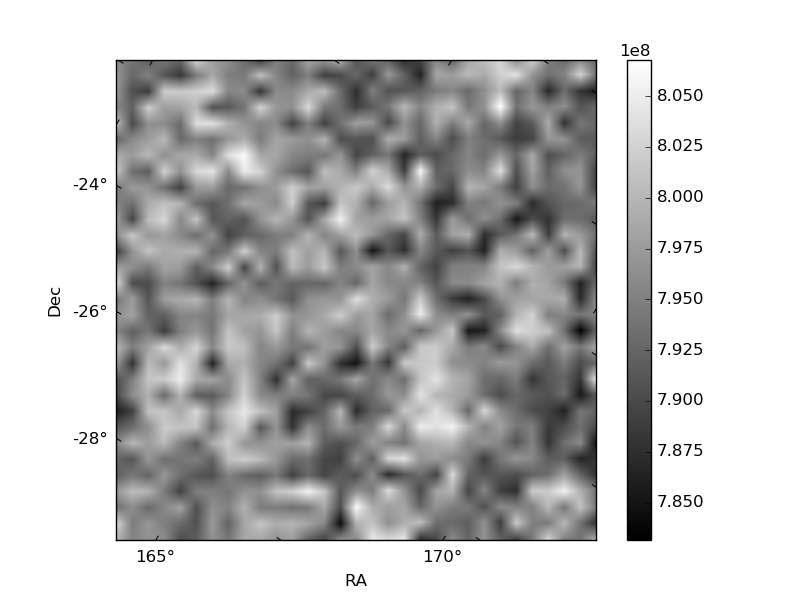
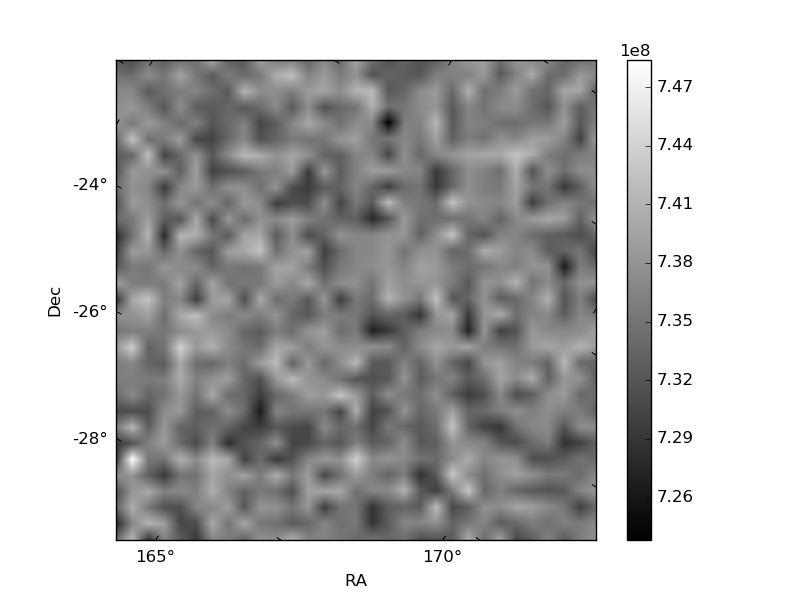
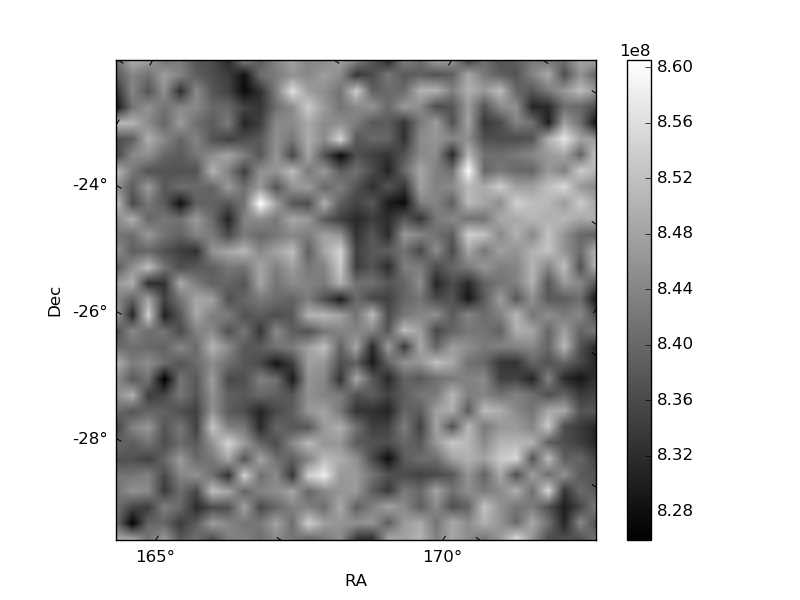
Histogram calculated using DETX and DETY for each event in the final _common_clean file
| Quadrant A |  |
 |
Quadrant B |
|---|---|---|---|
| Quadrant D |  |
 |
Quadrant C |
| Plot type | Count rate plots | Images |
|---|---|---|
| Comparison with Poisson distribution Blue bars denote a histogram of data divided into 1 sec bins. Red curve is a Poisson curve with rate = median count rate of data. |
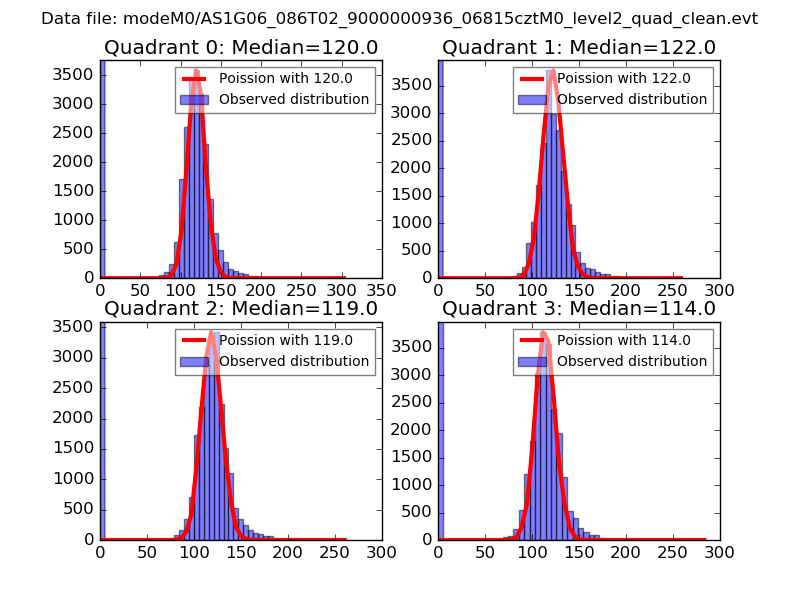 |
 |
| Quadrant-wise count rates Data is divided into 100 sec bins |
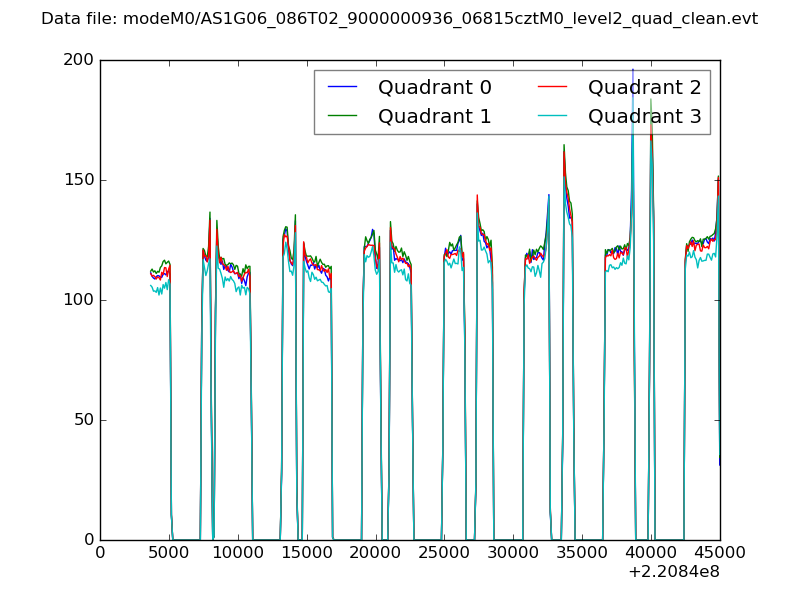 |
|
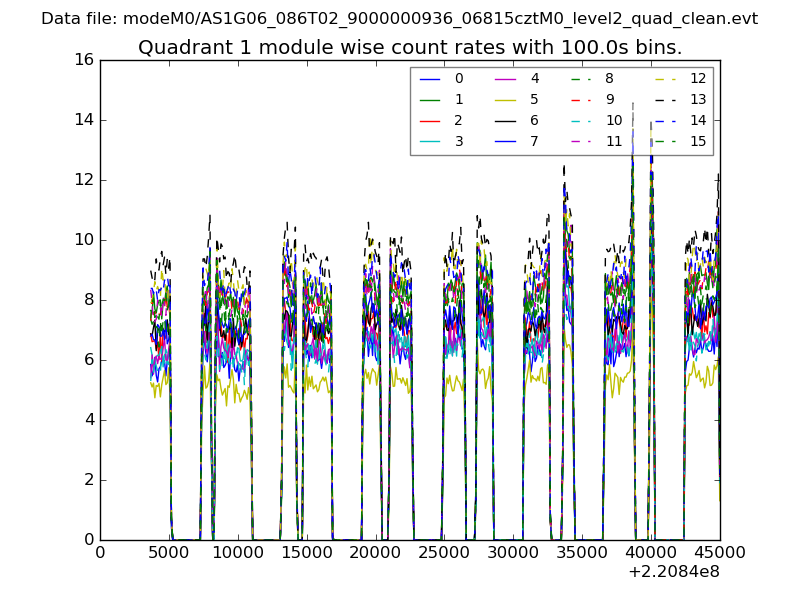
| Module-wise count rates for Quadrant A Data is divided into 100 sec bins |
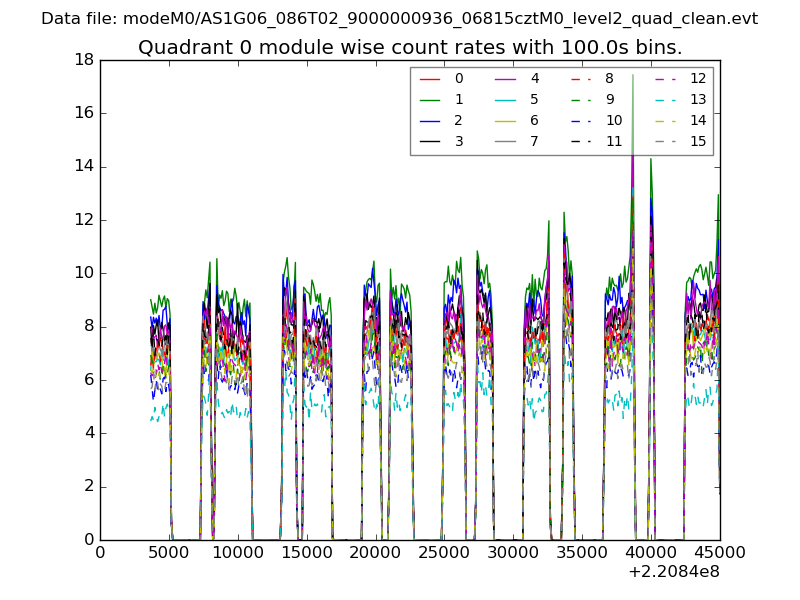 |
 |
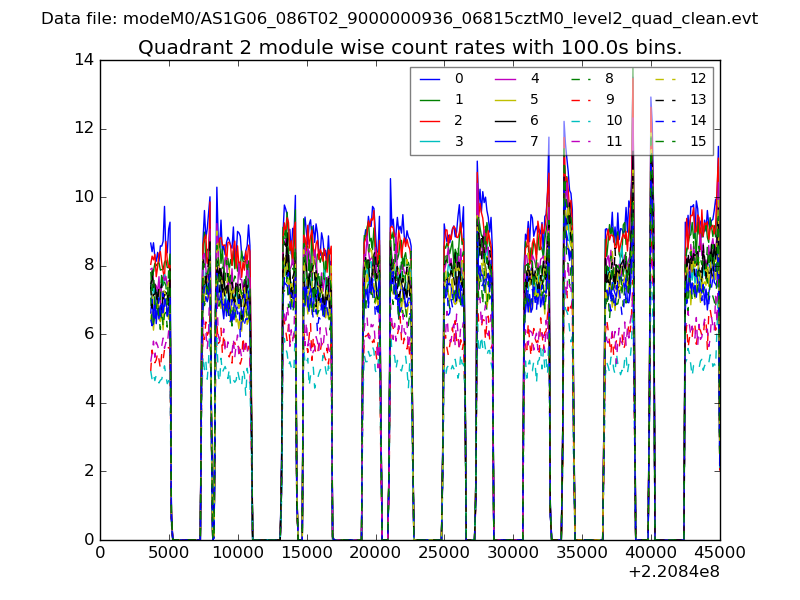
| Module-wise count rates for Quadrant B Data is divided into 100 sec bins |
 |
 |
| Module-wise count rates for Quadrant C Data is divided into 100 sec bins |
 |
 |
| Module-wise count rates for Quadrant D Data is divided into 100 sec bins |
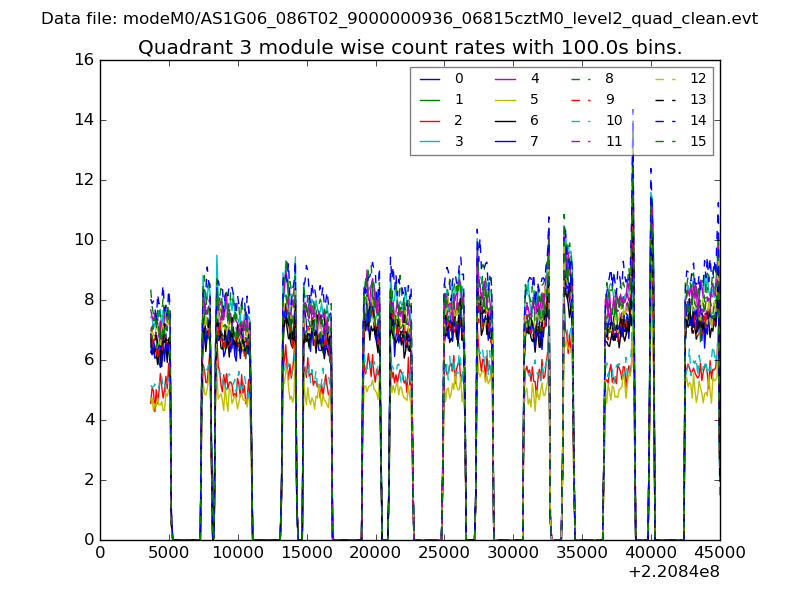 |
 |
| Parameter | Plot |
|---|---|
| CZT HV Monitor | 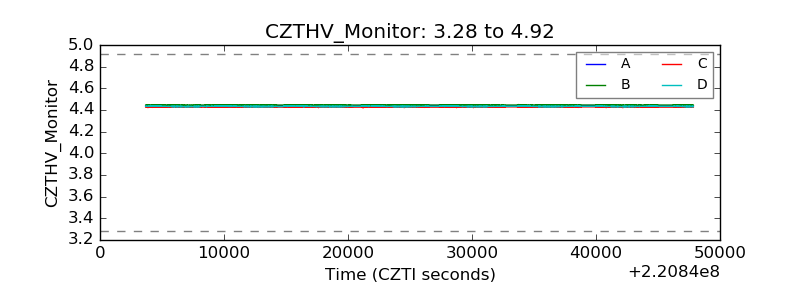 |
| D_VDD | 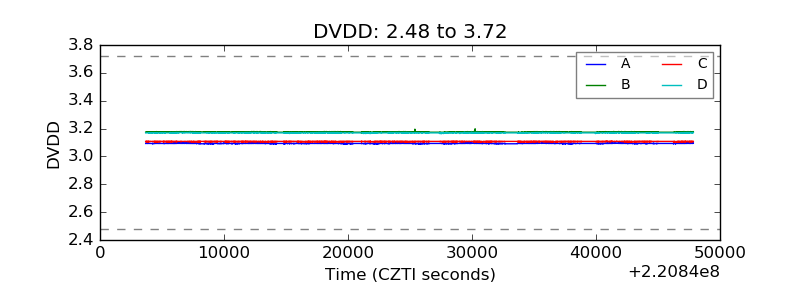 |
| Temperature 1 | 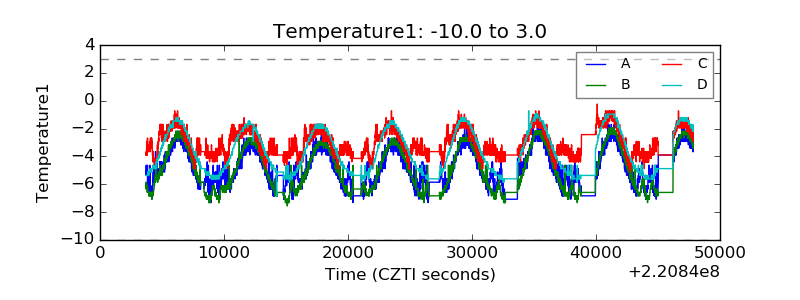 |
| Veto HV Monitor | 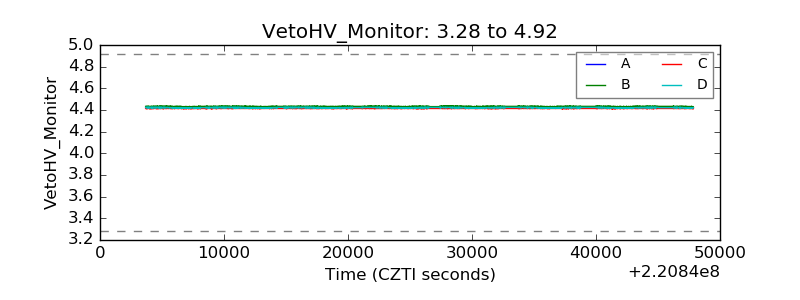 |
| Veto LLD | 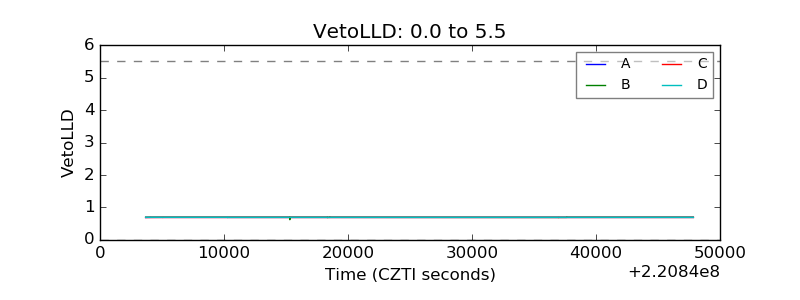 |
| Alpha Counter | 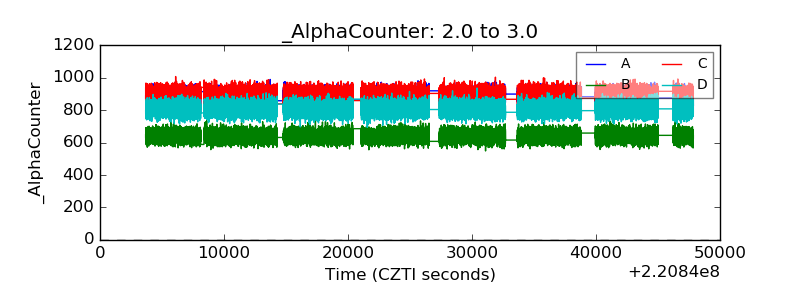 |
| _CPM_Rate | 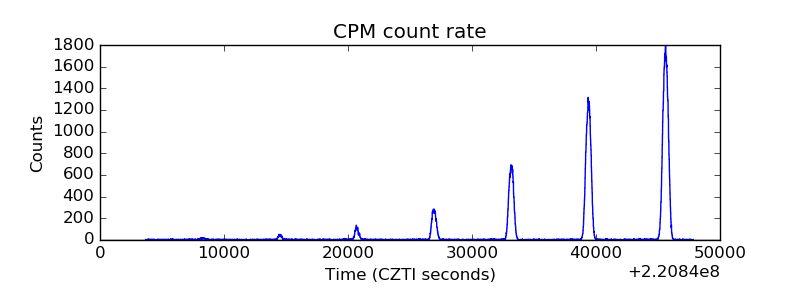 |
| CZT Counter | 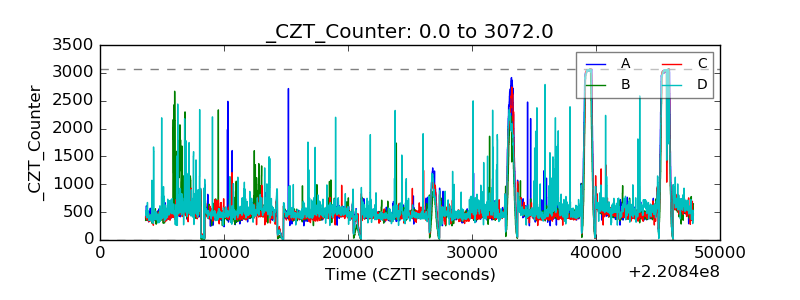 |
| +2.5 Volts monitor |  |
| +5 Volts monitor |  |
| _ROLL_ROT | 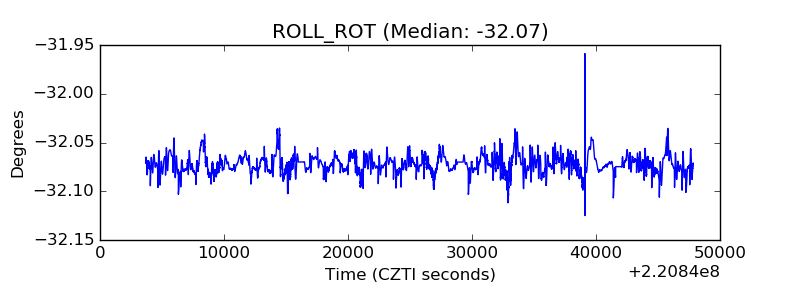 |
| _Roll_DEC | 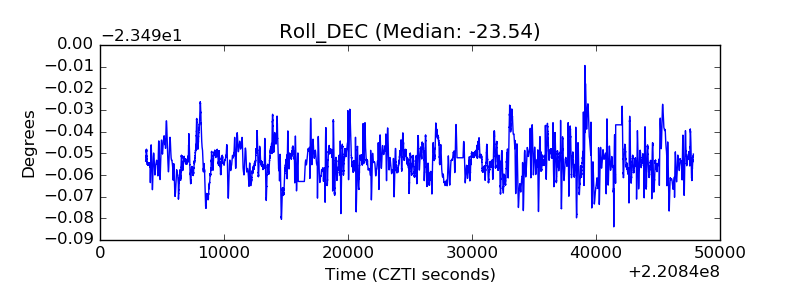 |
| _Roll_RA | 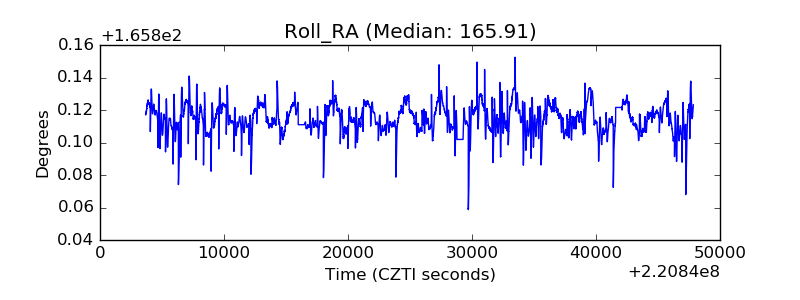 |
| Veto Counter | 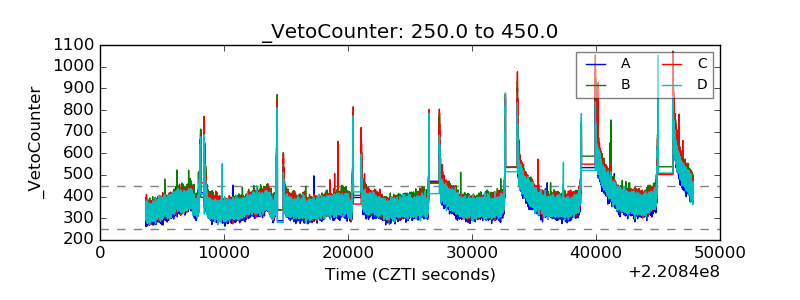 |