| Param | Original file | Final file |
|---|---|---|
| Filename | modeM0/AS1G06_086T02_9000000936_06816cztM0_level2.evt | modeM0/AS1G06_086T02_9000000936_06816cztM0_level2_quad_clean.evt |
| Size (bytes) | 458,614,080 | 62,262,720 |
| Size | 437.4 MB | 59.4 MB |
| Events in quadrant A | 3,239,129 | 367,900 |
| Events in quadrant B | 3,302,305 | 372,188 |
| Events in quadrant C | 3,294,405 | 364,045 |
| Events in quadrant D | 3,635,844 | 351,768 |
| Mode M9 | |||
|---|---|---|---|
| Quadrant | BADHDUFLAG | Total packets | Discarded packets |
| A | 0 | 13 | 0 |
| B | 0 | 13 | 0 |
| C | 0 | 13 | 0 |
| D | 0 | 13 | 0 |
| Mode M0 | |||
|---|---|---|---|
| Quadrant | BADHDUFLAG | Total packets | Discarded packets |
| A | 0 | 13465 | 2 |
| B | 0 | 13625 | 1 |
| C | 0 | 13628 | 1 |
| D | 0 | 15146 | 1 |
| Mode SS | |||
|---|---|---|---|
| Quadrant | BADHDUFLAG | Total packets | Discarded packets |
| A | 0 | 124 | 0 |
| B | 0 | 124 | 0 |
| C | 0 | 124 | 0 |
| D | 0 | 124 | 0 |
| Quadrant | Total seconds | Saturated seconds | Saturation percentage |
|---|---|---|---|
| A | 6150 | 91 | 1.479675% |
| B | 6150 | 136 | 2.211382% |
| C | 6150 | 93 | 1.512195% |
| D | 6150 | 173 | 2.813008% |
Noise dominated data is calculated using 1-second bins in cleaned event files. If a bin has >2000 counts, and if more than 50% of those come from <1% of pixels, then it is considered to be noise-dominated and hence unusable.
| Quadrant | # 1 sec bins | Bins with >0 counts | Bins with >2000 counts | High rate bins dominated by noise | Noise dominated (total time) | Noise dominated (detector-on time) | Marked lightcurve |
|---|---|---|---|---|---|---|---|
| A | 7425 | 6151 | 2 | 2 | 0.03% | 0.03% |  |
| B | 7425 | 6151 | 22 | 22 | 0.30% | 0.36% |  |
| C | 7425 | 6151 | 26 | 26 | 0.35% | 0.42% | 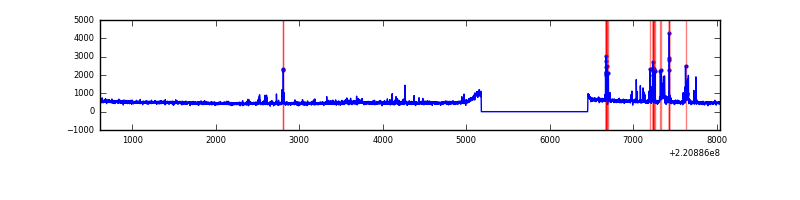 |
| D | 7425 | 6151 | 73 | 73 | 0.98% | 1.19% |  |
Top three noisy pixels from each quadrant. If the there are fewer than three noisy pixels in the level2.evt file, extra rows are filled as -1
| Pixel properties | Quadrant properties | ||||||
|---|---|---|---|---|---|---|---|
| Quadrant | DetID | PixID | Counts | Sigma | Mean | Median | Sigma |
| A | 8 | 15 | 157040 | 964.13 | 796 | 780 | 162.1 |
| A | 13 | 248 | 15555 | 91.16 | 796 | 780 | 162.1 |
| A | 0 | 226 | 7780 | 43.19 | 796 | 780 | 162.1 |
| B | 4 | 81 | 134346 | 887.36 | 797 | 780 | 150.5 |
| B | 0 | 214 | 39152 | 254.93 | 797 | 780 | 150.5 |
| B | 0 | 228 | 32915 | 213.49 | 797 | 780 | 150.5 |
| C | 12 | 16 | 215408 | 1211.37 | 766 | 773 | 177.2 |
| C | 9 | 247 | 73223 | 408.9 | 766 | 773 | 177.2 |
| C | 10 | 22 | 10953 | 57.45 | 766 | 773 | 177.2 |
| D | 8 | 195 | 337909 | 1816.21 | 761 | 738 | 185.6 |
| D | 14 | 34 | 286981 | 1541.88 | 761 | 738 | 185.6 |
| D | 2 | 216 | 68402 | 364.48 | 761 | 738 | 185.6 |
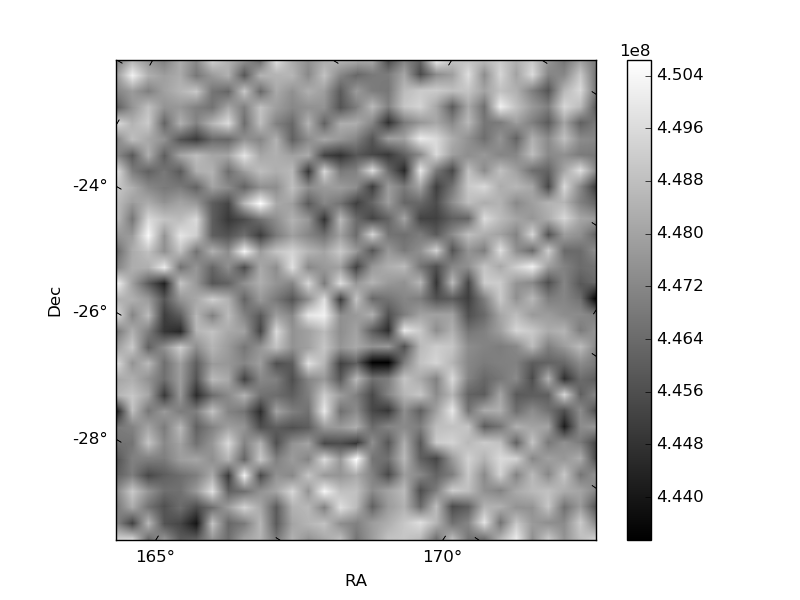
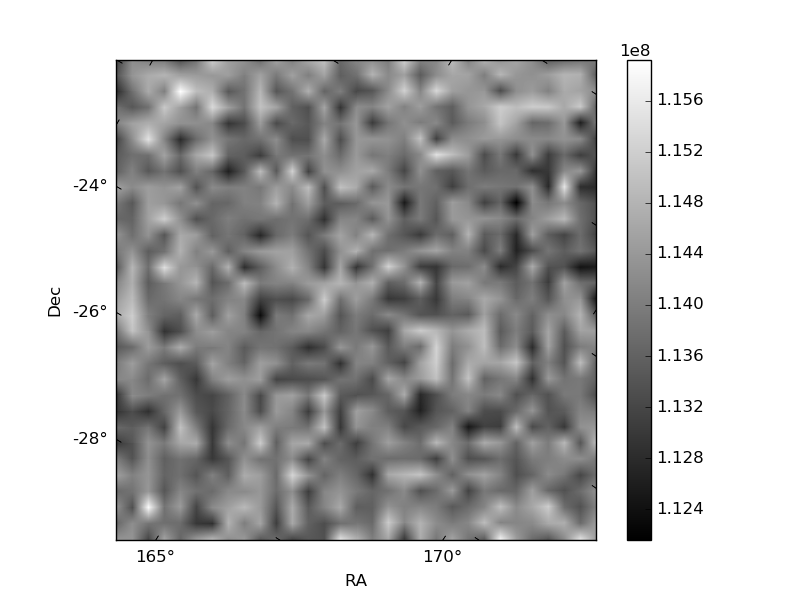
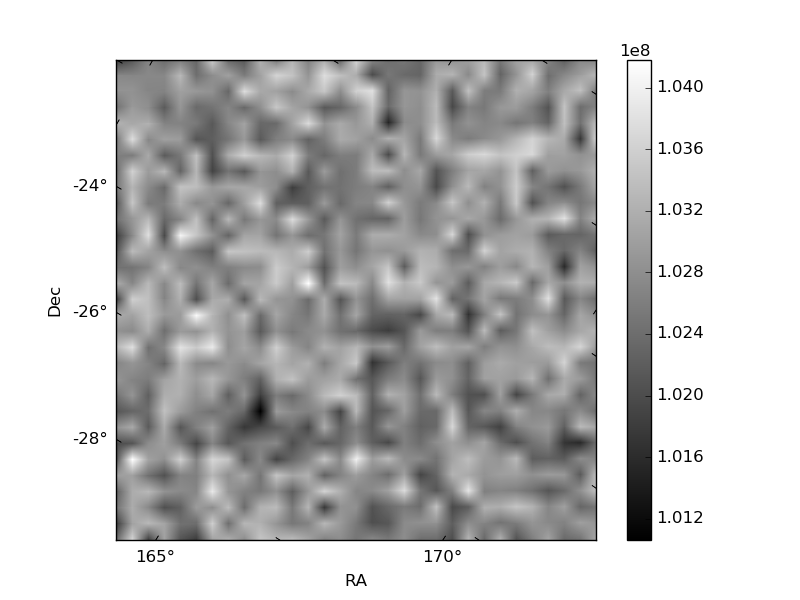
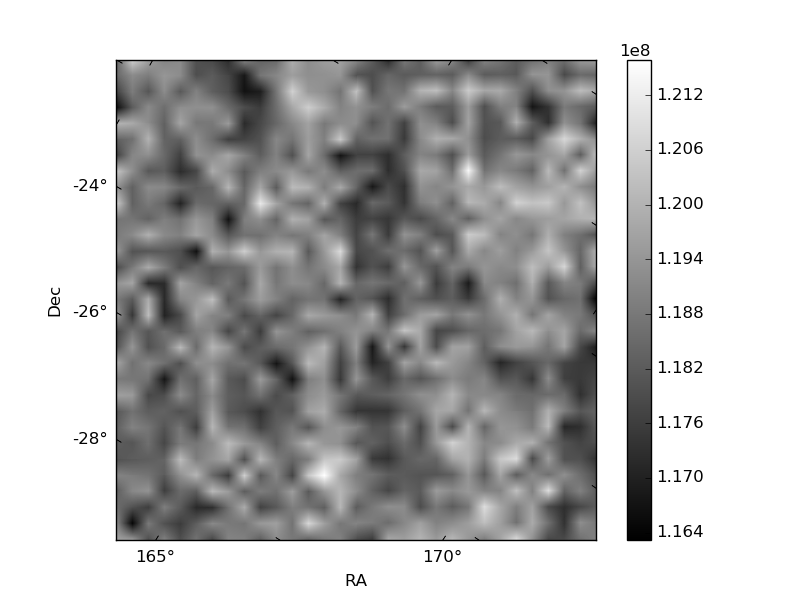
Histogram calculated using DETX and DETY for each event in the final _common_clean file
| Quadrant A | 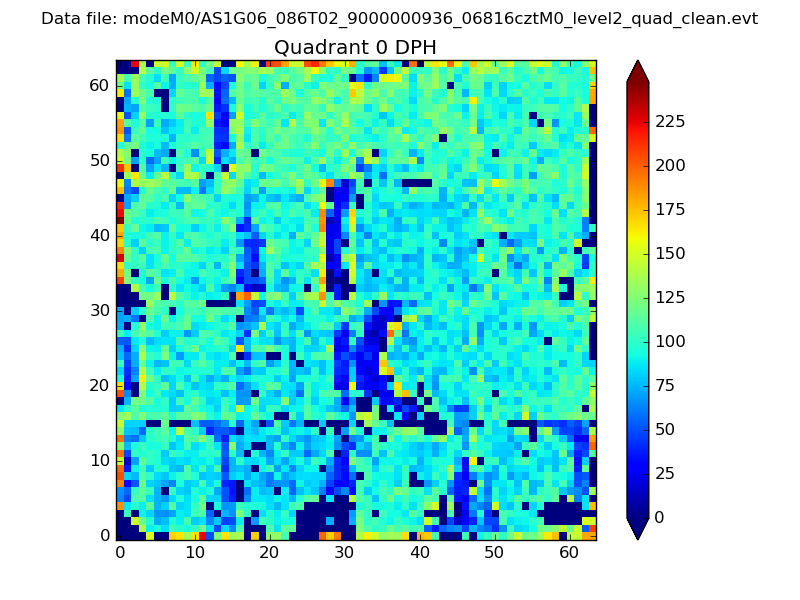 |
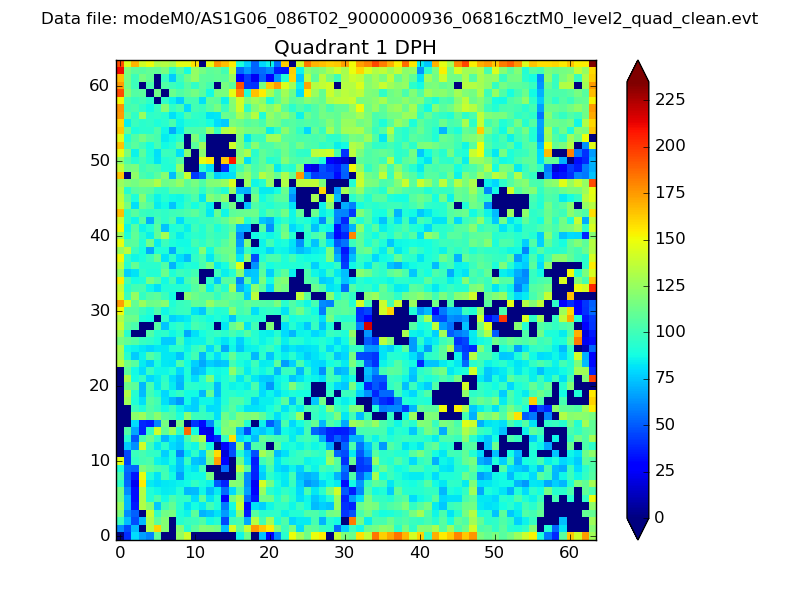 |
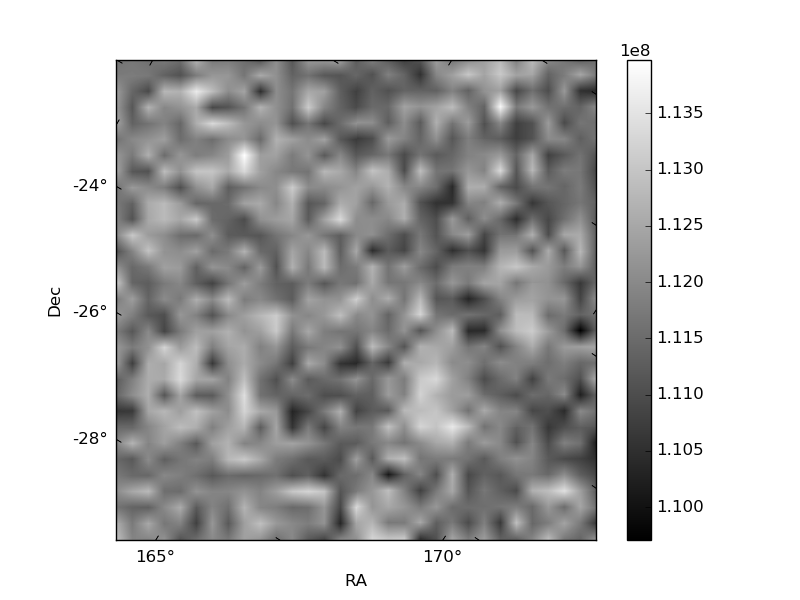
Quadrant B |
|---|---|---|---|
| Quadrant D |  |
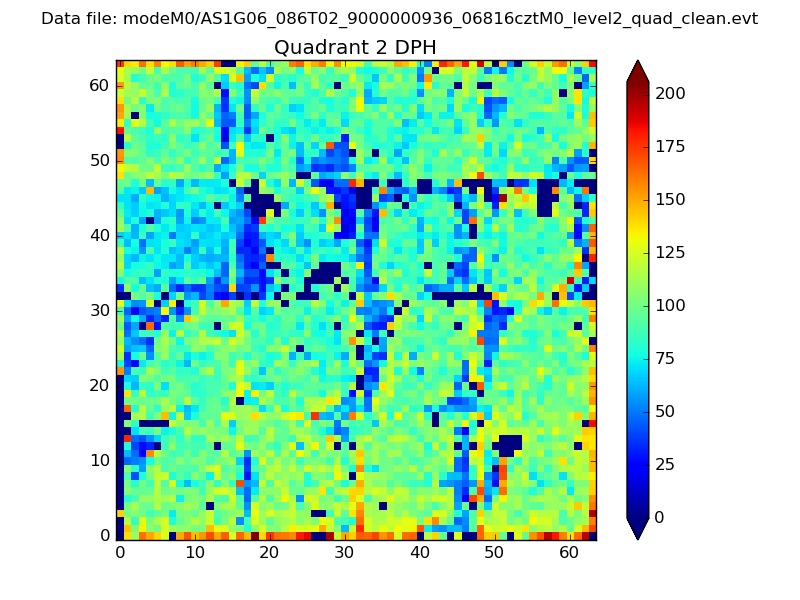 |
Quadrant C |
| Plot type | Count rate plots | Images |
|---|---|---|
| Comparison with Poisson distribution Blue bars denote a histogram of data divided into 1 sec bins. Red curve is a Poisson curve with rate = median count rate of data. |
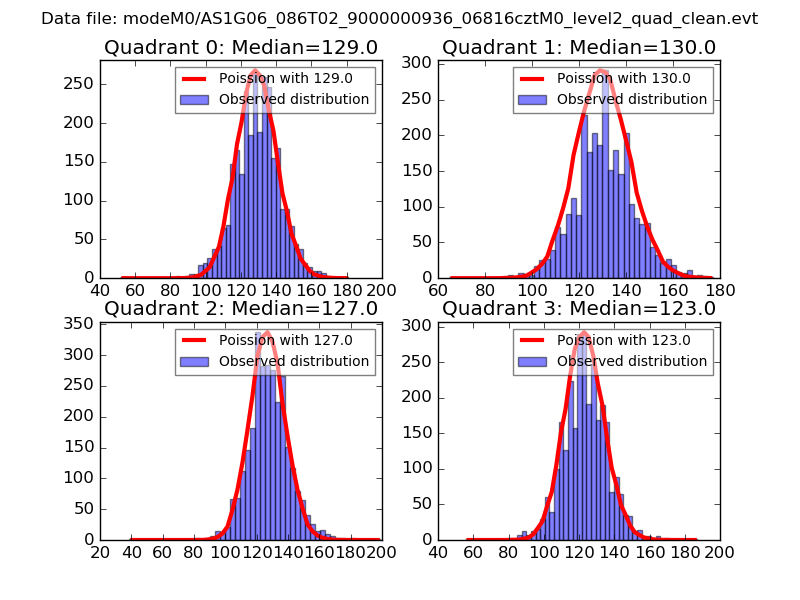 |
 |
| Quadrant-wise count rates Data is divided into 100 sec bins |
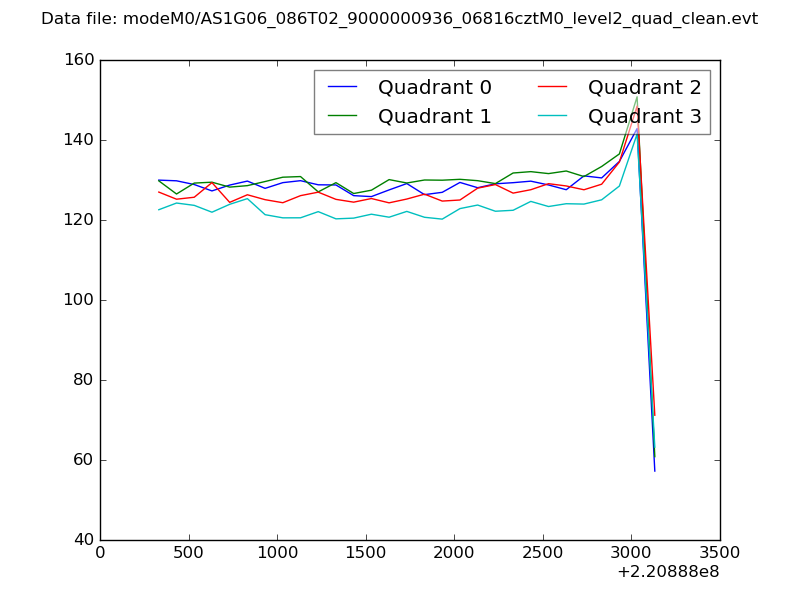 |
|
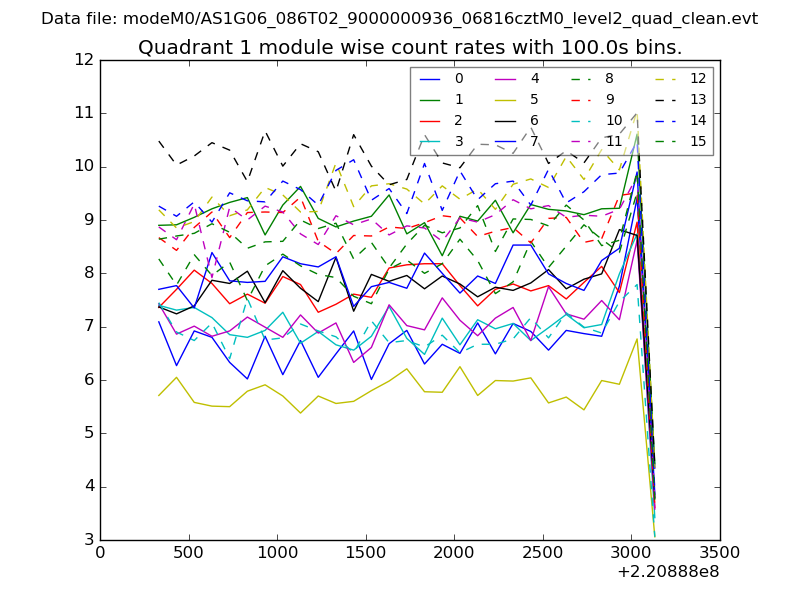
| Module-wise count rates for Quadrant A Data is divided into 100 sec bins |
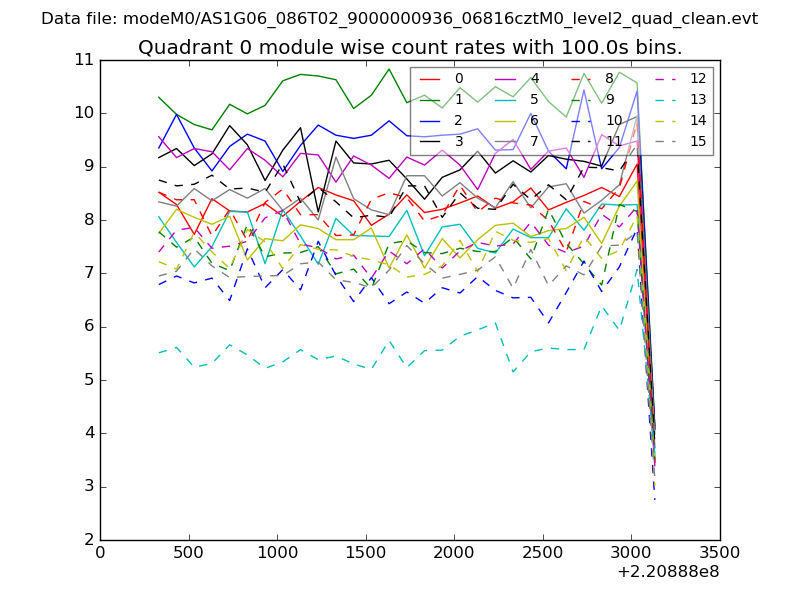 |
 |
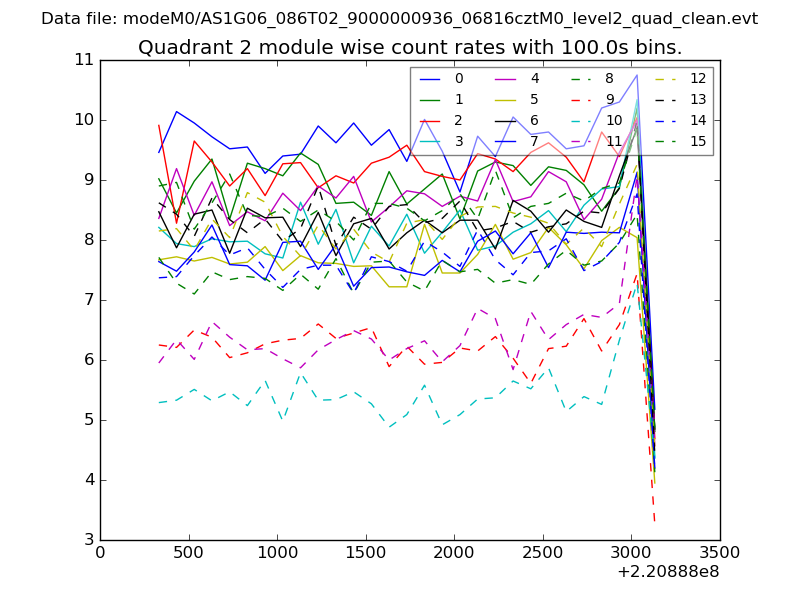
| Module-wise count rates for Quadrant B Data is divided into 100 sec bins |
 |
 |
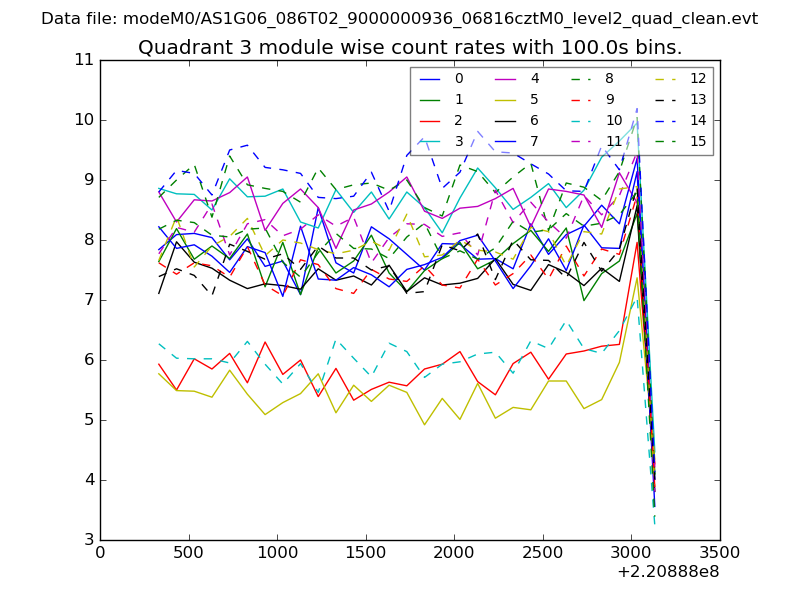
| Module-wise count rates for Quadrant C Data is divided into 100 sec bins |
 |
 |
| Module-wise count rates for Quadrant D Data is divided into 100 sec bins |
 |
 |
| Parameter | Plot |
|---|---|
| CZT HV Monitor |  |
| D_VDD | 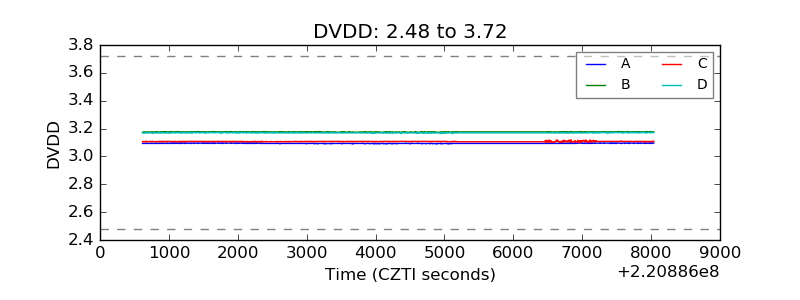 |
| Temperature 1 | 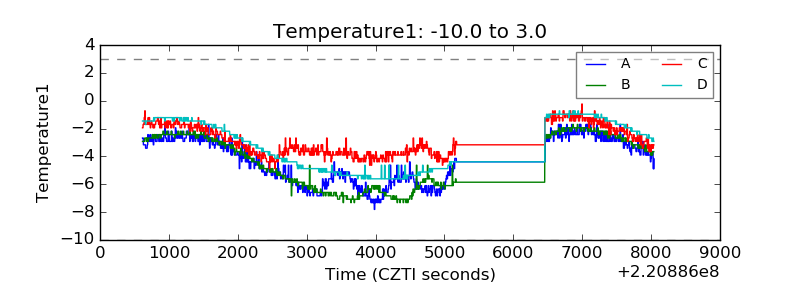 |
| Veto HV Monitor | 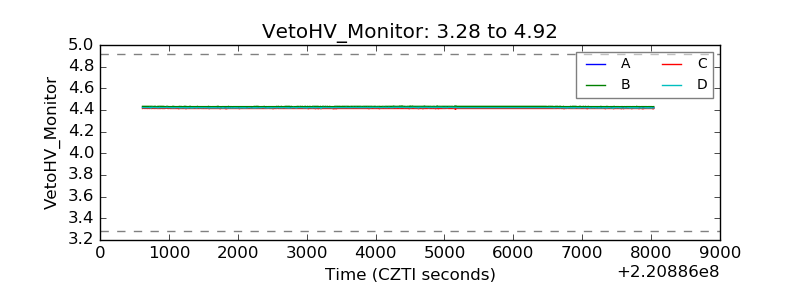 |
| Veto LLD |  |
| Alpha Counter | 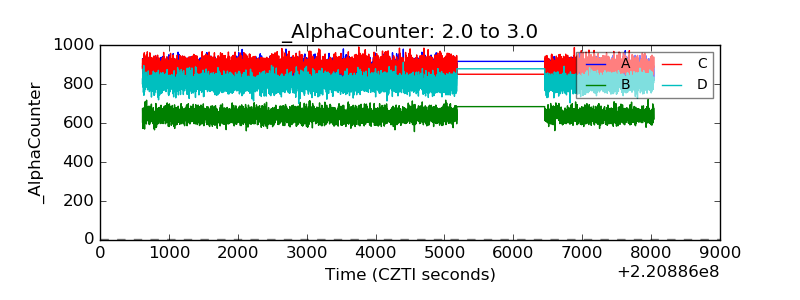 |
| _CPM_Rate | 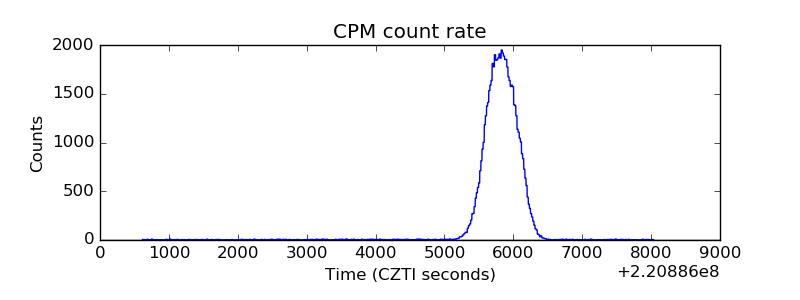 |
| CZT Counter | 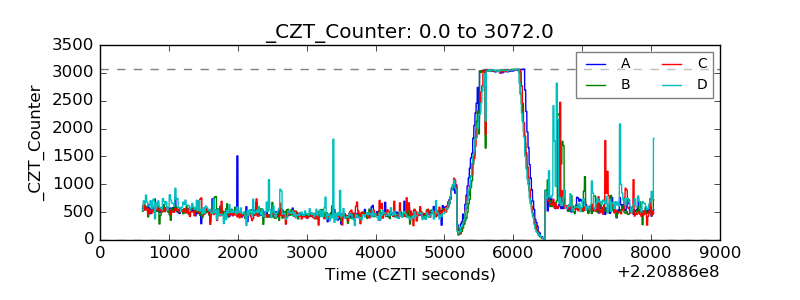 |
| +2.5 Volts monitor |  |
| +5 Volts monitor |  |
| _ROLL_ROT | 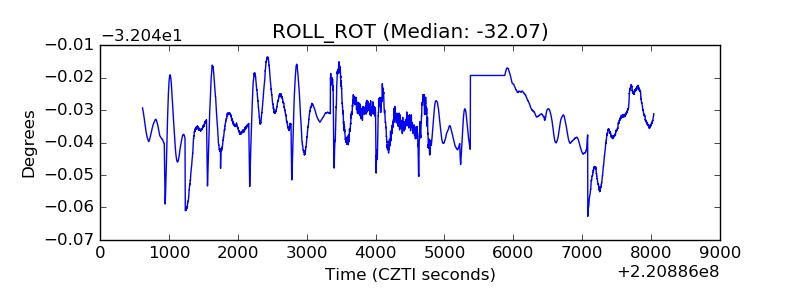 |
| _Roll_DEC | 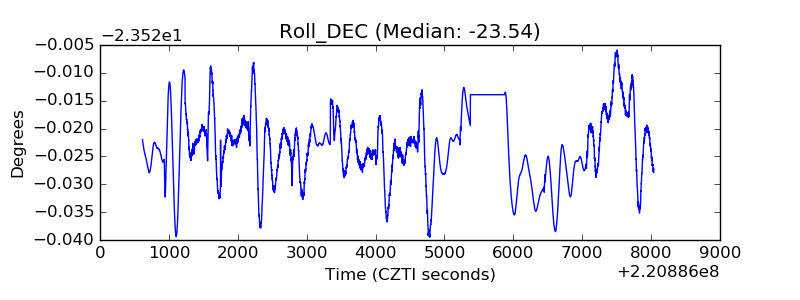 |
| _Roll_RA | 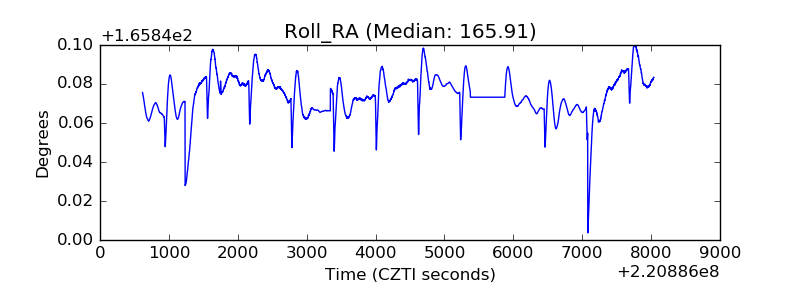 |
| Veto Counter | 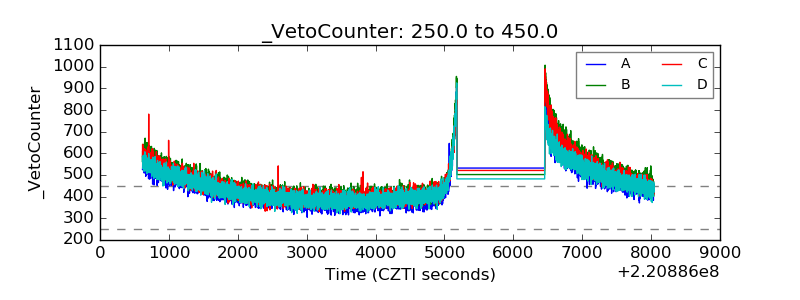 |