| Param | Original file | Final file |
|---|---|---|
| Filename | modeM0/AS1G06_086T02_9000000936_06817cztM0_level2.evt | modeM0/AS1G06_086T02_9000000936_06817cztM0_level2_quad_clean.evt |
| Size (bytes) | 512,593,920 | 72,907,200 |
| Size | 488.8 MB | 69.5 MB |
| Events in quadrant A | 3,506,245 | 446,089 |
| Events in quadrant B | 3,803,709 | 450,443 |
| Events in quadrant C | 3,548,602 | 440,850 |
| Events in quadrant D | 4,228,038 | 420,432 |
| Mode M9 | |||
|---|---|---|---|
| Quadrant | BADHDUFLAG | Total packets | Discarded packets |
| A | 0 | 19 | 0 |
| B | 0 | 19 | 0 |
| C | 0 | 19 | 0 |
| D | 0 | 20 | 0 |
| Mode M0 | |||
|---|---|---|---|
| Quadrant | BADHDUFLAG | Total packets | Discarded packets |
| A | 0 | 14544 | 2 |
| B | 0 | 15484 | 1 |
| C | 0 | 14718 | 1 |
| D | 0 | 16849 | 1 |
| Mode SS | |||
|---|---|---|---|
| Quadrant | BADHDUFLAG | Total packets | Discarded packets |
| A | 0 | 130 | 0 |
| B | 0 | 130 | 0 |
| C | 0 | 130 | 0 |
| D | 0 | 130 | 0 |
| Quadrant | Total seconds | Saturated seconds | Saturation percentage |
|---|---|---|---|
| A | 6449 | 156 | 2.418980% |
| B | 6449 | 185 | 2.868662% |
| C | 6449 | 96 | 1.488603% |
| D | 6449 | 218 | 3.380369% |
Noise dominated data is calculated using 1-second bins in cleaned event files. If a bin has >2000 counts, and if more than 50% of those come from <1% of pixels, then it is considered to be noise-dominated and hence unusable.
| Quadrant | # 1 sec bins | Bins with >0 counts | Bins with >2000 counts | High rate bins dominated by noise | Noise dominated (total time) | Noise dominated (detector-on time) | Marked lightcurve |
|---|---|---|---|---|---|---|---|
| A | 7759 | 6450 | 33 | 33 | 0.43% | 0.51% |  |
| B | 7759 | 6450 | 41 | 41 | 0.53% | 0.64% |  |
| C | 7759 | 6450 | 26 | 26 | 0.34% | 0.40% | 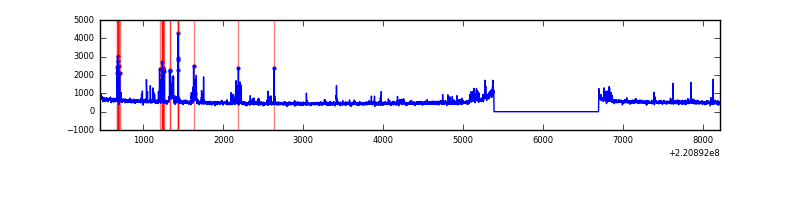 |
| D | 7759 | 6450 | 127 | 127 | 1.64% | 1.97% | 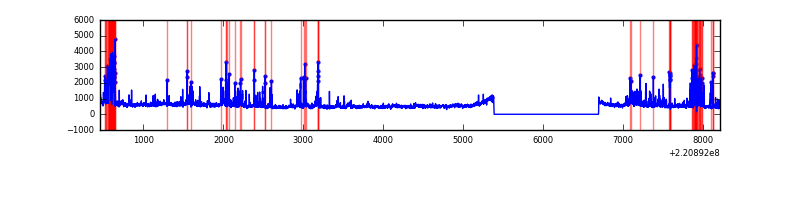 |
Top three noisy pixels from each quadrant. If the there are fewer than three noisy pixels in the level2.evt file, extra rows are filled as -1
| Pixel properties | Quadrant properties | ||||||
|---|---|---|---|---|---|---|---|
| Quadrant | DetID | PixID | Counts | Sigma | Mean | Median | Sigma |
| A | 14 | 111 | 117971 | 684.71 | 842 | 826 | 171.1 |
| A | 8 | 15 | 113103 | 656.26 | 842 | 826 | 171.1 |
| A | 8 | 4 | 15222 | 84.14 | 842 | 826 | 171.1 |
| B | 0 | 228 | 244107 | 1514.63 | 847 | 829 | 160.6 |
| B | 4 | 81 | 153709 | 951.82 | 847 | 829 | 160.6 |
| B | 15 | 204 | 81053 | 499.47 | 847 | 829 | 160.6 |
| C | 12 | 16 | 346222 | 1845.24 | 811 | 818 | 187.2 |
| C | 9 | 247 | 33174 | 172.85 | 811 | 818 | 187.2 |
| C | 13 | 61 | 6362 | 29.62 | 811 | 818 | 187.2 |
| D | 14 | 34 | 635930 | 3233.27 | 801 | 777 | 196.4 |
| D | 8 | 195 | 409871 | 2082.51 | 801 | 777 | 196.4 |
| D | 2 | 216 | 70485 | 354.85 | 801 | 777 | 196.4 |
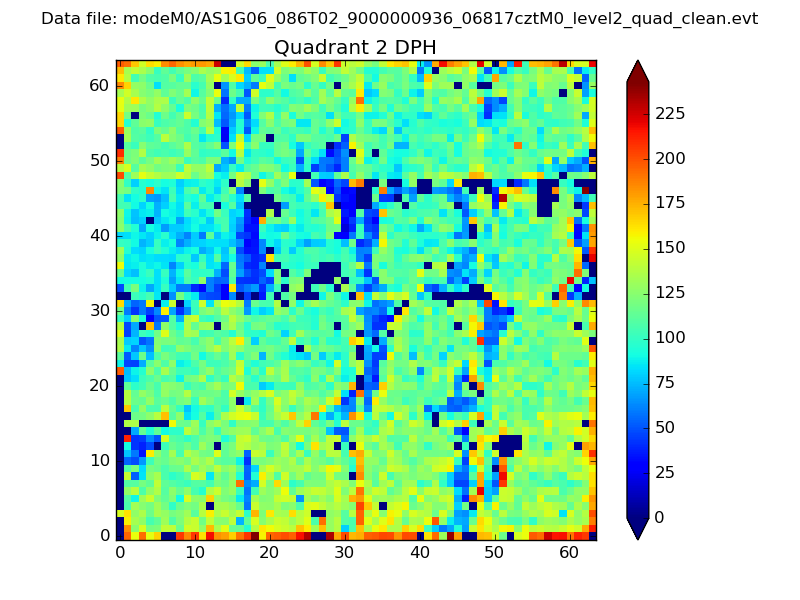
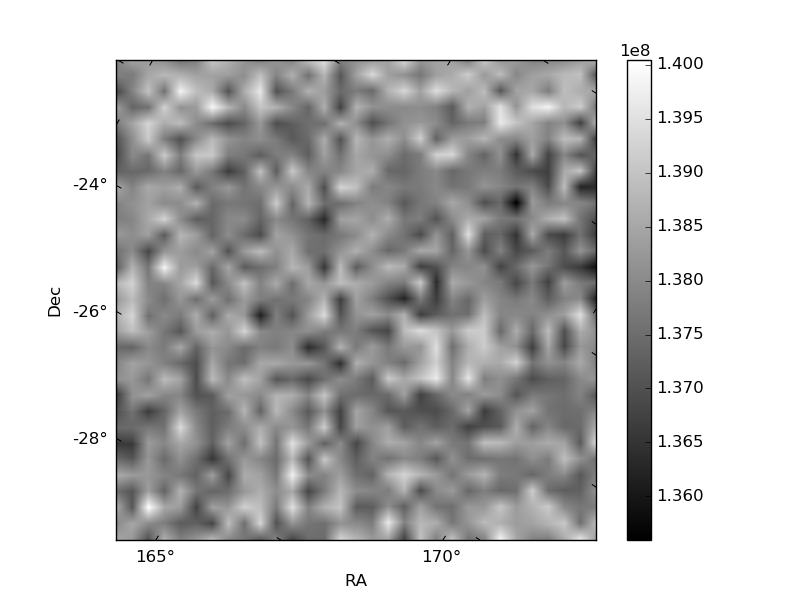
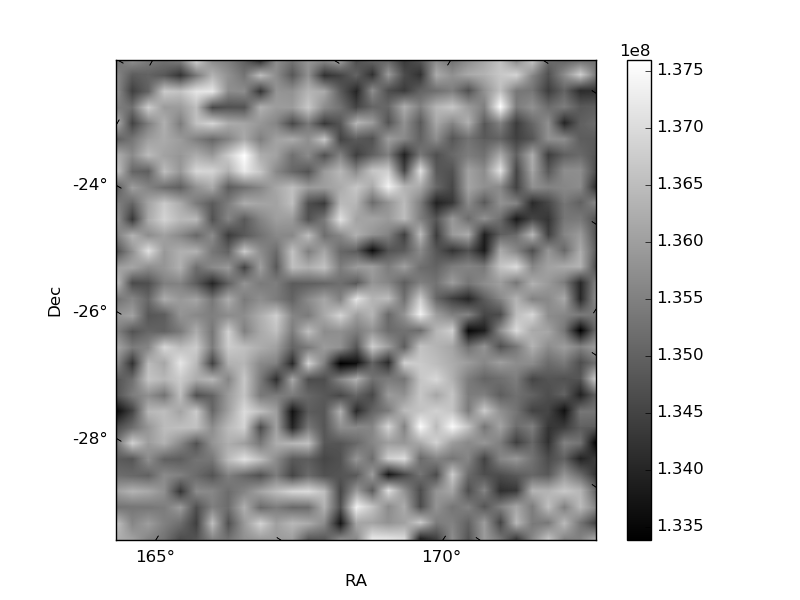
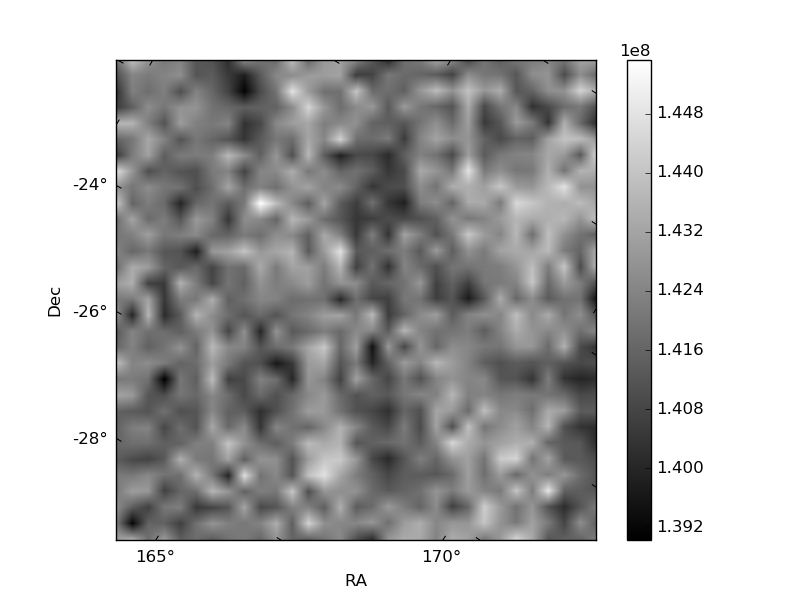
Histogram calculated using DETX and DETY for each event in the final _common_clean file
| Quadrant A | 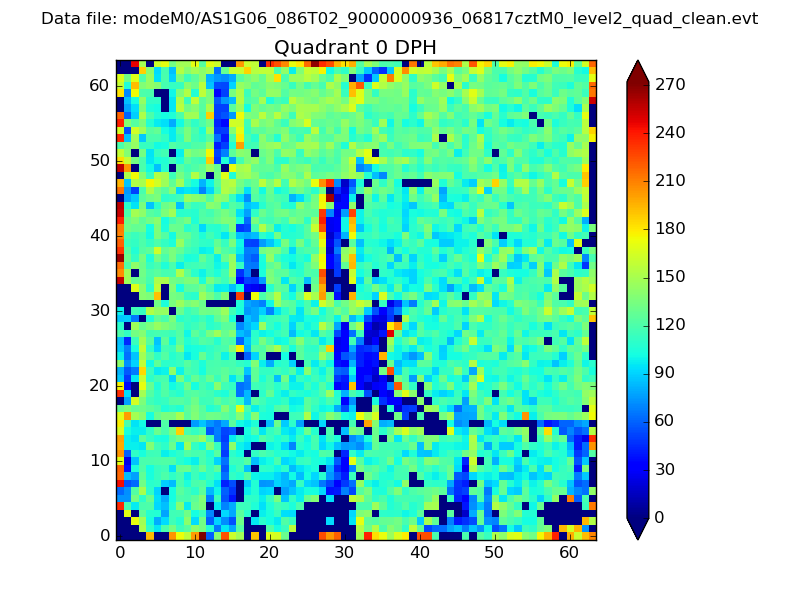 |
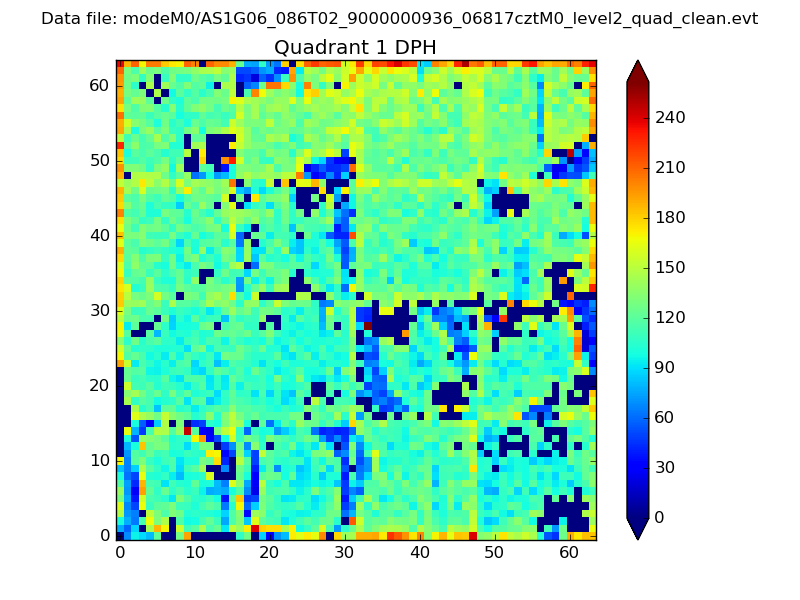 |
Quadrant B |
|---|---|---|---|
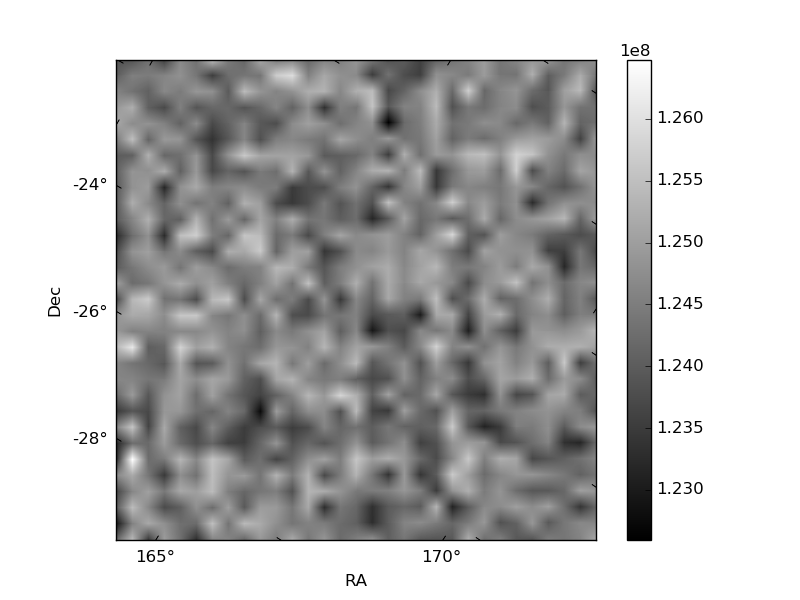
| Quadrant D | 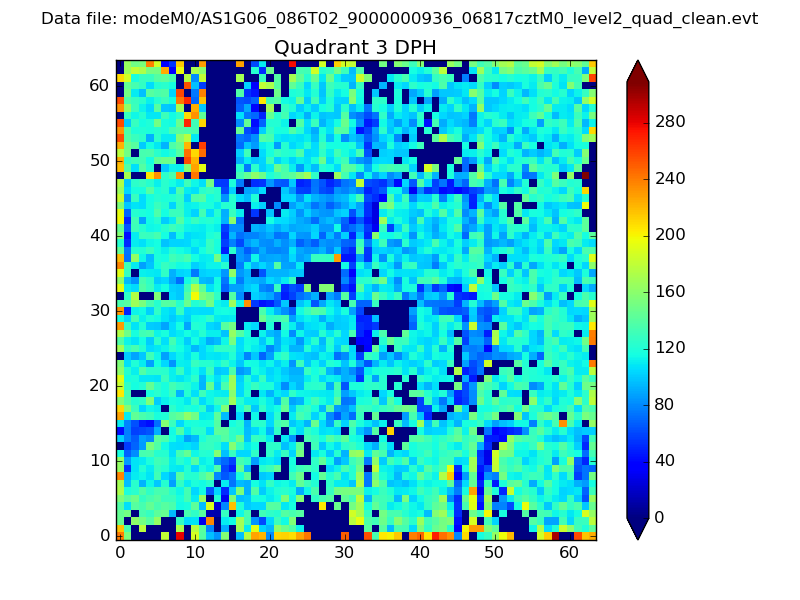 |
 |
Quadrant C |
| Plot type | Count rate plots | Images |
|---|---|---|
| Comparison with Poisson distribution Blue bars denote a histogram of data divided into 1 sec bins. Red curve is a Poisson curve with rate = median count rate of data. |
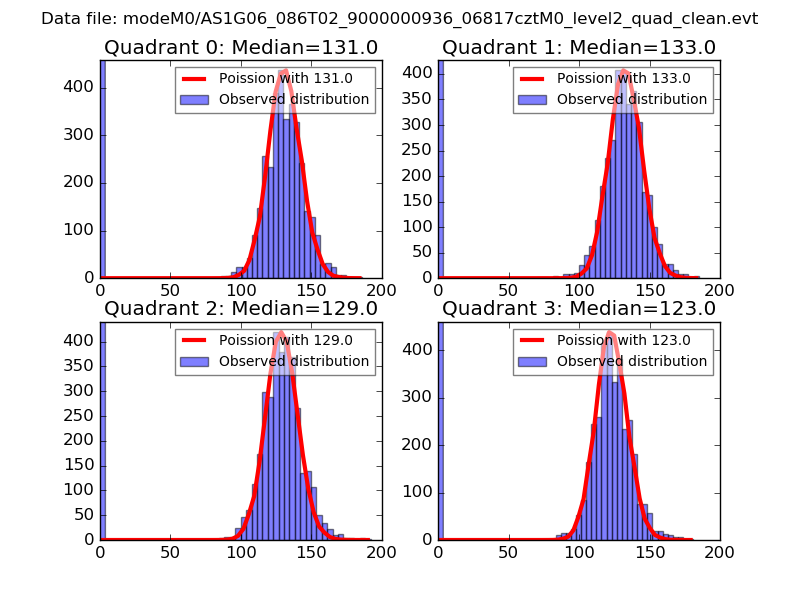 |
 |
| Quadrant-wise count rates Data is divided into 100 sec bins |
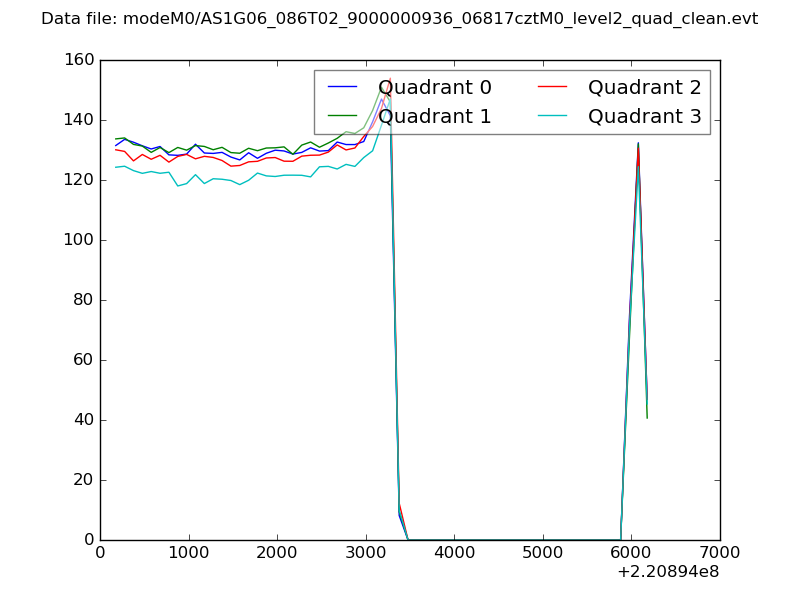 |
|
| Module-wise count rates for Quadrant A Data is divided into 100 sec bins |
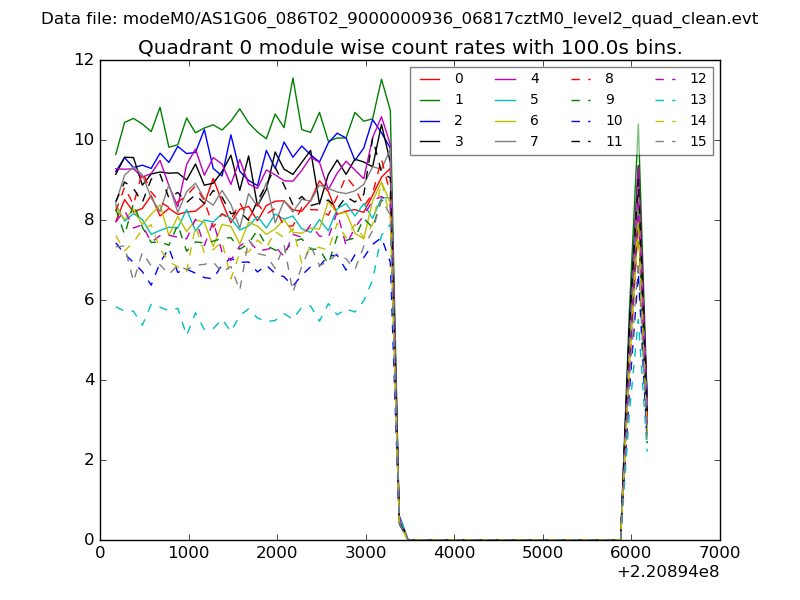 |
 |
| Module-wise count rates for Quadrant B Data is divided into 100 sec bins |
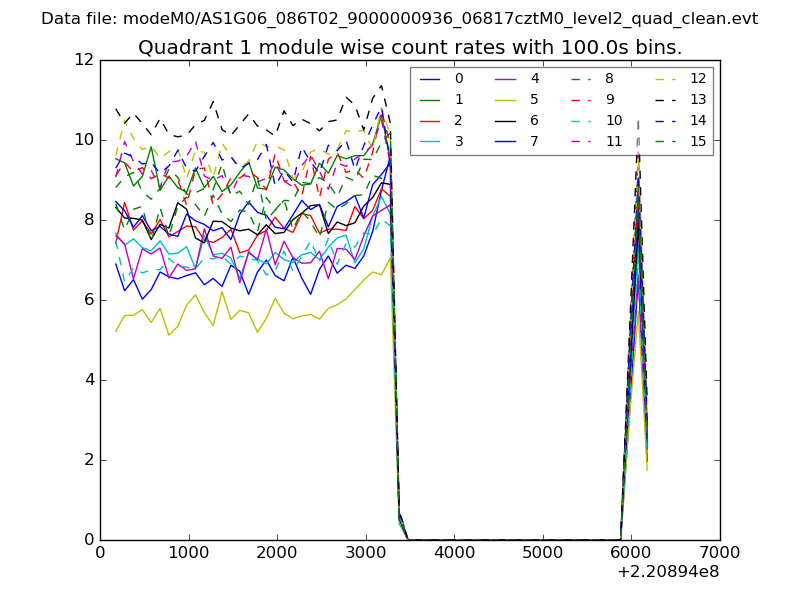 |
 |
| Module-wise count rates for Quadrant C Data is divided into 100 sec bins |
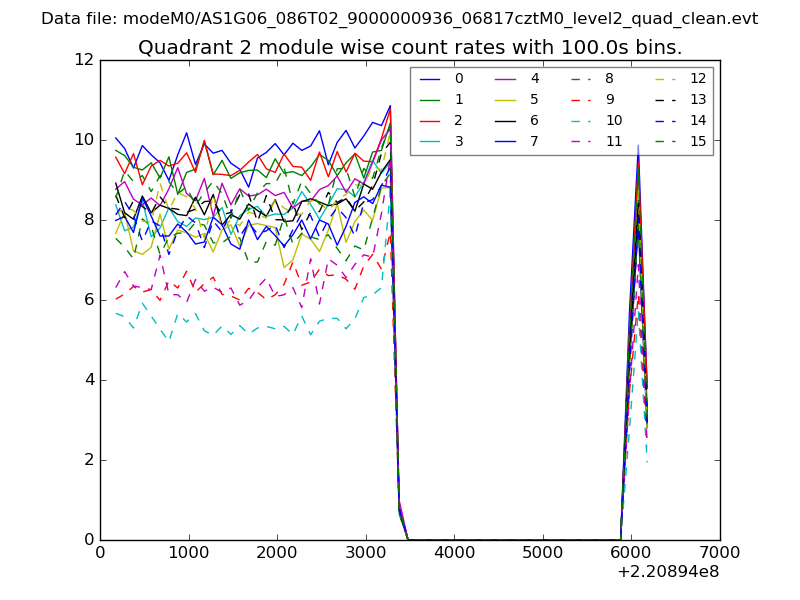 |
 |
| Module-wise count rates for Quadrant D Data is divided into 100 sec bins |
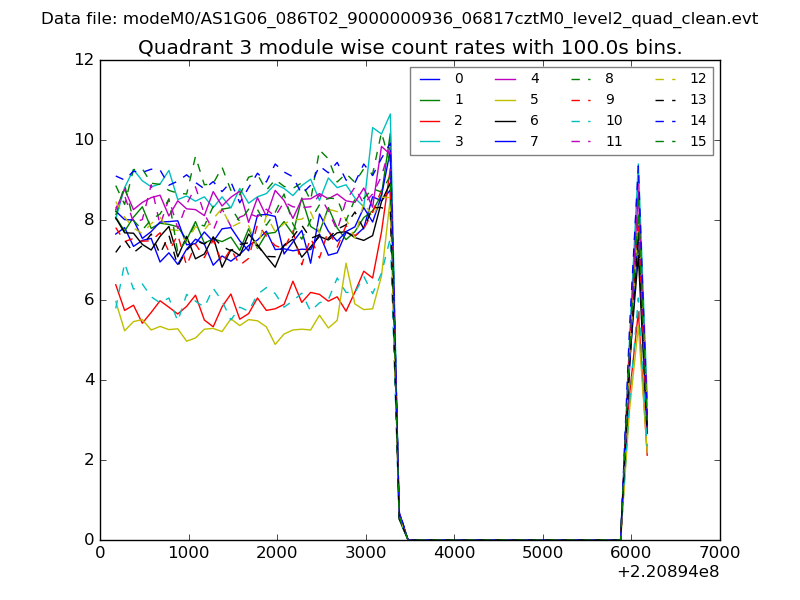 |
 |
| Parameter | Plot |
|---|---|
| CZT HV Monitor | 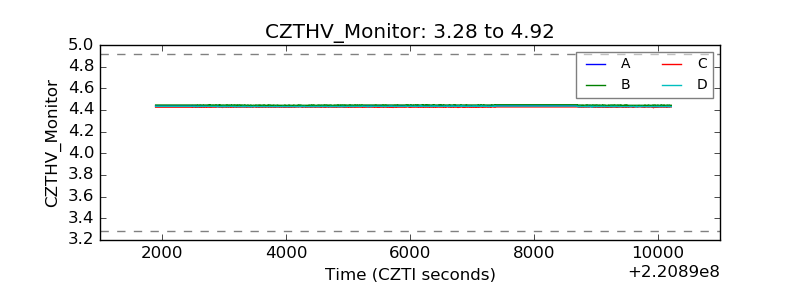 |
| D_VDD | 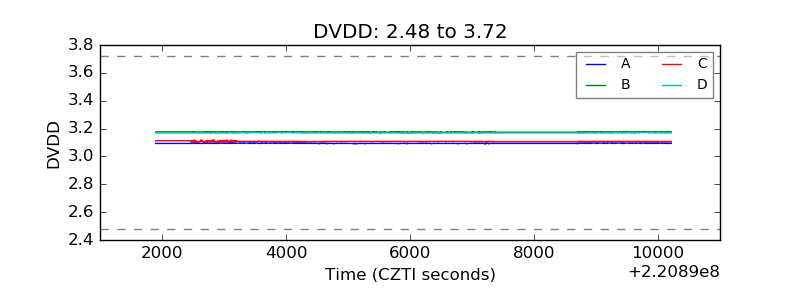 |
| Temperature 1 | 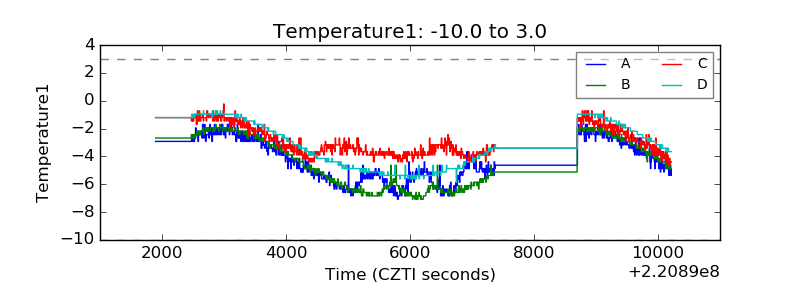 |
| Veto HV Monitor | 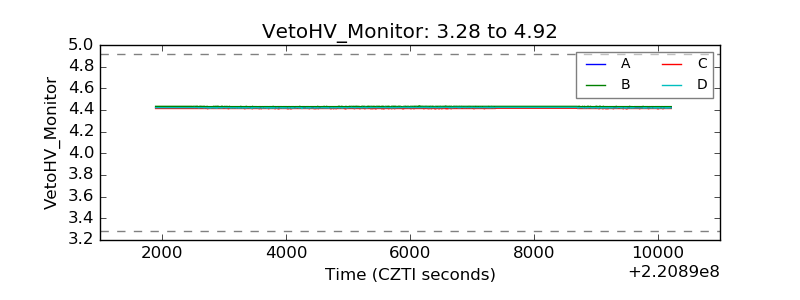 |
| Veto LLD |  |
| Alpha Counter | 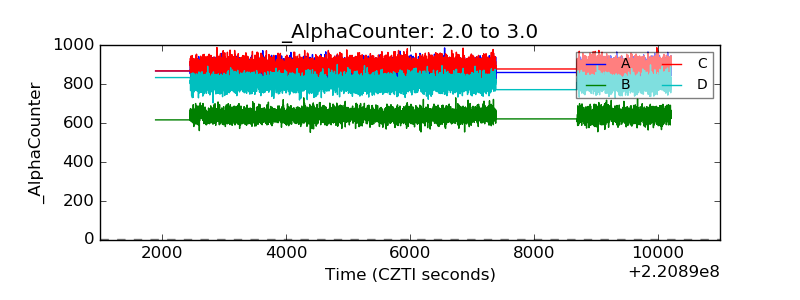 |
| _CPM_Rate | 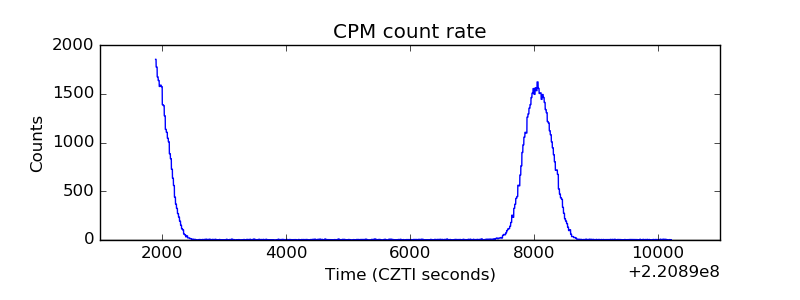 |
| CZT Counter | 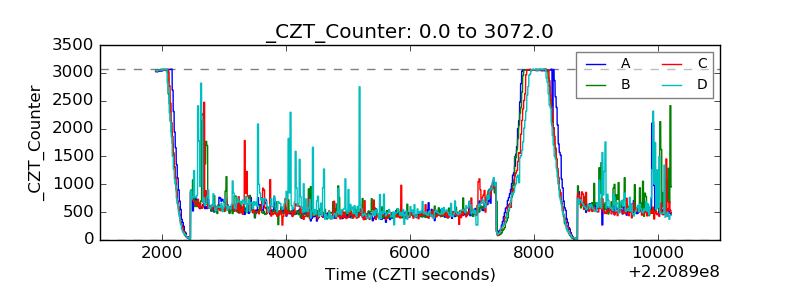 |
| +2.5 Volts monitor |  |
| +5 Volts monitor |  |
| _ROLL_ROT | 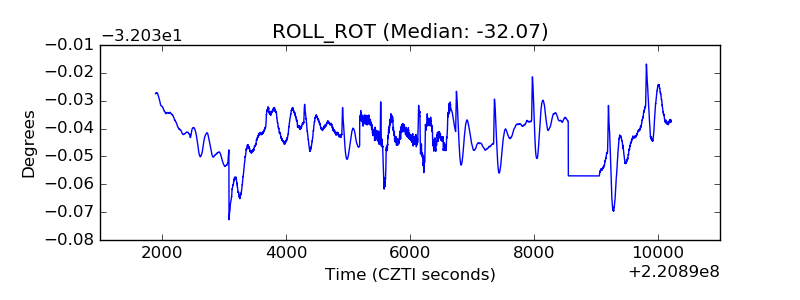 |
| _Roll_DEC | 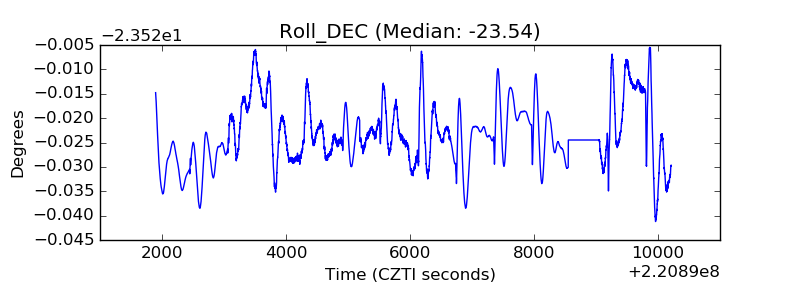 |
| _Roll_RA | 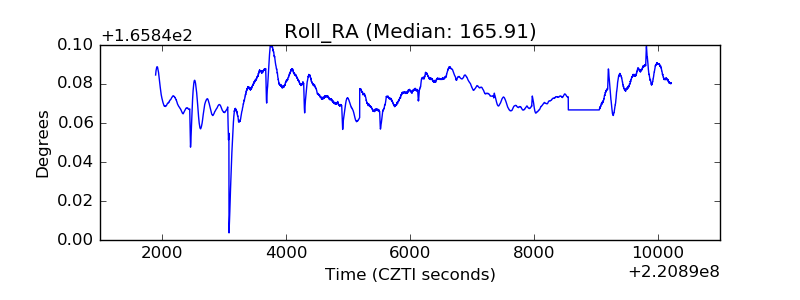 |
| Veto Counter | 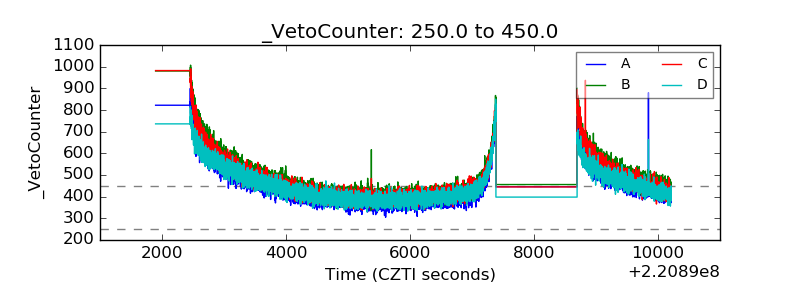 |