| Param | Original file | Final file |
|---|---|---|
| Filename | modeM0/AS1G06_086T02_9000000936_06819cztM0_level2.evt | modeM0/AS1G06_086T02_9000000936_06819cztM0_level2_quad_clean.evt |
| Size (bytes) | 255,960,000 | 52,856,640 |
| Size | 244.1 MB | 50.4 MB |
| Events in quadrant A | 1,745,742 | 339,520 |
| Events in quadrant B | 1,773,315 | 344,355 |
| Events in quadrant C | 1,735,713 | 334,933 |
| Events in quadrant D | 2,239,713 | 315,864 |
| Mode M9 | |||
|---|---|---|---|
| Quadrant | BADHDUFLAG | Total packets | Discarded packets |
| A | 0 | 13 | 0 |
| B | 0 | 13 | 0 |
| C | 0 | 13 | 0 |
| D | 0 | 13 | 0 |
| Mode M0 | |||
|---|---|---|---|
| Quadrant | BADHDUFLAG | Total packets | Discarded packets |
| A | 0 | 7808 | 1 |
| B | 0 | 7862 | 1 |
| C | 0 | 7815 | 1 |
| D | 0 | 9395 | 1 |
| Mode SS | |||
|---|---|---|---|
| Quadrant | BADHDUFLAG | Total packets | Discarded packets |
| A | 0 | 76 | 0 |
| B | 0 | 76 | 0 |
| C | 0 | 76 | 0 |
| D | 0 | 76 | 0 |
| Quadrant | Total seconds | Saturated seconds | Saturation percentage |
|---|---|---|---|
| A | 3761 | 32 | 0.850838% |
| B | 3761 | 48 | 1.276256% |
| C | 3761 | 17 | 0.452007% |
| D | 3761 | 149 | 3.961712% |
Noise dominated data is calculated using 1-second bins in cleaned event files. If a bin has >2000 counts, and if more than 50% of those come from <1% of pixels, then it is considered to be noise-dominated and hence unusable.
| Quadrant | # 1 sec bins | Bins with >0 counts | Bins with >2000 counts | High rate bins dominated by noise | Noise dominated (total time) | Noise dominated (detector-on time) | Marked lightcurve |
|---|---|---|---|---|---|---|---|
| A | 5011 | 3762 | 0 | 0 | 0.00% | 0.00% |  |
| B | 5011 | 3762 | 0 | 0 | 0.00% | 0.00% | 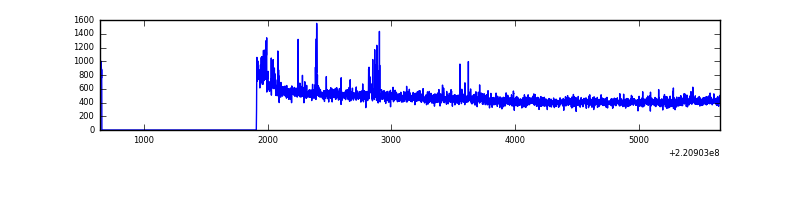 |
| C | 5011 | 3762 | 0 | 0 | 0.00% | 0.00% |  |
| D | 5011 | 3762 | 119 | 119 | 2.37% | 3.16% |  |
Top three noisy pixels from each quadrant. If the there are fewer than three noisy pixels in the level2.evt file, extra rows are filled as -1
| Pixel properties | Quadrant properties | ||||||
|---|---|---|---|---|---|---|---|
| Quadrant | DetID | PixID | Counts | Sigma | Mean | Median | Sigma |
| A | 8 | 15 | 55540 | 612.64 | 435 | 425 | 90.0 |
| A | 13 | 248 | 8287 | 87.39 | 435 | 425 | 90.0 |
| A | 15 | 234 | 4274 | 42.78 | 435 | 425 | 90.0 |
| B | 0 | 228 | 44211 | 517.87 | 441 | 432 | 84.5 |
| B | 12 | 111 | 8371 | 93.91 | 441 | 432 | 84.5 |
| B | 11 | 111 | 6538 | 72.23 | 441 | 432 | 84.5 |
| C | 9 | 247 | 42279 | 421.96 | 422 | 425 | 99.2 |
| C | 12 | 16 | 40523 | 404.26 | 422 | 425 | 99.2 |
| C | 13 | 61 | 3383 | 29.82 | 422 | 425 | 99.2 |
| D | 14 | 34 | 463758 | 4531.08 | 413 | 400 | 102.3 |
| D | 2 | 216 | 108113 | 1053.3 | 413 | 400 | 102.3 |
| D | 8 | 195 | 57599 | 559.34 | 413 | 400 | 102.3 |
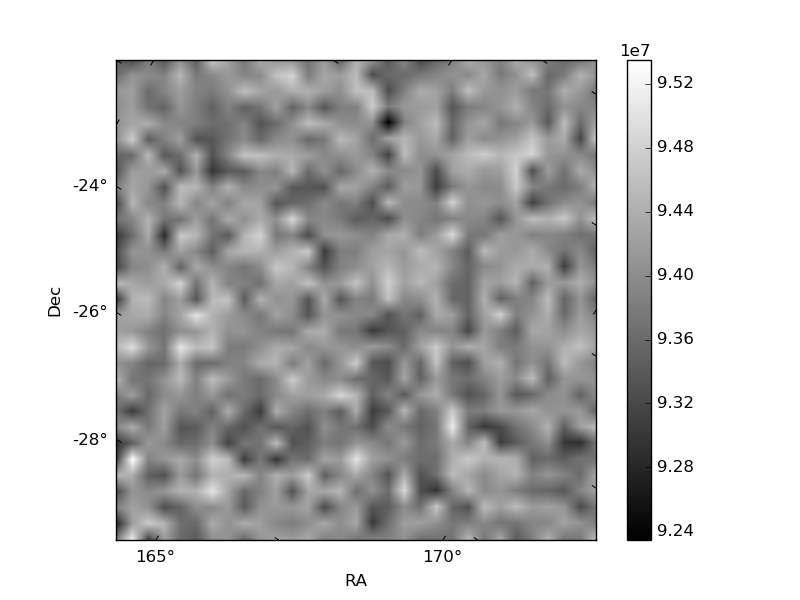
Histogram calculated using DETX and DETY for each event in the final _common_clean file
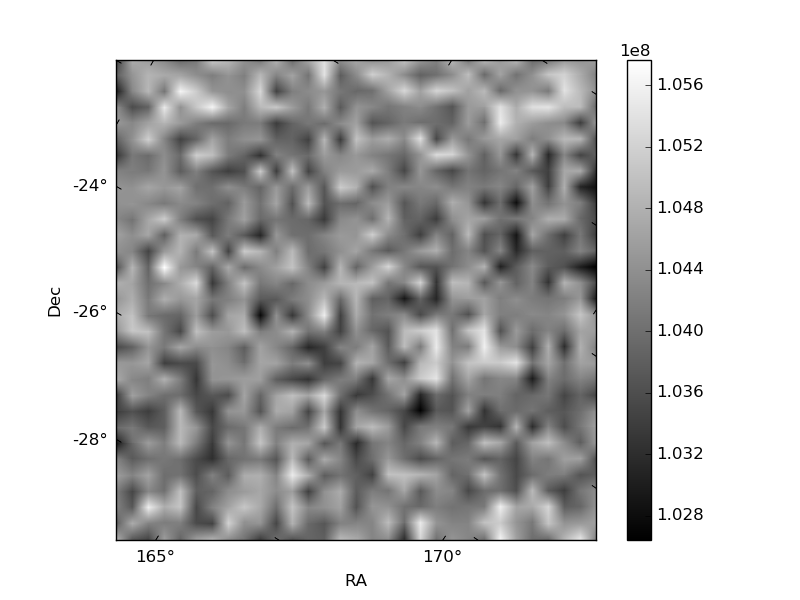
| Quadrant A | 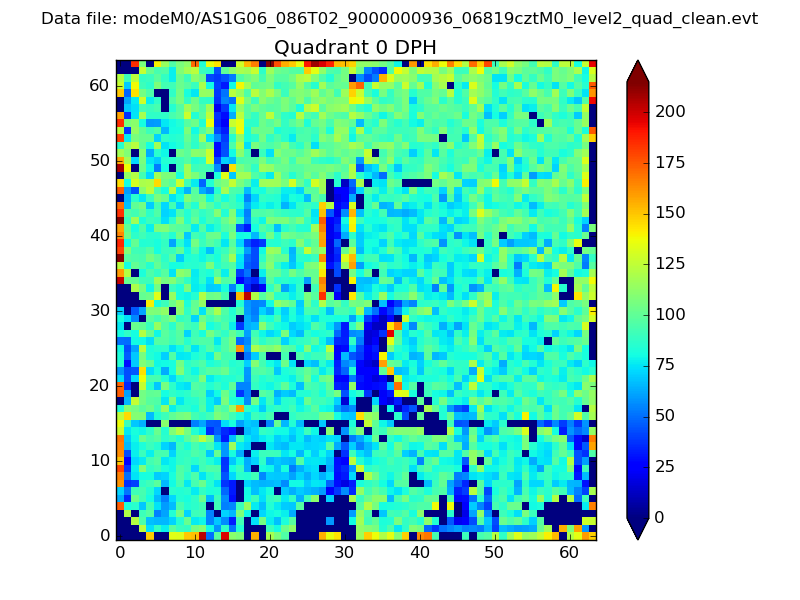 |
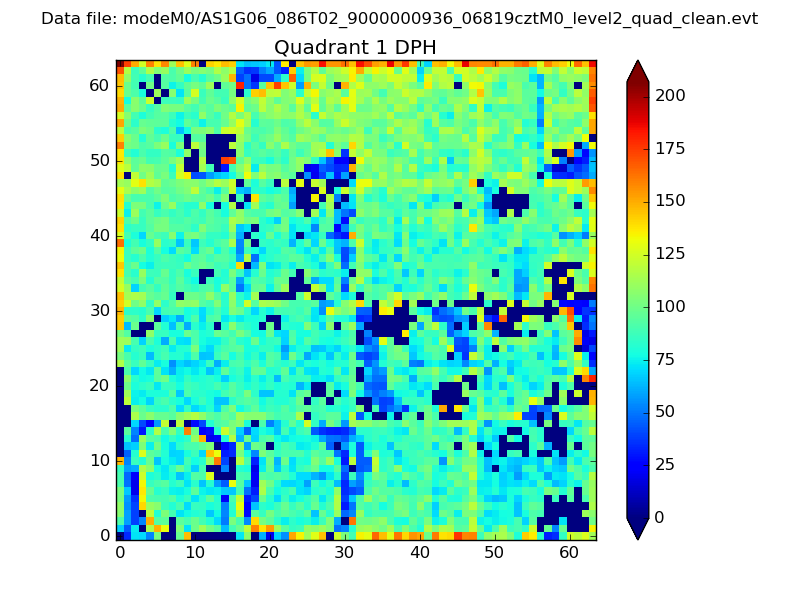 |
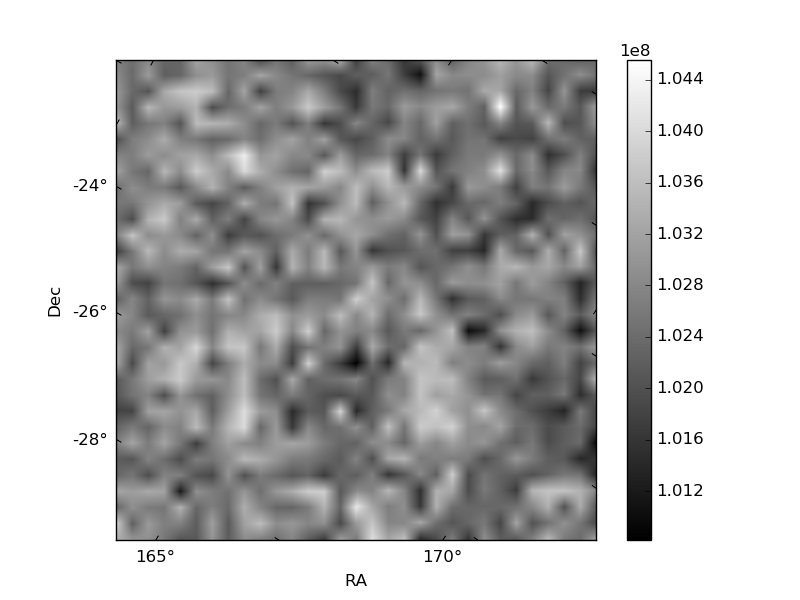
Quadrant B |
|---|---|---|---|
| Quadrant D | 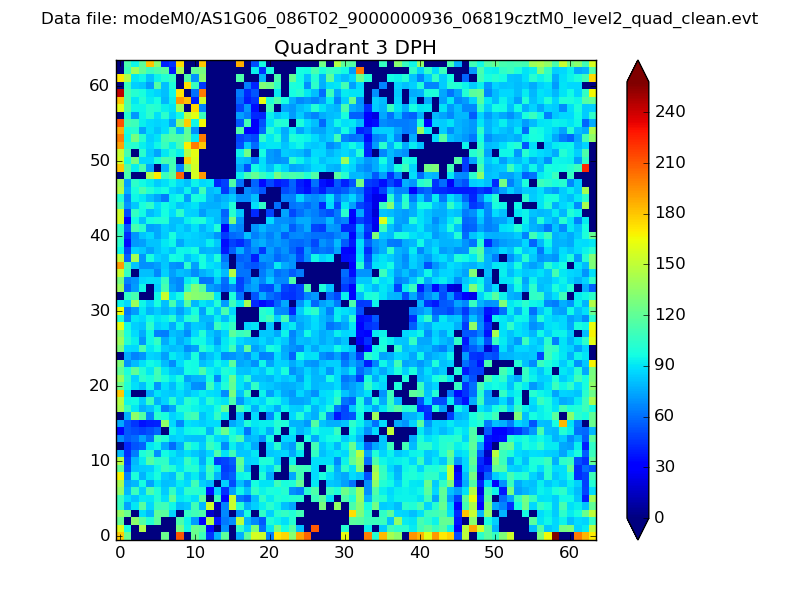 |
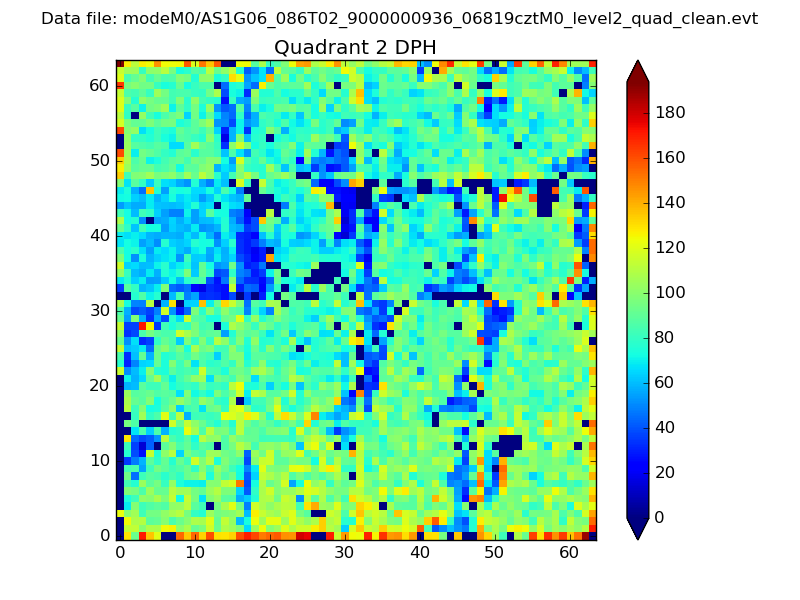 |
Quadrant C |
| Plot type | Count rate plots | Images |
|---|---|---|
| Comparison with Poisson distribution Blue bars denote a histogram of data divided into 1 sec bins. Red curve is a Poisson curve with rate = median count rate of data. |
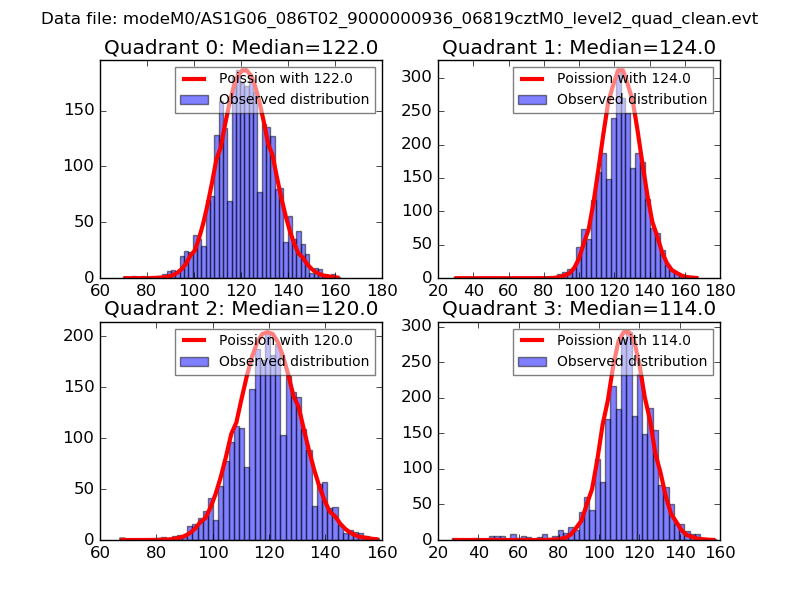 |
 |
| Quadrant-wise count rates Data is divided into 100 sec bins |
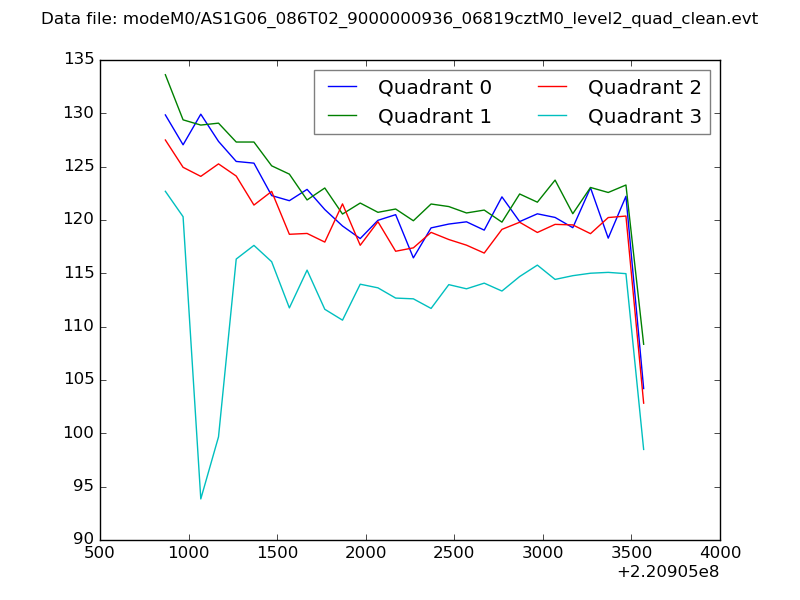 |
|
| Module-wise count rates for Quadrant A Data is divided into 100 sec bins |
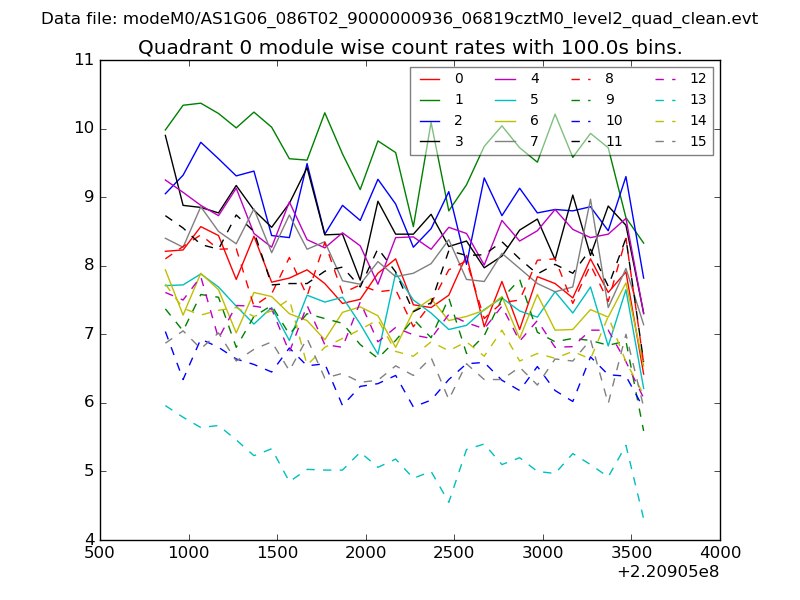 |
 |
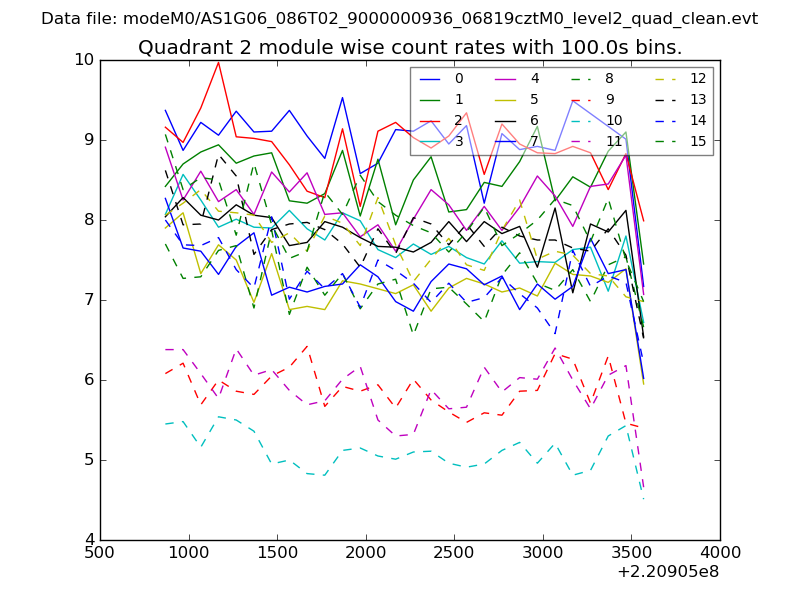
| Module-wise count rates for Quadrant B Data is divided into 100 sec bins |
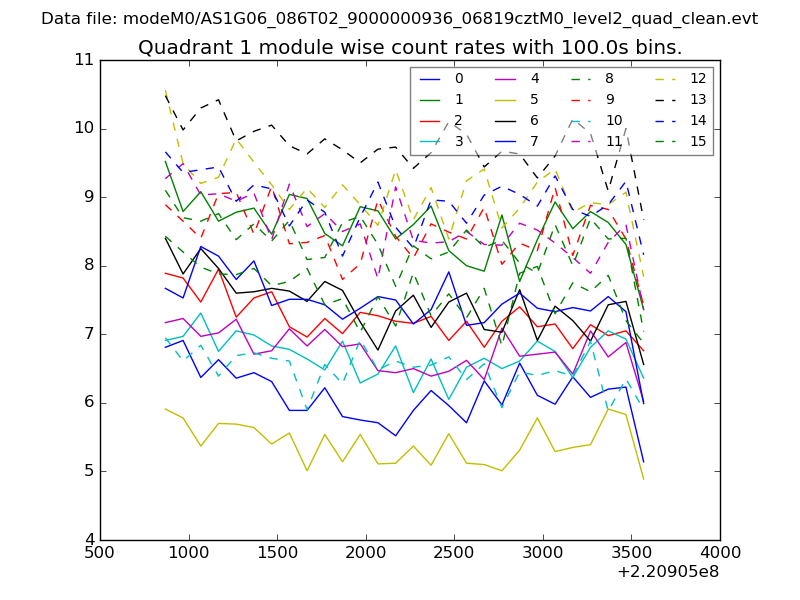 |
 |
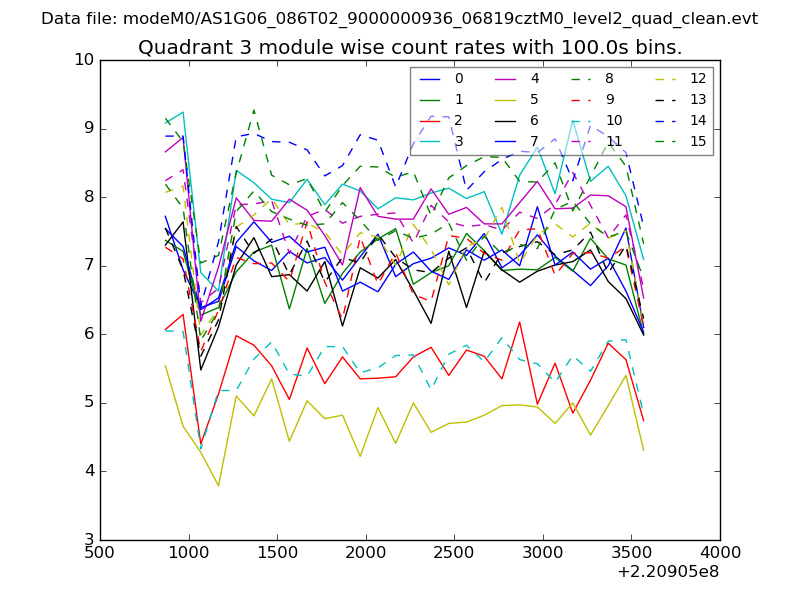
| Module-wise count rates for Quadrant C Data is divided into 100 sec bins |
 |
 |
| Module-wise count rates for Quadrant D Data is divided into 100 sec bins |
 |
 |
| Parameter | Plot |
|---|---|
| CZT HV Monitor | 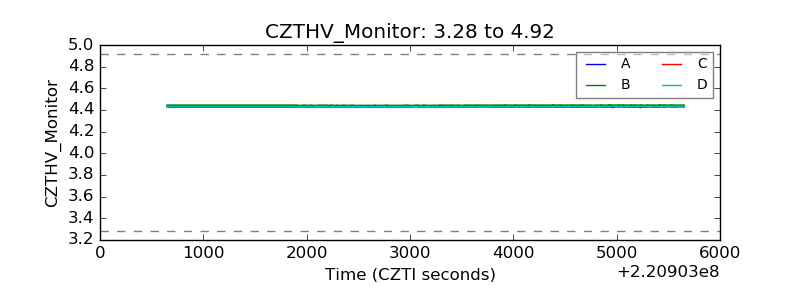 |
| D_VDD | 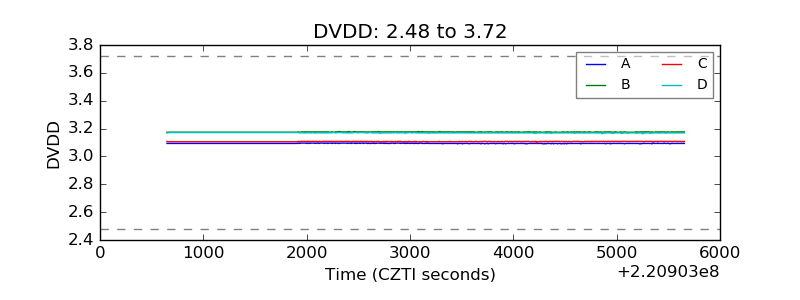 |
| Temperature 1 | 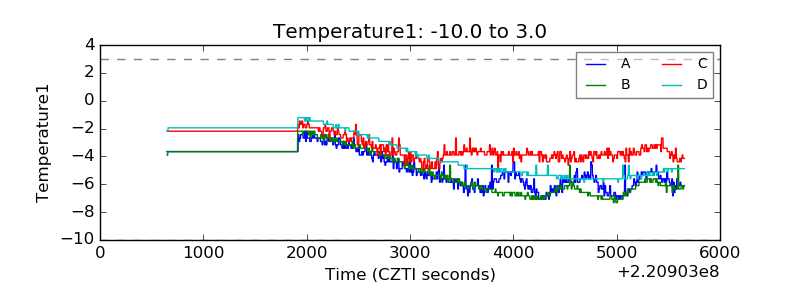 |
| Veto HV Monitor | 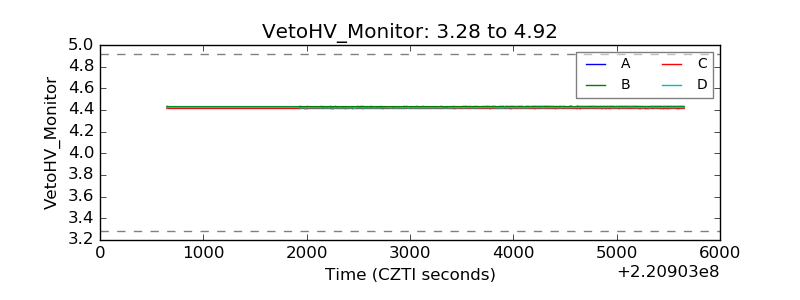 |
| Veto LLD | 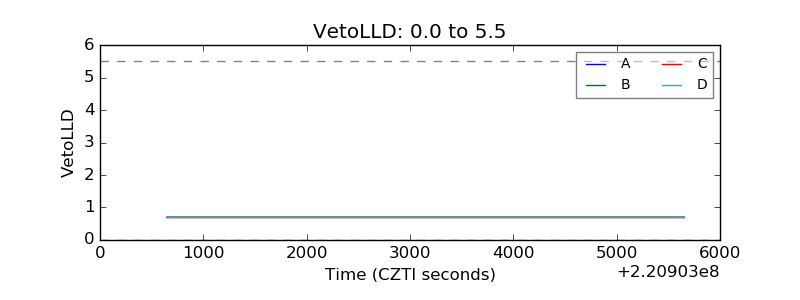 |
| Alpha Counter | 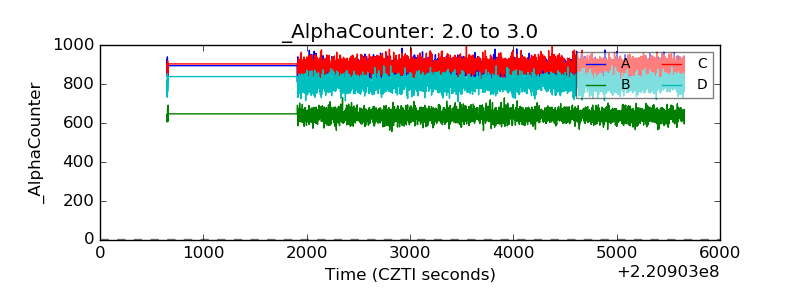 |
| _CPM_Rate | 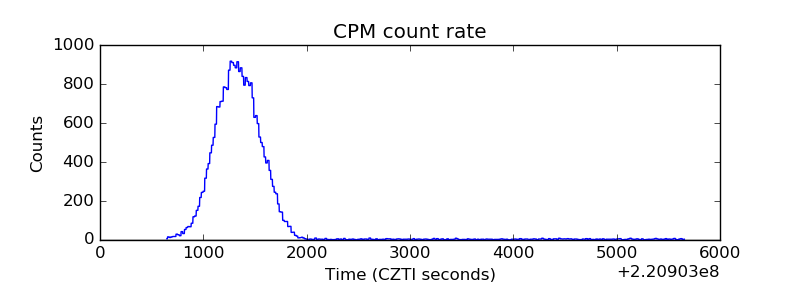 |
| CZT Counter | 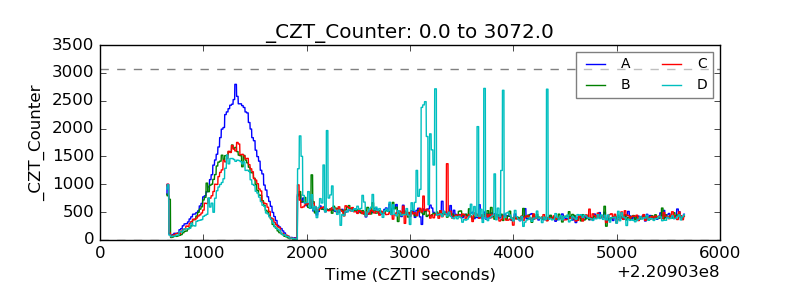 |
| +2.5 Volts monitor |  |
| +5 Volts monitor |  |
| _ROLL_ROT | 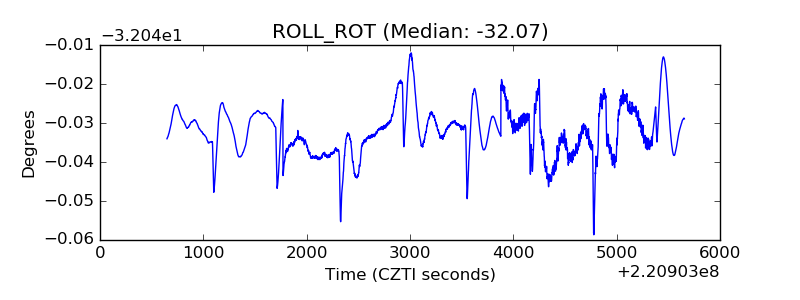 |
| _Roll_DEC | 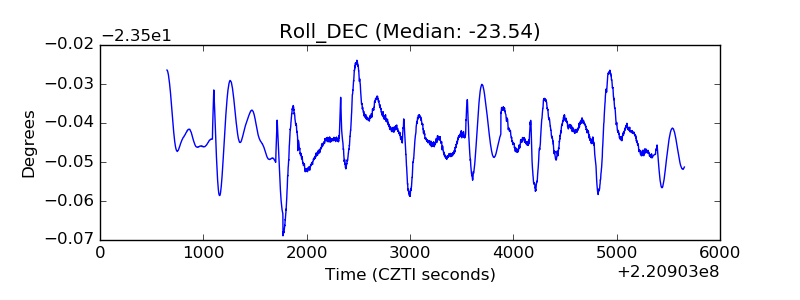 |
| _Roll_RA | 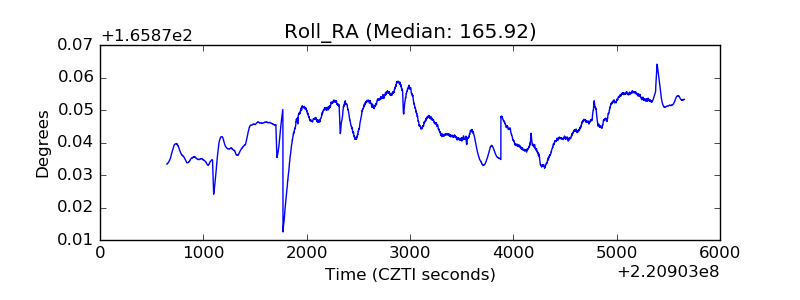 |
| Veto Counter | 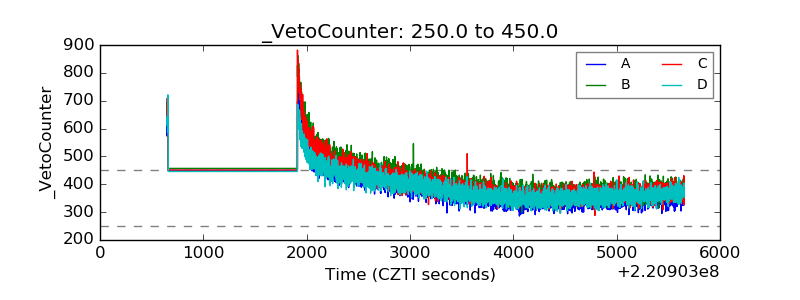 |