| Param | Original file | Final file |
|---|---|---|
| Filename | modeM0/AS1A02_174T04_9000000938cztM0_level2.fits | modeM0/AS1A02_174T04_9000000938cztM0_level2_quad_clean.evt |
| Size (bytes) | 1,155,072,960 | 1,123,876,800 |
| Size | 1.1 GB | 1.0 GB |
| Events in quadrant A | 6,982,746 | 6,654,838 |
| Events in quadrant B | 6,736,046 | 6,650,733 |
| Events in quadrant C | 6,902,982 | 6,373,802 |
| Events in quadrant D | 5,877,862 | 5,878,699 |
| Mode M9 | |||
|---|---|---|---|
| Quadrant | BADHDUFLAG | Total packets | Discarded packets |
| A | 0 | 192 | 0 |
| B | 0 | 192 | 0 |
| C | 0 | 192 | 0 |
| D | 0 | 192 | 0 |
| Mode M0 | |||
|---|---|---|---|
| Quadrant | BADHDUFLAG | Total packets | Discarded packets |
| A | 0 | 261065 | 0 |
| B | 0 | 266725 | 0 |
| C | 0 | 271625 | 0 |
| D | 0 | 315712 | 0 |
| Mode SS | |||
|---|---|---|---|
| Quadrant | BADHDUFLAG | Total packets | Discarded packets |
| A | 0 | 2526 | 0 |
| B | 0 | 2526 | 0 |
| C | 0 | 2526 | 0 |
| D | 0 | 2526 | 0 |
| Quadrant | Total seconds | Saturated seconds | Saturation percentage |
|---|---|---|---|
| A | 123725 | 1483 | 1.198626% |
| B | 123729 | 2455 | 1.984175% |
| C | 123731 | 1771 | 1.431331% |
| D | 123728 | 3917 | 3.165815% |
Noise dominated data is calculated using 1-second bins in cleaned event files. If a bin has >2000 counts, and if more than 50% of those come from <1% of pixels, then it is considered to be noise-dominated and hence unusable.
| Quadrant | # 1 sec bins | Bins with >0 counts | Bins with >2000 counts | High rate bins dominated by noise | Noise dominated (total time) | Noise dominated (detector-on time) | Marked lightcurve |
|---|---|---|---|---|---|---|---|
| A | 155948 | 123737 | 0 | 0 | 0.00% | 0.00% |  |
| B | 155948 | 123736 | 0 | 0 | 0.00% | 0.00% |  |
| C | 155948 | 123741 | 0 | 0 | 0.00% | 0.00% |  |
| D | 155948 | 123638 | 0 | 0 | 0.00% | 0.00% |  |
Top three noisy pixels from each quadrant. If the there are fewer than three noisy pixels in the level2.evt file, extra rows are filled as -1
| Pixel properties | Quadrant properties | ||||||
|---|---|---|---|---|---|---|---|
| Quadrant | DetID | PixID | Counts | Sigma | Mean | Median | Sigma |
| A | 14 | 188 | 6886 | 11.28 | 1813 | 1686 | 461.1 |
| A | 0 | 29 | 6739 | 10.96 | 1813 | 1686 | 461.1 |
| A | 14 | 204 | 5991 | 9.34 | 1813 | 1686 | 461.1 |
| B | 2 | 9 | 5865 | 11.66 | 1779 | 1690 | 358.0 |
| B | 12 | 226 | 4678 | 8.35 | 1779 | 1690 | 358.0 |
| B | 3 | 17 | 4598 | 8.12 | 1779 | 1690 | 358.0 |
| C | 1 | 80 | 5113 | 7.11 | 1826 | 1694 | 481.2 |
| C | 1 | 81 | 4991 | 6.85 | 1826 | 1694 | 481.2 |
| C | 12 | 241 | 4838 | 6.53 | 1826 | 1694 | 481.2 |
| D | 3 | 14 | 4398 | 6.38 | 1680 | 1521 | 451.1 |
| D | 6 | 231 | 4246 | 6.04 | 1680 | 1521 | 451.1 |
| D | 11 | 82 | 4144 | 5.81 | 1680 | 1521 | 451.1 |
Histogram calculated using DETX and DETY for each event in the final _common_clean file
| Quadrant A | 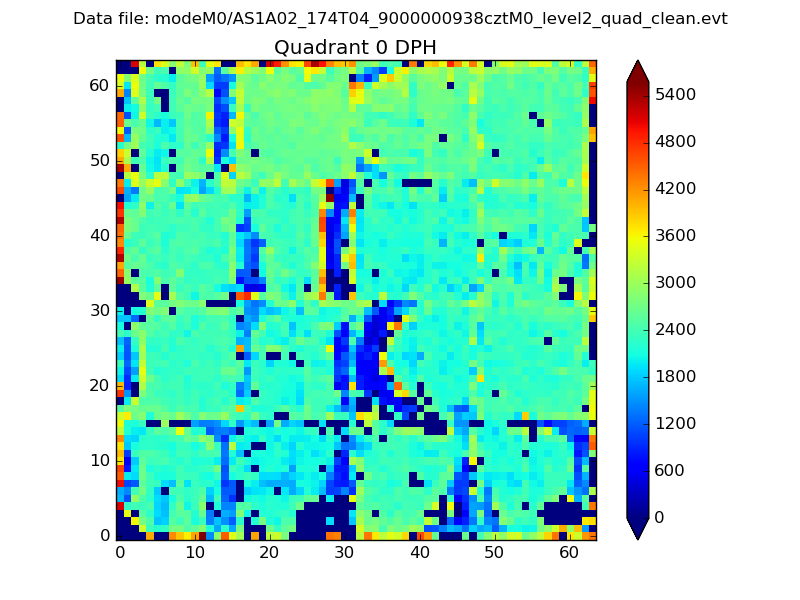 |
 |
Quadrant B |
|---|---|---|---|
| Quadrant D |  |
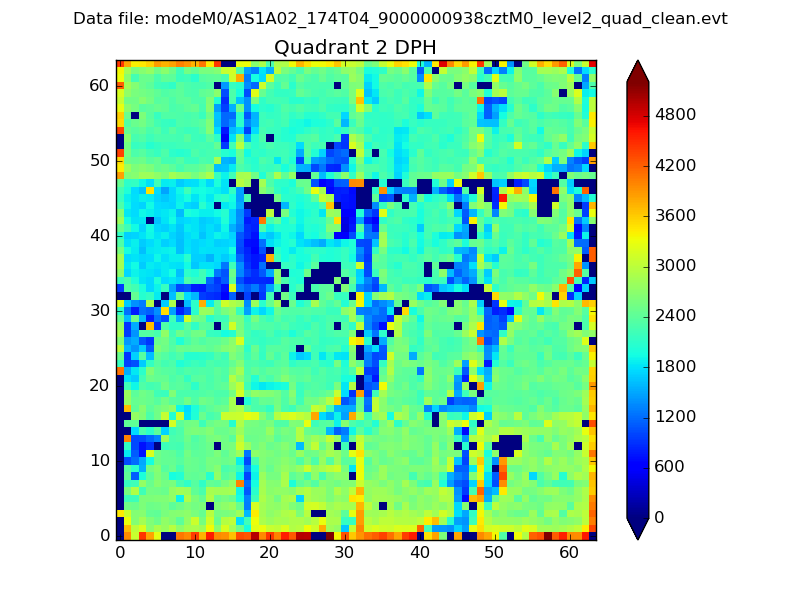 |
Quadrant C |
| Plot type | Count rate plots | Images |
|---|---|---|
| Comparison with Poisson distribution Blue bars denote a histogram of data divided into 1 sec bins. Red curve is a Poisson curve with rate = median count rate of data. |
 |
 |
| Quadrant-wise count rates Data is divided into 100 sec bins |
 |
|
| Module-wise count rates for Quadrant A Data is divided into 100 sec bins |
 |
 |
| Module-wise count rates for Quadrant B Data is divided into 100 sec bins |
 |
 |
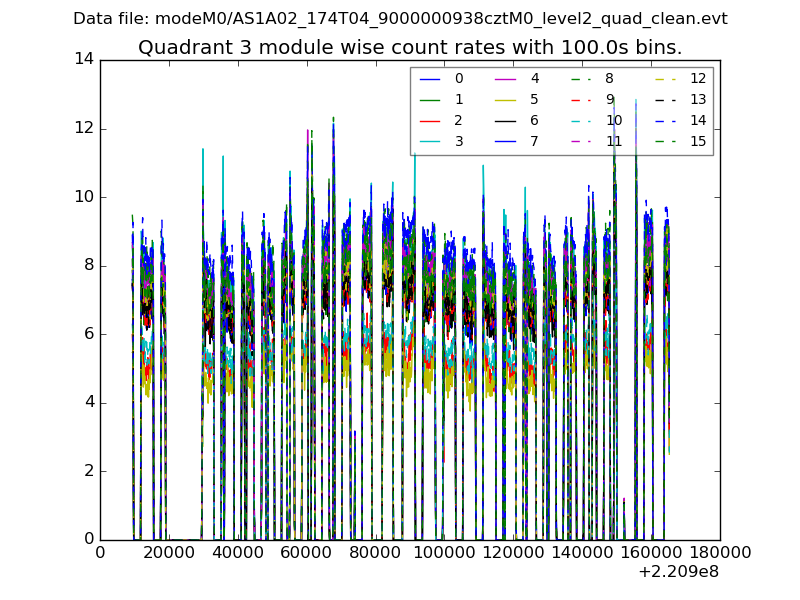
| Module-wise count rates for Quadrant C Data is divided into 100 sec bins |
 |
 |
| Module-wise count rates for Quadrant D Data is divided into 100 sec bins |
 |
 |
| Parameter | Plot |
|---|---|
| CZT HV Monitor |  |
| D_VDD |  |
| Temperature 1 |  |
| Veto HV Monitor |  |
| Veto LLD |  |
| Alpha Counter |  |
| _CPM_Rate |  |
| CZT Counter |  |
| +2.5 Volts monitor |  |
| +5 Volts monitor |  |
| _ROLL_ROT |  |
| _Roll_DEC |  |
| _Roll_RA |  |
| Veto Counter |  |