| Param | Original file | Final file |
|---|---|---|
| Filename | modeM0/AS1A02_174T04_9000000938_06825cztM0_level2.evt | modeM0/AS1A02_174T04_9000000938_06825cztM0_level2_quad_clean.evt |
| Size (bytes) | 1,829,684,160 | 144,184,320 |
| Size | 1.7 GB | 137.5 MB |
| Events in quadrant A | 12,821,409 | 631,071 |
| Events in quadrant B | 12,988,180 | 640,468 |
| Events in quadrant C | 12,918,254 | 628,879 |
| Events in quadrant D | 14,855,340 | 603,158 |
| Mode M9 | |||
|---|---|---|---|
| Quadrant | BADHDUFLAG | Total packets | Discarded packets |
| A | 0 | 32 | 0 |
| B | 0 | 32 | 0 |
| C | 0 | 32 | 0 |
| D | 0 | 32 | 0 |
| Mode M0 | |||
|---|---|---|---|
| Quadrant | BADHDUFLAG | Total packets | Discarded packets |
| A | 0 | 56607 | 8 |
| B | 0 | 57213 | 7 |
| C | 0 | 57041 | 7 |
| D | 0 | 62662 | 11 |
| Mode SS | |||
|---|---|---|---|
| Quadrant | BADHDUFLAG | Total packets | Discarded packets |
| A | 0 | 558 | 0 |
| B | 0 | 558 | 0 |
| C | 0 | 558 | 0 |
| D | 0 | 558 | 0 |
| Quadrant | Total seconds | Saturated seconds | Saturation percentage |
|---|---|---|---|
| A | 27051 | 328 | 1.212524% |
| B | 27051 | 468 | 1.730065% |
| C | 27051 | 250 | 0.924180% |
| D | 27050 | 502 | 1.855823% |
Noise dominated data is calculated using 1-second bins in cleaned event files. If a bin has >2000 counts, and if more than 50% of those come from <1% of pixels, then it is considered to be noise-dominated and hence unusable.
| Quadrant | # 1 sec bins | Bins with >0 counts | Bins with >2000 counts | High rate bins dominated by noise | Noise dominated (total time) | Noise dominated (detector-on time) | Marked lightcurve |
|---|---|---|---|---|---|---|---|
| A | 41017 | 27059 | 4 | 4 | 0.01% | 0.01% | 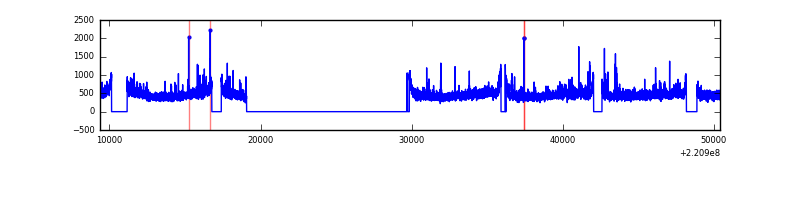 |
| B | 41017 | 27059 | 30 | 30 | 0.07% | 0.11% | 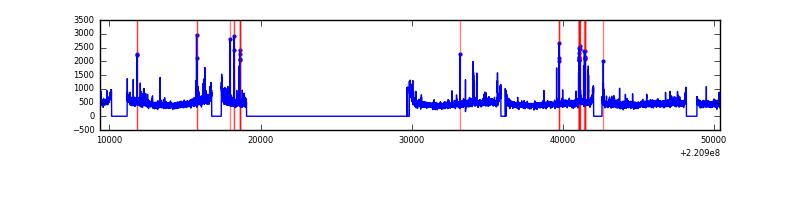 |
| C | 41017 | 27059 | 29 | 29 | 0.07% | 0.11% | 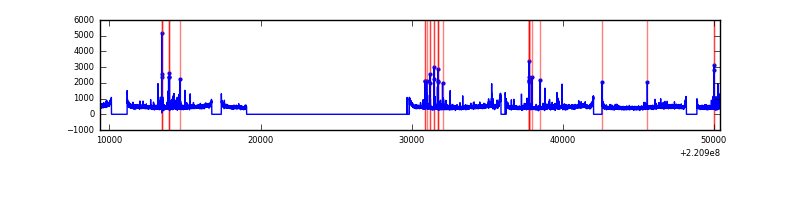 |
| D | 41017 | 27058 | 202 | 202 | 0.49% | 0.75% | 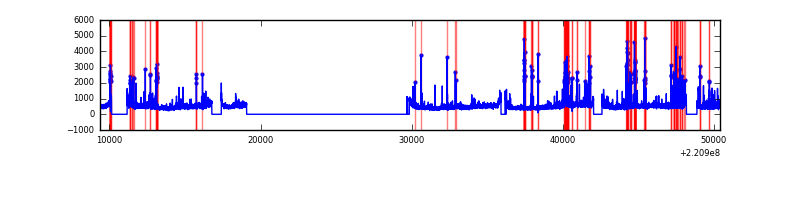 |
Top three noisy pixels from each quadrant. If the there are fewer than three noisy pixels in the level2.evt file, extra rows are filled as -1
| Pixel properties | Quadrant properties | ||||||
|---|---|---|---|---|---|---|---|
| Quadrant | DetID | PixID | Counts | Sigma | Mean | Median | Sigma |
| A | 8 | 15 | 506794 | 775.41 | 3179 | 3109 | 649.6 |
| A | 13 | 248 | 44298 | 63.41 | 3179 | 3109 | 649.6 |
| A | 13 | 251 | 38283 | 54.15 | 3179 | 3109 | 649.6 |
| B | 0 | 228 | 127183 | 202.16 | 3205 | 3124 | 613.7 |
| B | 15 | 204 | 121856 | 193.48 | 3205 | 3124 | 613.7 |
| B | 0 | 214 | 100799 | 159.17 | 3205 | 3124 | 613.7 |
| C | 9 | 247 | 401522 | 559.18 | 3085 | 3097 | 712.5 |
| C | 12 | 16 | 360399 | 501.47 | 3085 | 3097 | 712.5 |
| C | 3 | 9 | 41796 | 54.31 | 3085 | 3097 | 712.5 |
| D | 8 | 195 | 1537521 | 2040.29 | 3073 | 2976 | 752.1 |
| D | 14 | 34 | 656193 | 868.5 | 3073 | 2976 | 752.1 |
| D | 2 | 136 | 483440 | 638.81 | 3073 | 2976 | 752.1 |
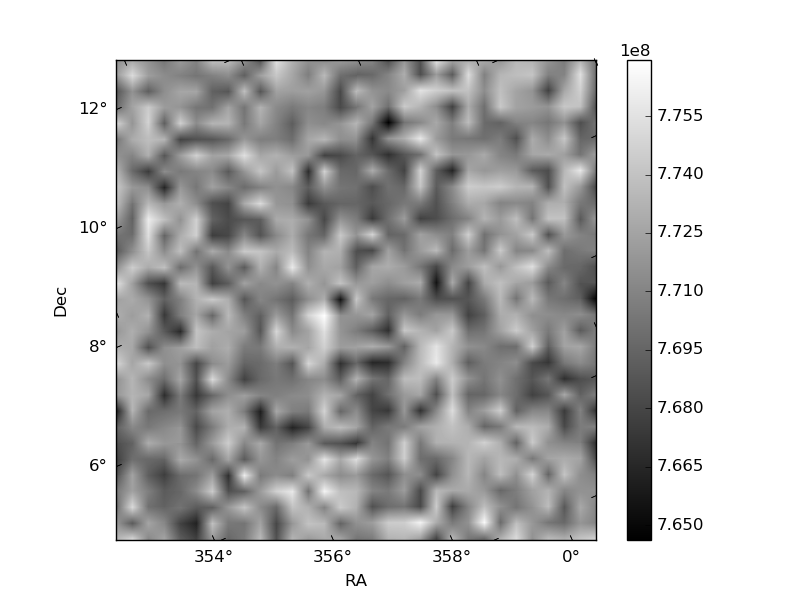
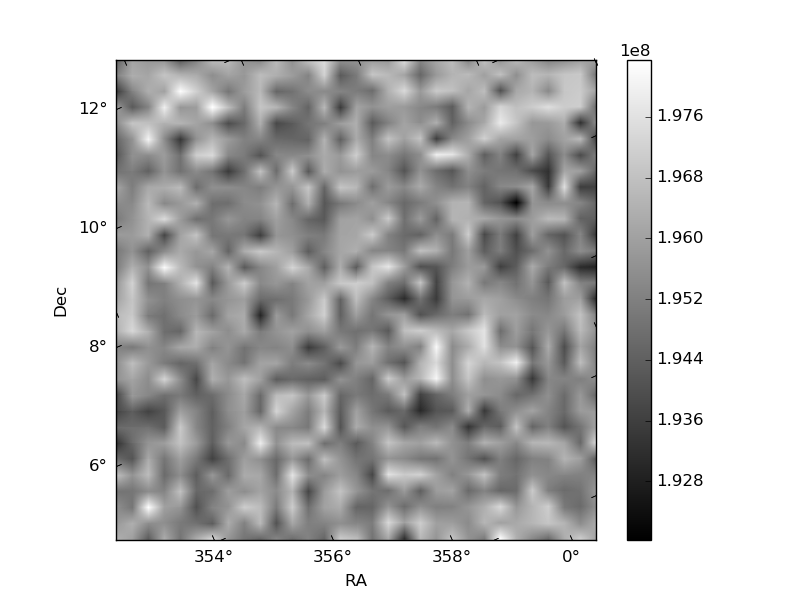
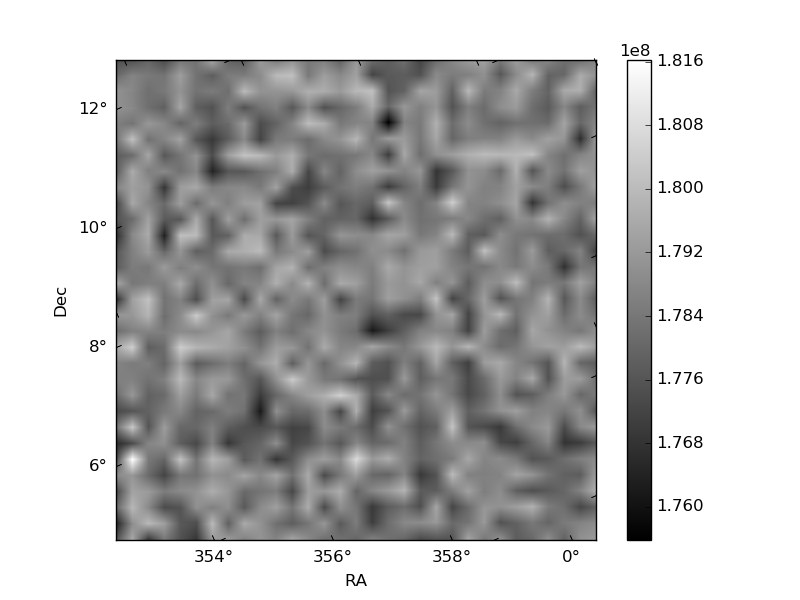
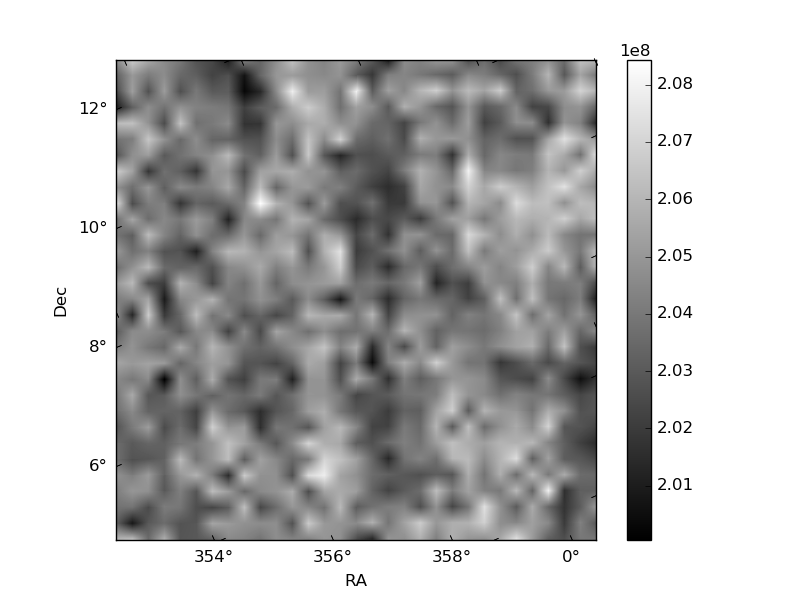
Histogram calculated using DETX and DETY for each event in the final _common_clean file
| Quadrant A | 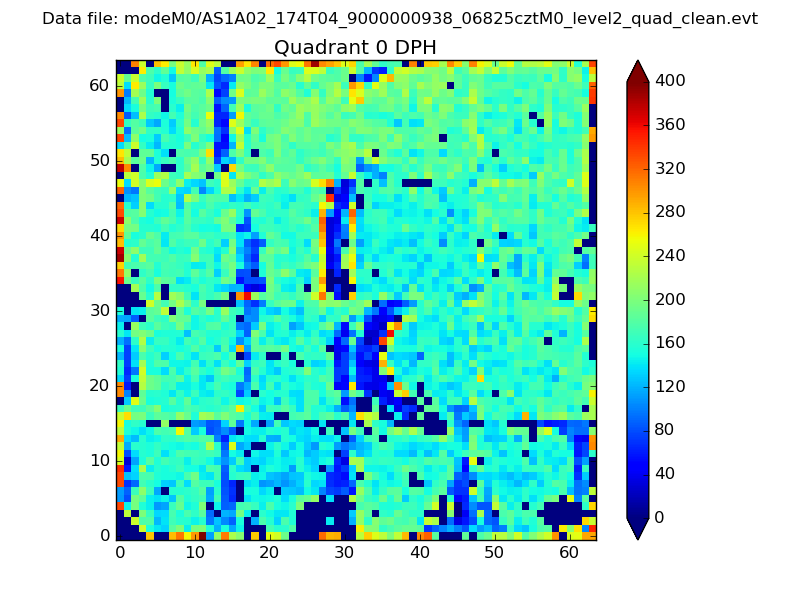 |
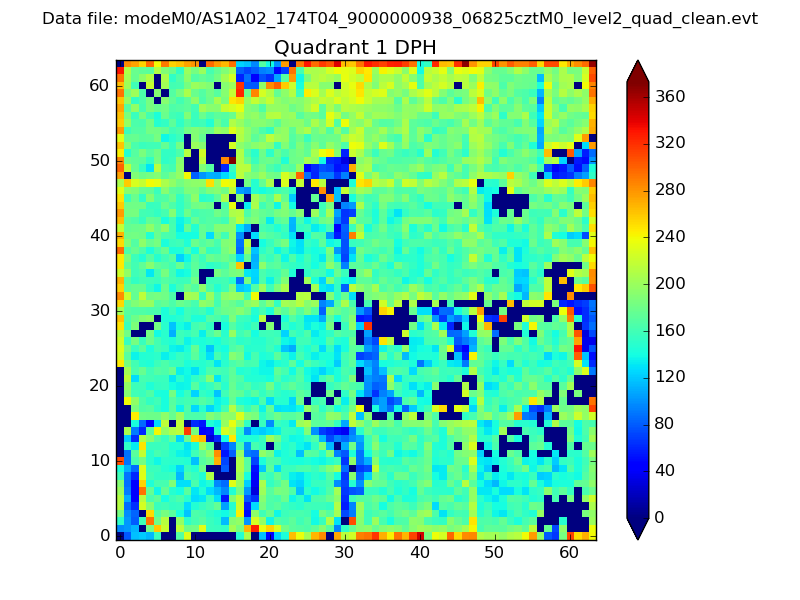 |
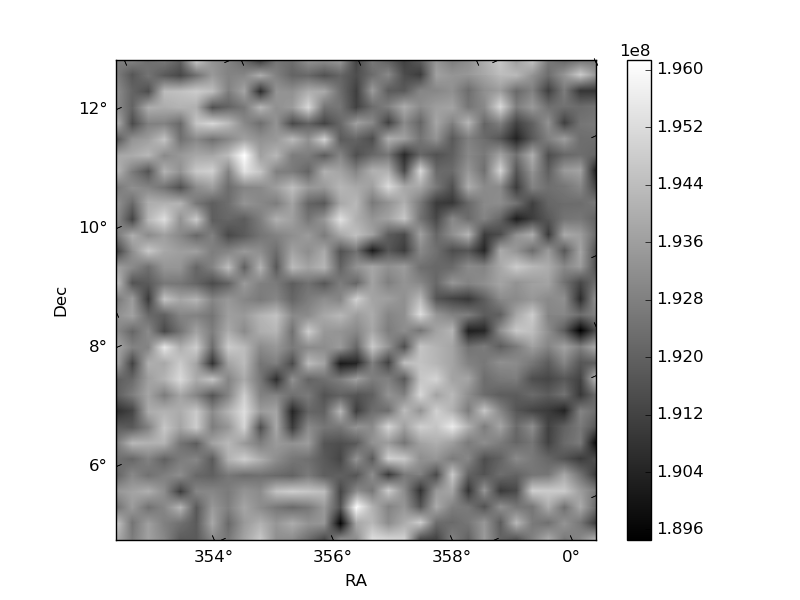
Quadrant B |
|---|---|---|---|
| Quadrant D | 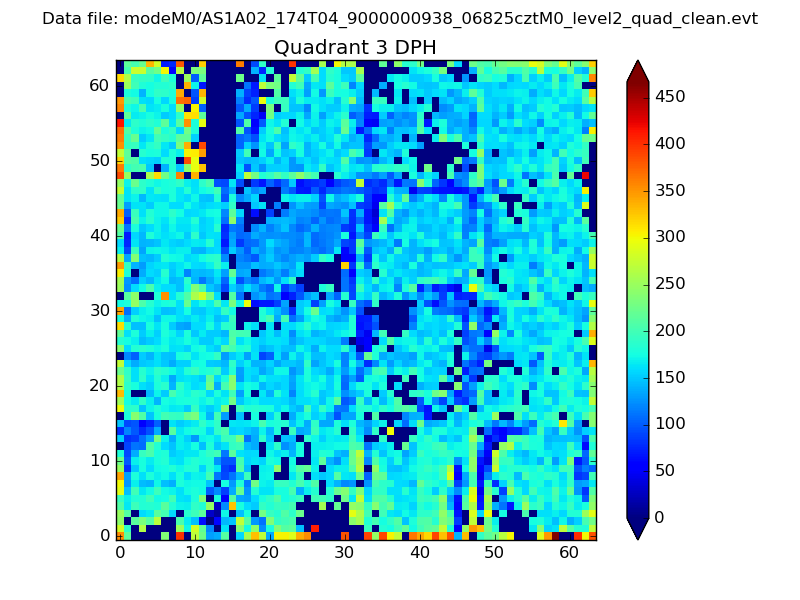 |
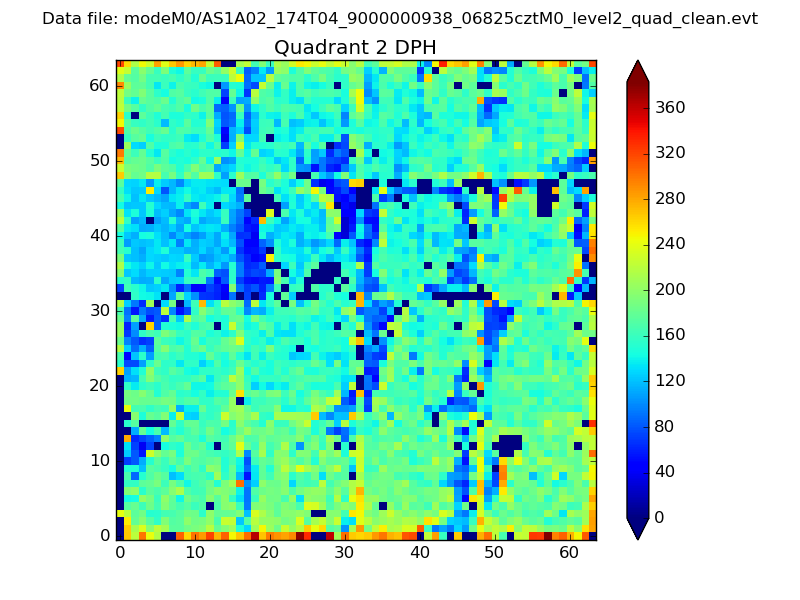 |
Quadrant C |
| Plot type | Count rate plots | Images |
|---|---|---|
| Comparison with Poisson distribution Blue bars denote a histogram of data divided into 1 sec bins. Red curve is a Poisson curve with rate = median count rate of data. |
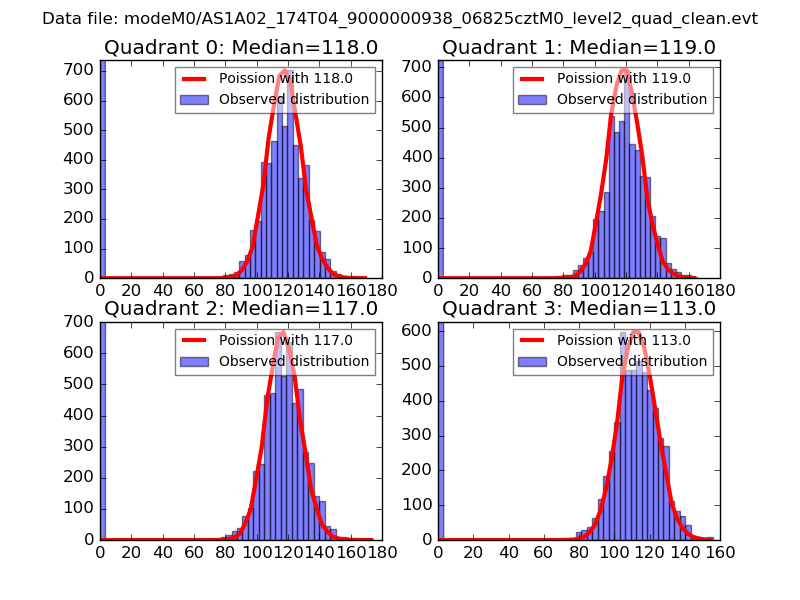 |
 |
| Quadrant-wise count rates Data is divided into 100 sec bins |
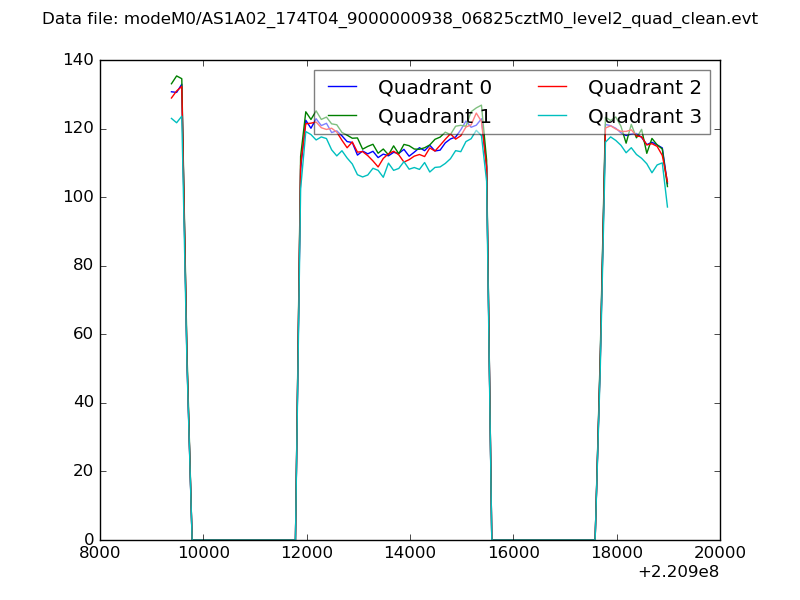 |
|
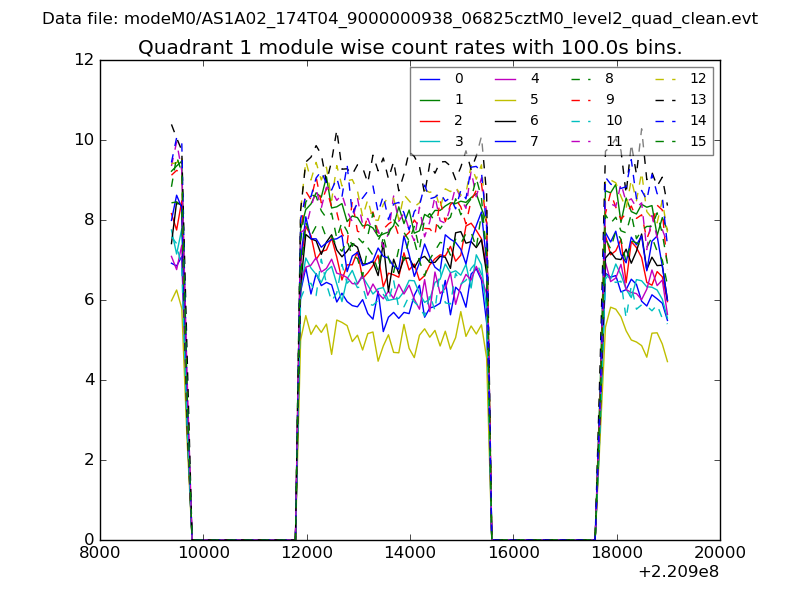
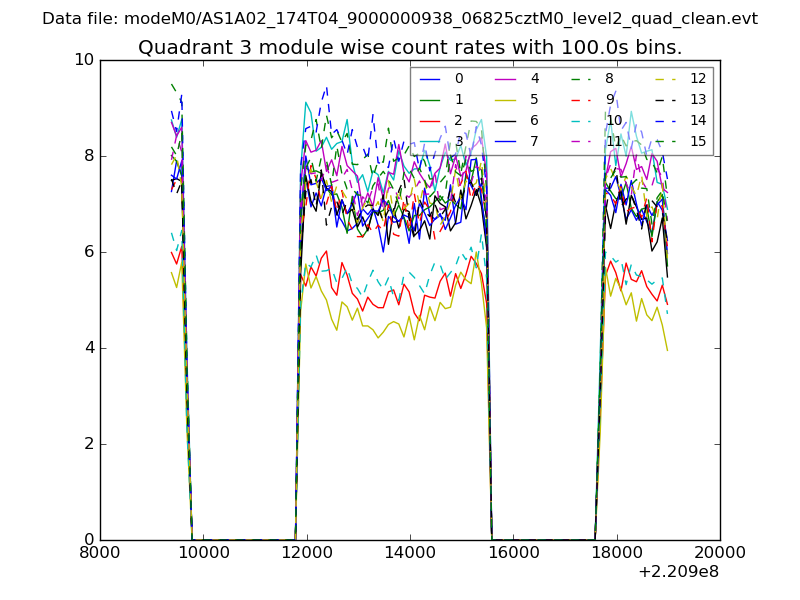
| Module-wise count rates for Quadrant A Data is divided into 100 sec bins |
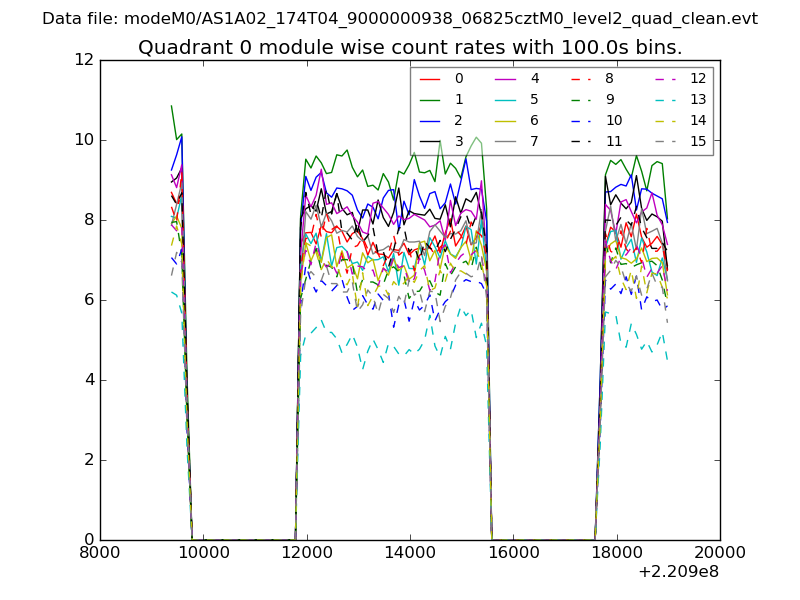 |
 |
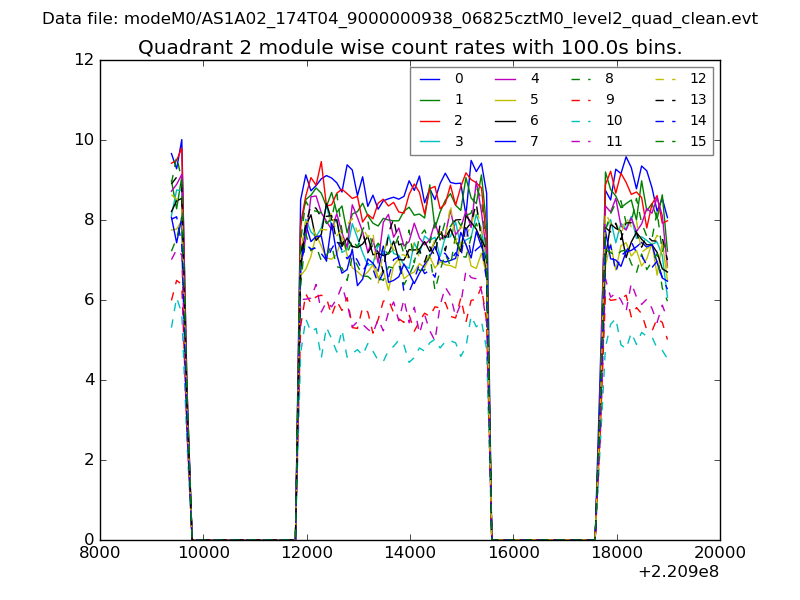
| Module-wise count rates for Quadrant B Data is divided into 100 sec bins |
 |
 |
| Module-wise count rates for Quadrant C Data is divided into 100 sec bins |
 |
 |
| Module-wise count rates for Quadrant D Data is divided into 100 sec bins |
 |
 |
| Parameter | Plot |
|---|---|
| CZT HV Monitor | 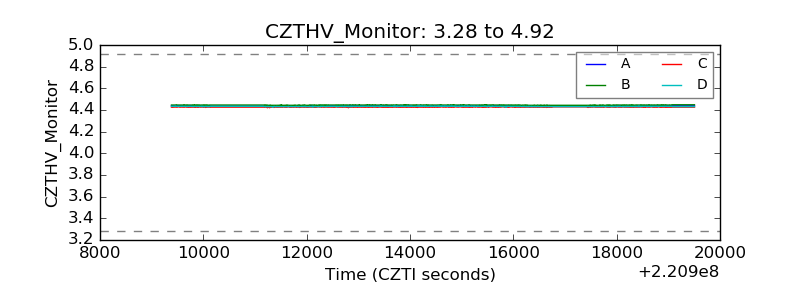 |
| D_VDD | 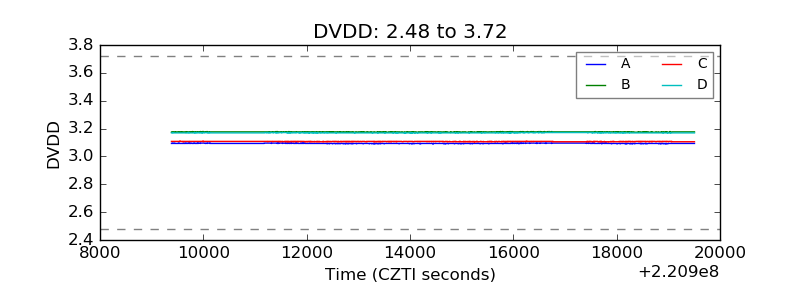 |
| Temperature 1 | 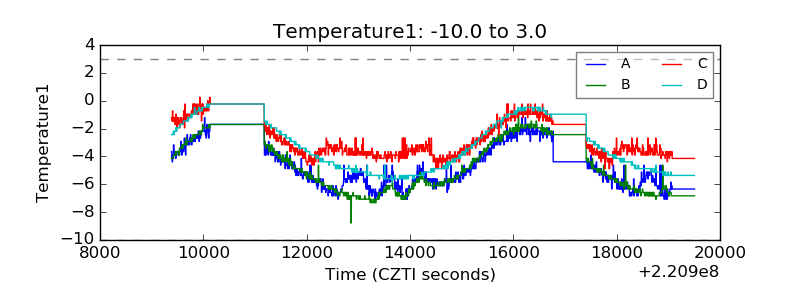 |
| Veto HV Monitor | 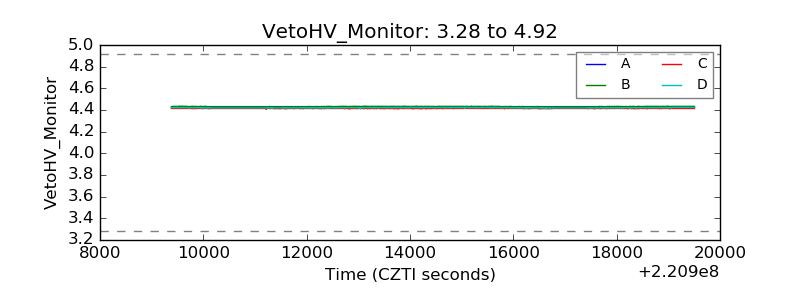 |
| Veto LLD | 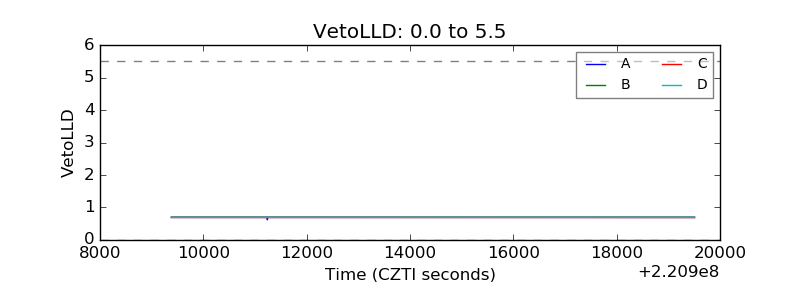 |
| Alpha Counter | 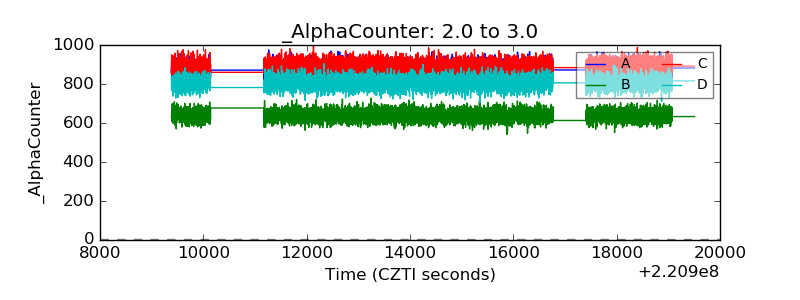 |
| _CPM_Rate | 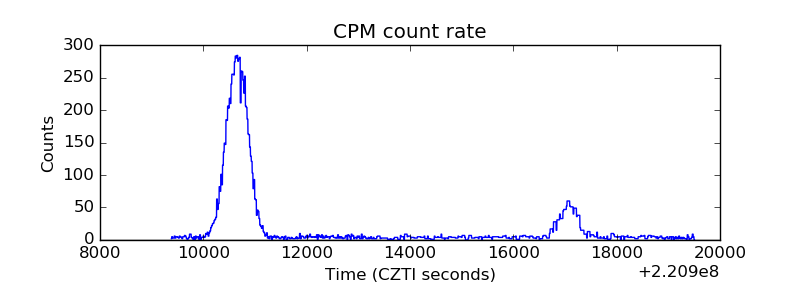 |
| CZT Counter | 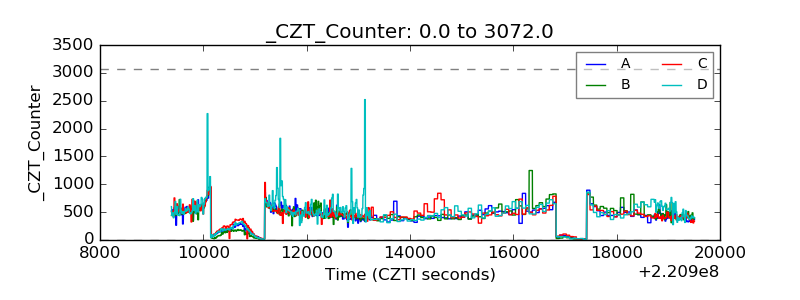 |
| +2.5 Volts monitor | 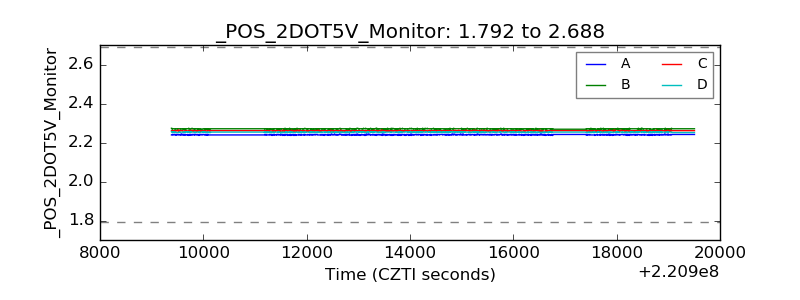 |
| +5 Volts monitor | 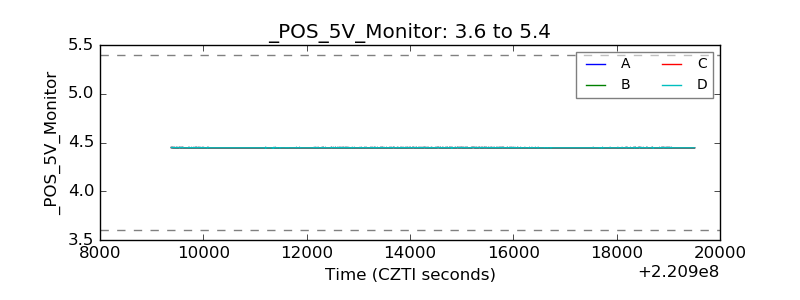 |
| _ROLL_ROT | 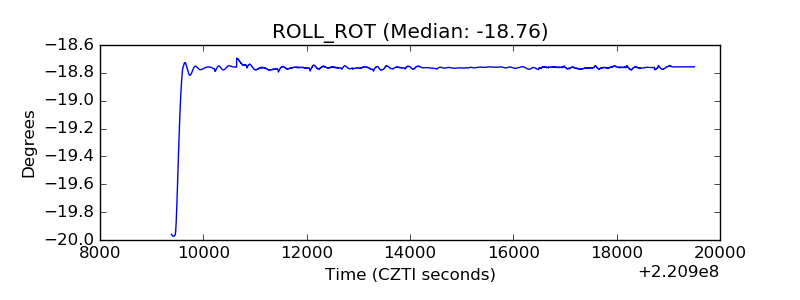 |
| _Roll_DEC | 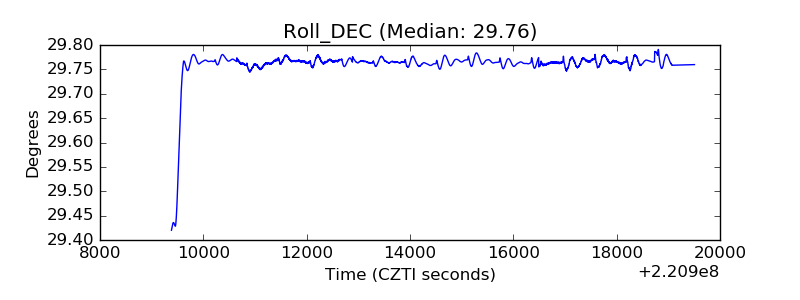 |
| _Roll_RA | 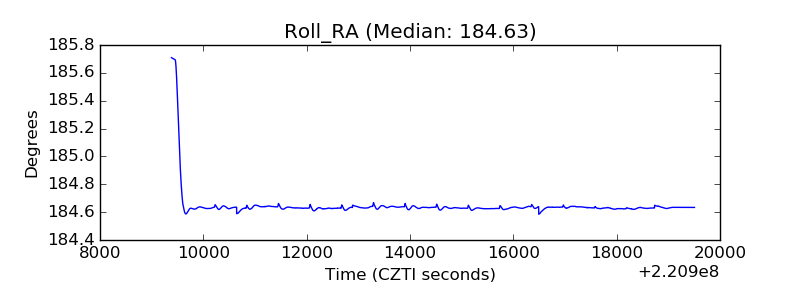 |
| Veto Counter | 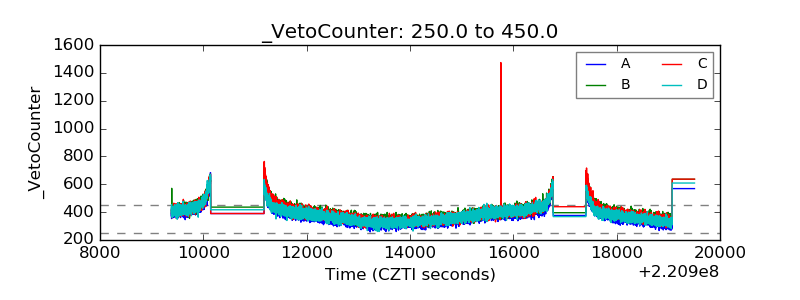 |