| Param | Original file | Final file |
|---|---|---|
| Filename | modeM0/AS1A02_174T04_9000000938_06826cztM0_level2.evt | modeM0/AS1A02_174T04_9000000938_06826cztM0_level2_quad_clean.evt |
| Size (bytes) | 2,735,910,720 | 170,418,240 |
| Size | 2.5 GB | 162.5 MB |
| Events in quadrant A | 19,470,707 | 596,044 |
| Events in quadrant B | 19,574,978 | 604,994 |
| Events in quadrant C | 19,037,752 | 593,254 |
| Events in quadrant D | 22,026,359 | 570,178 |
| Mode M9 | |||
|---|---|---|---|
| Quadrant | BADHDUFLAG | Total packets | Discarded packets |
| A | 0 | 32 | 3 |
| B | 0 | 30 | 0 |
| C | 0 | 30 | 1 |
| D | 0 | 32 | 2 |
| Mode M0 | |||
|---|---|---|---|
| Quadrant | BADHDUFLAG | Total packets | Discarded packets |
| A | 0 | 86022 | 322 |
| B | 0 | 86579 | 297 |
| C | 0 | 85232 | 319 |
| D | 0 | 93801 | 424 |
| Mode SS | |||
|---|---|---|---|
| Quadrant | BADHDUFLAG | Total packets | Discarded packets |
| A | 0 | 833 | 3 |
| B | 0 | 833 | 3 |
| C | 0 | 833 | 3 |
| D | 0 | 834 | 4 |
| Quadrant | Total seconds | Saturated seconds | Saturation percentage |
|---|---|---|---|
| A | 40679 | 420 | 1.032474% |
| B | 40685 | 592 | 1.455082% |
| C | 40678 | 281 | 0.690791% |
| D | 40674 | 701 | 1.723460% |
Noise dominated data is calculated using 1-second bins in cleaned event files. If a bin has >2000 counts, and if more than 50% of those come from <1% of pixels, then it is considered to be noise-dominated and hence unusable.
| Quadrant | # 1 sec bins | Bins with >0 counts | Bins with >2000 counts | High rate bins dominated by noise | Noise dominated (total time) | Noise dominated (detector-on time) | Marked lightcurve |
|---|---|---|---|---|---|---|---|
| A | 44422 | 40703 | 46 | 46 | 0.10% | 0.11% | 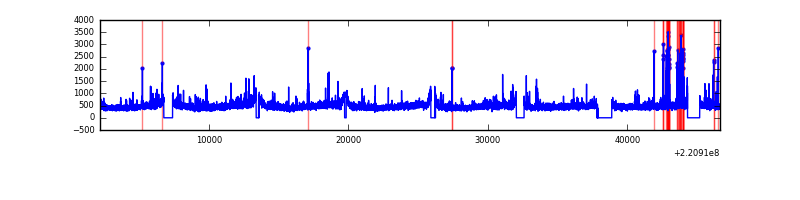 |
| B | 44422 | 40711 | 62 | 62 | 0.14% | 0.15% | 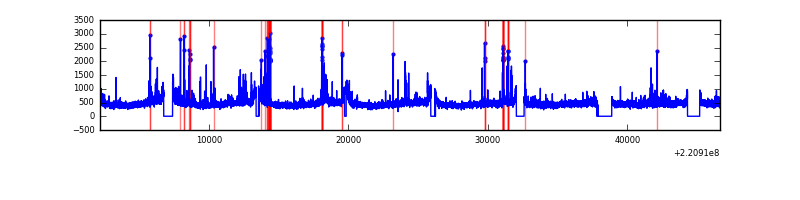 |
| C | 44422 | 40700 | 35 | 35 | 0.08% | 0.09% | 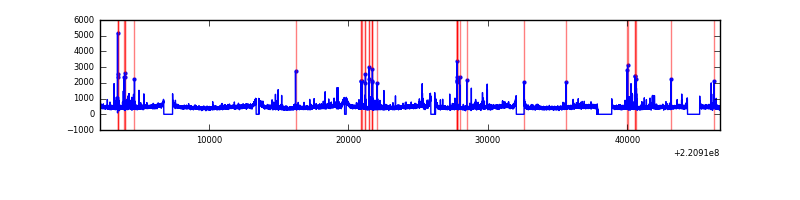 |
| D | 44422 | 40697 | 353 | 353 | 0.79% | 0.87% | 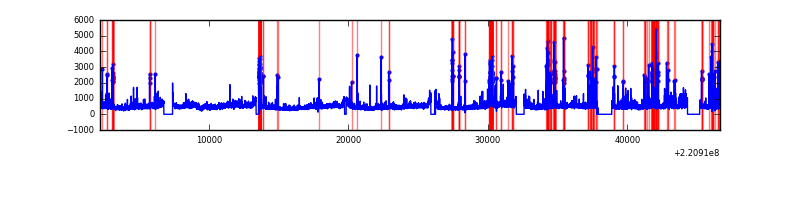 |
Top three noisy pixels from each quadrant. If the there are fewer than three noisy pixels in the level2.evt file, extra rows are filled as -1
| Pixel properties | Quadrant properties | ||||||
|---|---|---|---|---|---|---|---|
| Quadrant | DetID | PixID | Counts | Sigma | Mean | Median | Sigma |
| A | 8 | 15 | 1118692 | 1153.93 | 4727 | 4618 | 965.5 |
| A | 13 | 248 | 74039 | 71.9 | 4727 | 4618 | 965.5 |
| A | 8 | 4 | 60412 | 57.79 | 4727 | 4618 | 965.5 |
| B | 0 | 228 | 453114 | 495.12 | 4762 | 4645 | 905.8 |
| B | 15 | 204 | 203112 | 219.11 | 4762 | 4645 | 905.8 |
| B | 0 | 214 | 156262 | 167.39 | 4762 | 4645 | 905.8 |
| C | 12 | 16 | 475549 | 445.85 | 4583 | 4604 | 1056.3 |
| C | 9 | 247 | 461164 | 432.23 | 4583 | 4604 | 1056.3 |
| C | 3 | 9 | 80641 | 71.98 | 4583 | 4604 | 1056.3 |
| D | 8 | 195 | 2250556 | 2006.69 | 4564 | 4418 | 1119.3 |
| D | 14 | 34 | 1112224 | 989.71 | 4564 | 4418 | 1119.3 |
| D | 2 | 136 | 619312 | 549.34 | 4564 | 4418 | 1119.3 |
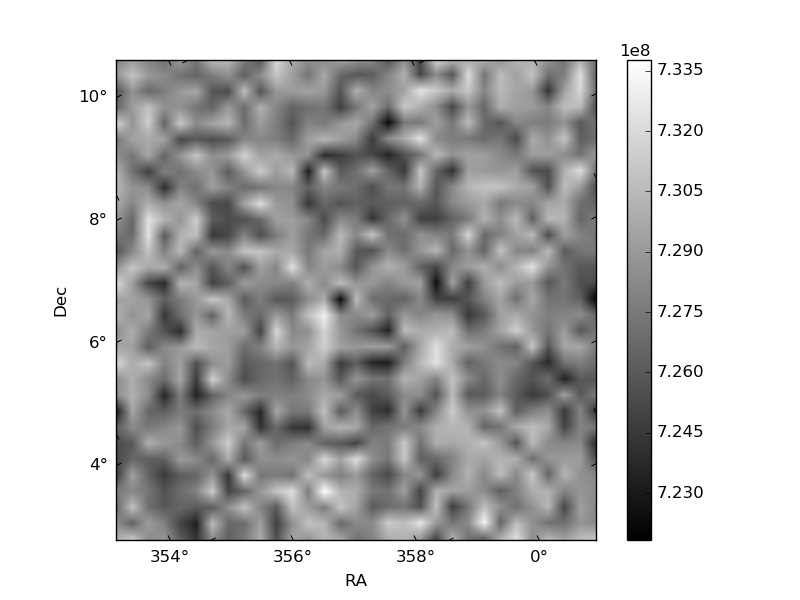
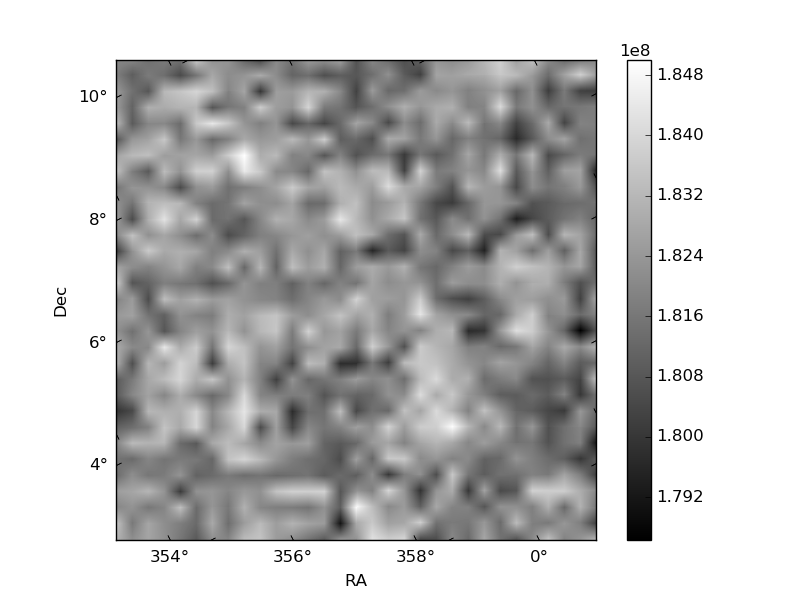
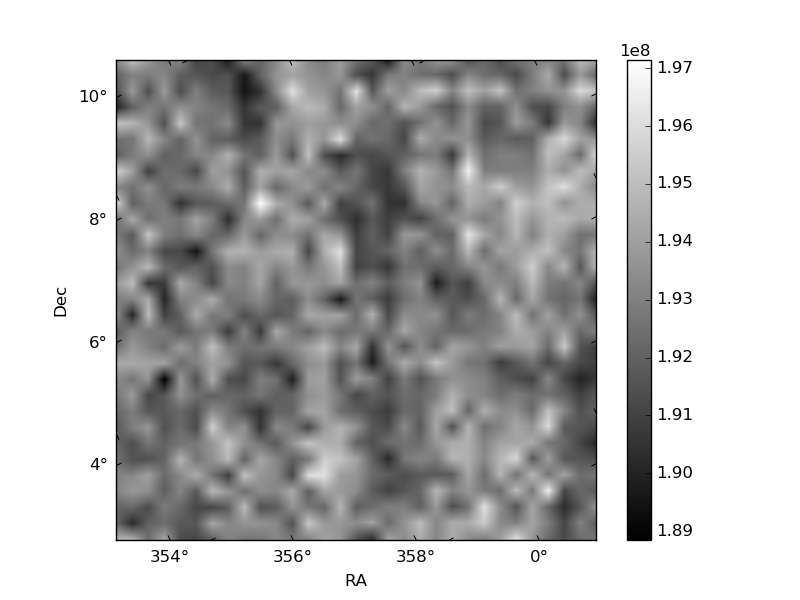
Histogram calculated using DETX and DETY for each event in the final _common_clean file
| Quadrant A | 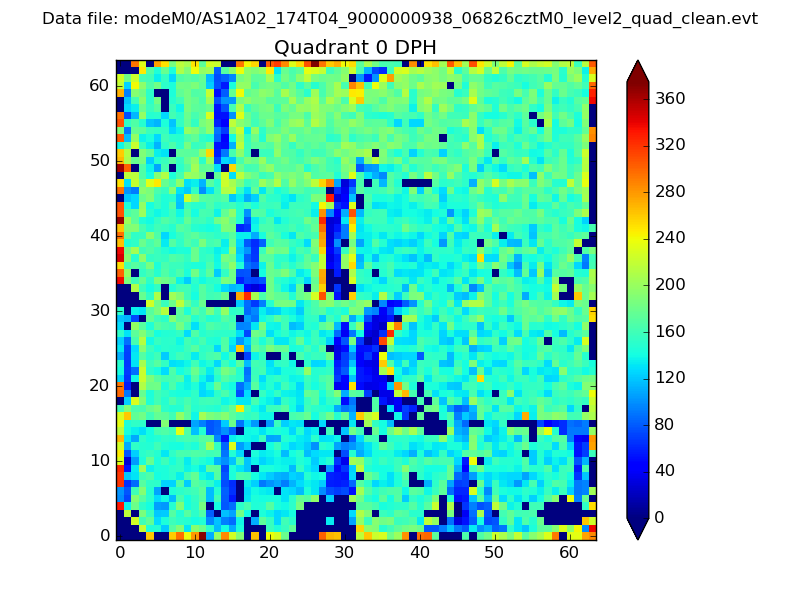 |
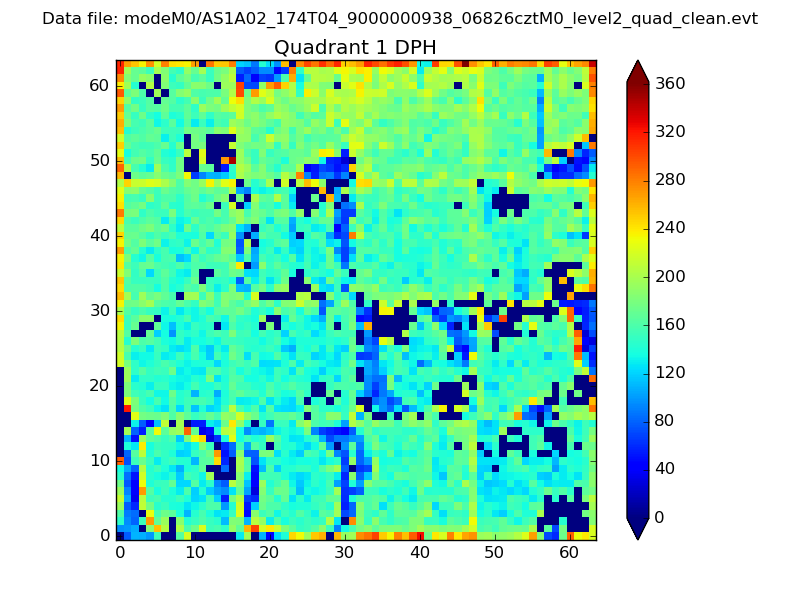 |
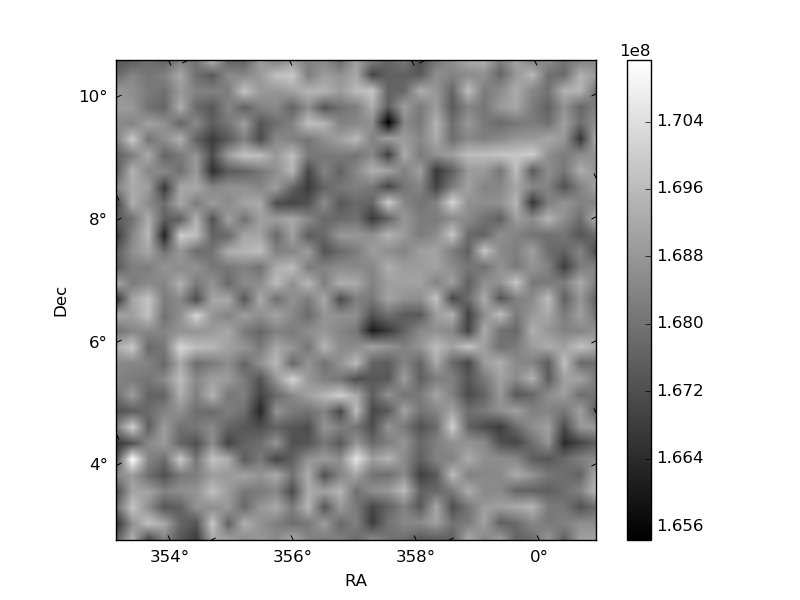
Quadrant B |
|---|---|---|---|
| Quadrant D | 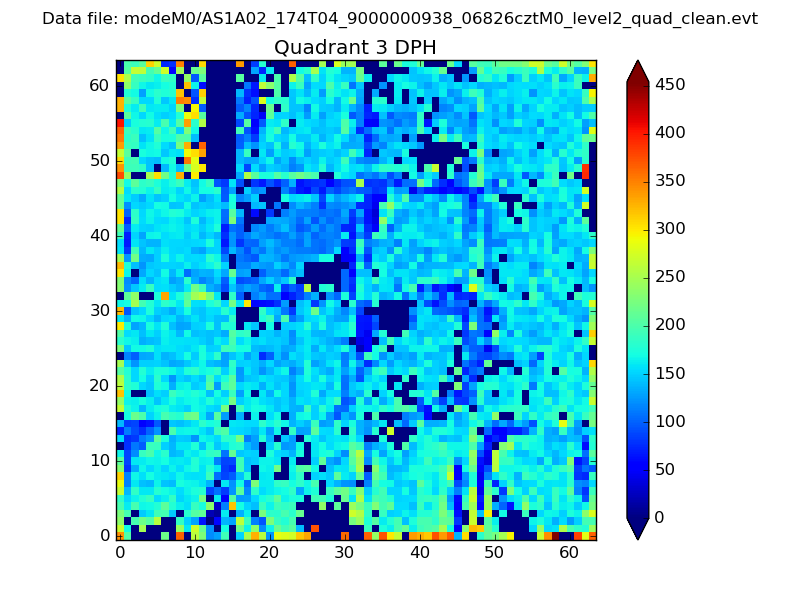 |
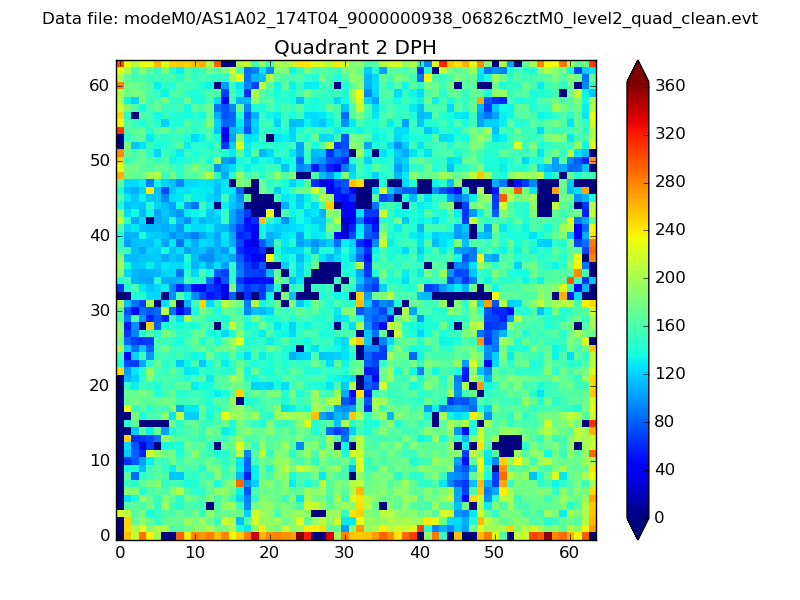 |
Quadrant C |
| Plot type | Count rate plots | Images |
|---|---|---|
| Comparison with Poisson distribution Blue bars denote a histogram of data divided into 1 sec bins. Red curve is a Poisson curve with rate = median count rate of data. |
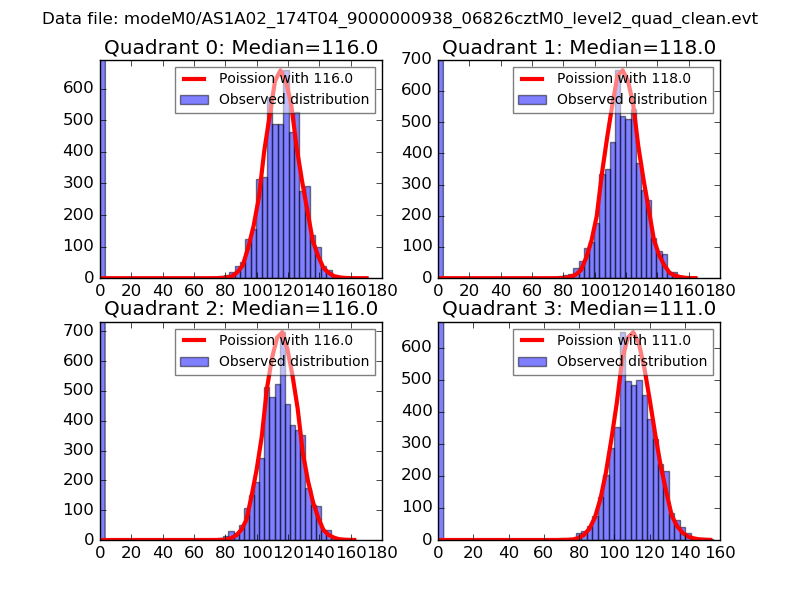 |
 |
| Quadrant-wise count rates Data is divided into 100 sec bins |
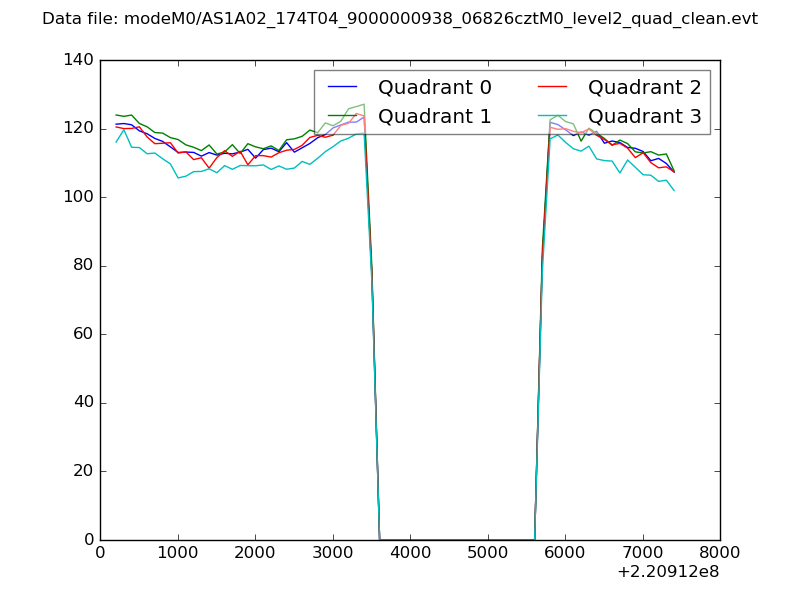 |
|
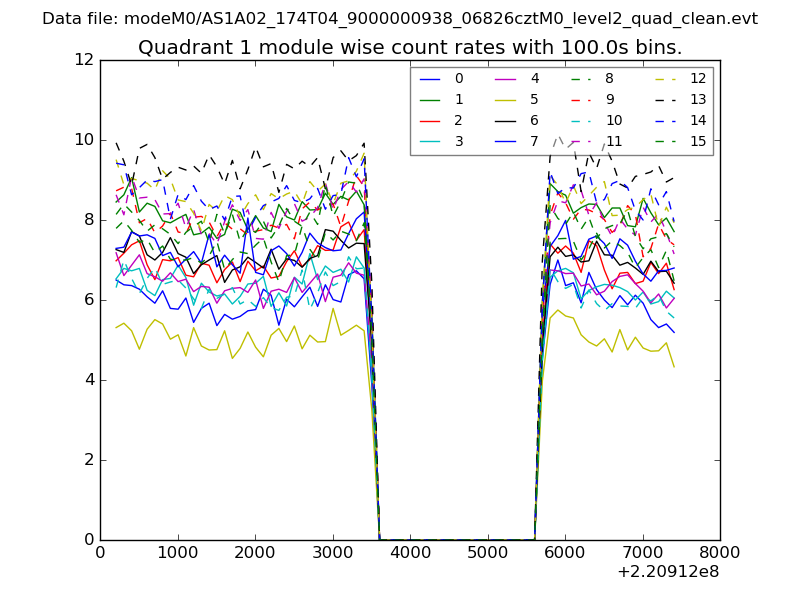
| Module-wise count rates for Quadrant A Data is divided into 100 sec bins |
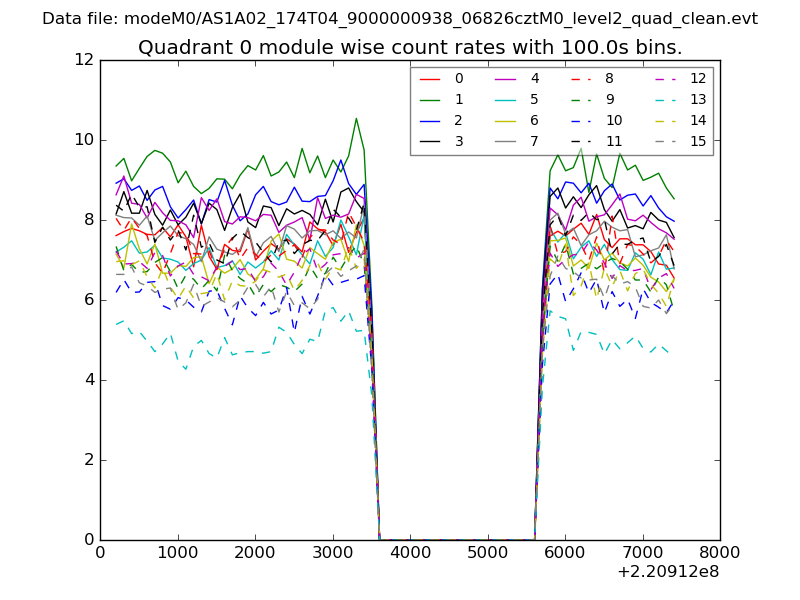 |
 |
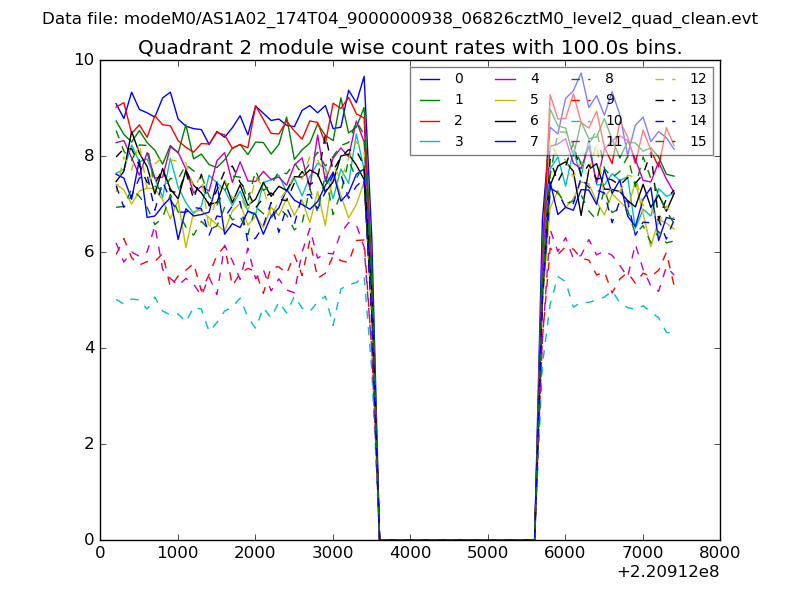
| Module-wise count rates for Quadrant B Data is divided into 100 sec bins |
 |
 |
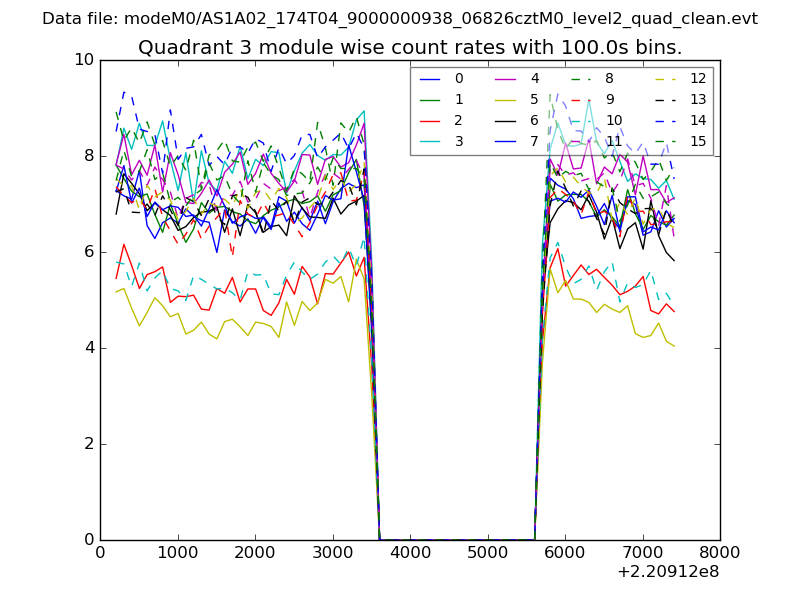
| Module-wise count rates for Quadrant C Data is divided into 100 sec bins |
 |
 |
| Module-wise count rates for Quadrant D Data is divided into 100 sec bins |
 |
 |
| Parameter | Plot |
|---|---|
| CZT HV Monitor | 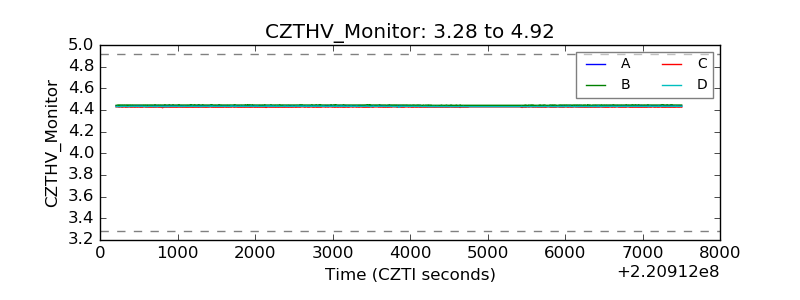 |
| D_VDD | 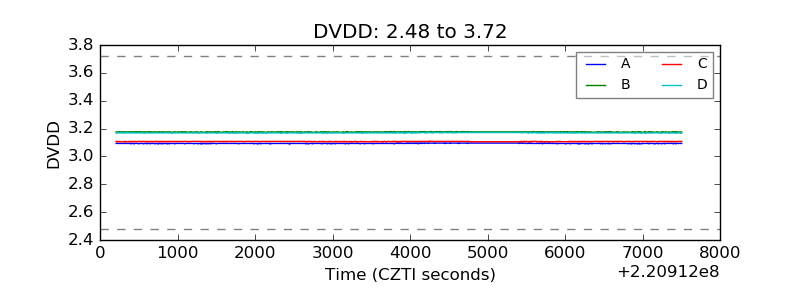 |
| Temperature 1 | 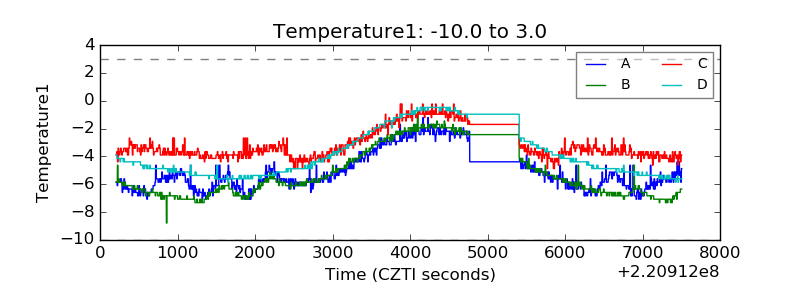 |
| Veto HV Monitor | 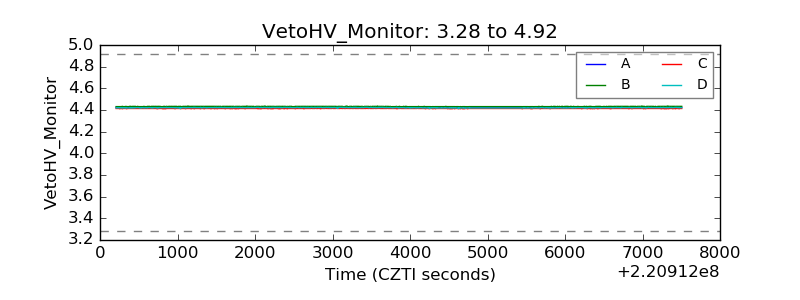 |
| Veto LLD | 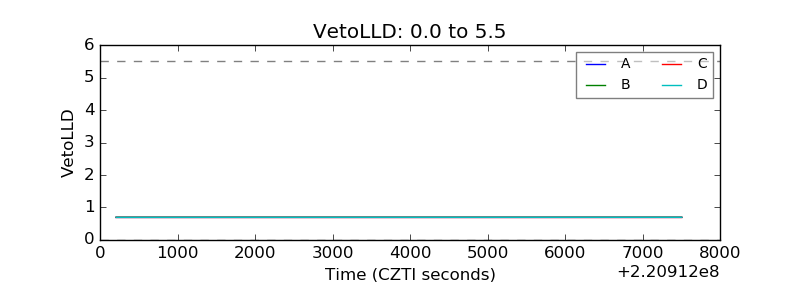 |
| Alpha Counter | 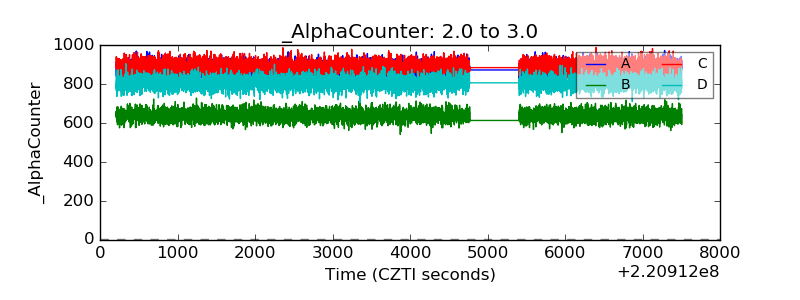 |
| _CPM_Rate | 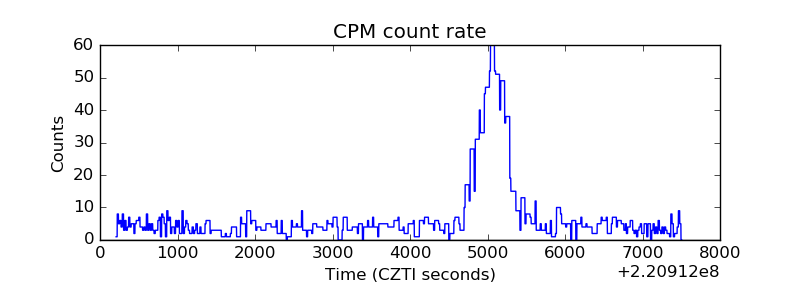 |
| CZT Counter | 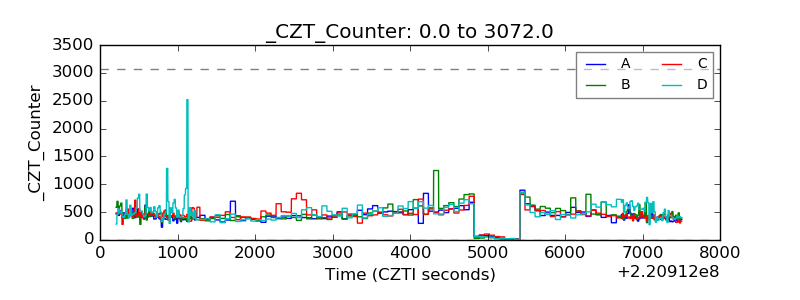 |
| +2.5 Volts monitor | 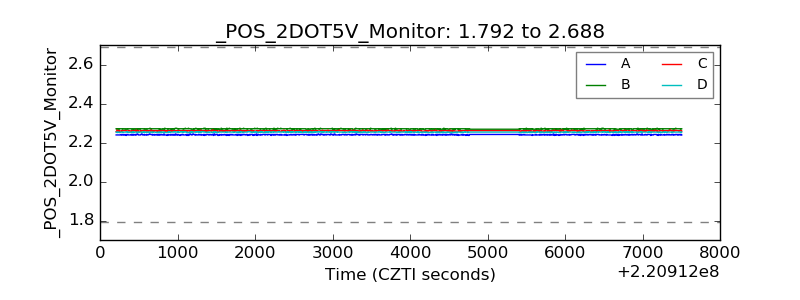 |
| +5 Volts monitor | 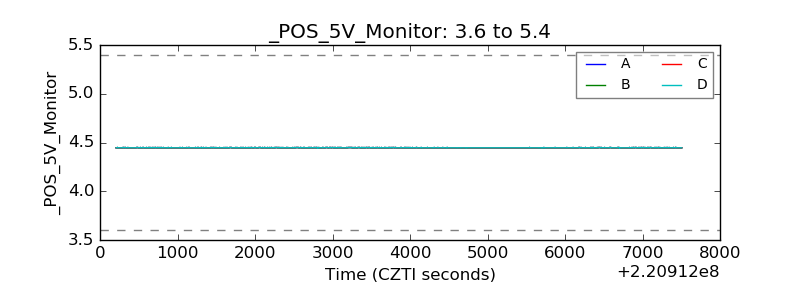 |
| _ROLL_ROT | 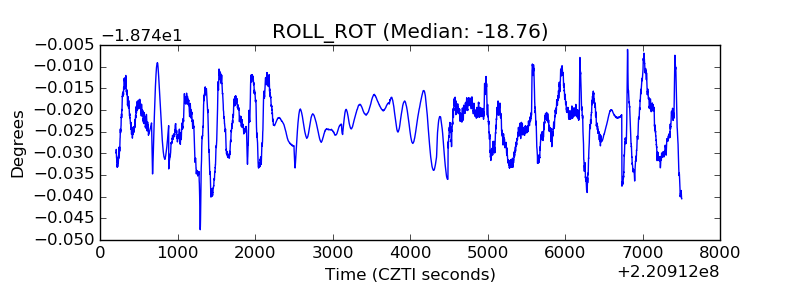 |
| _Roll_DEC | 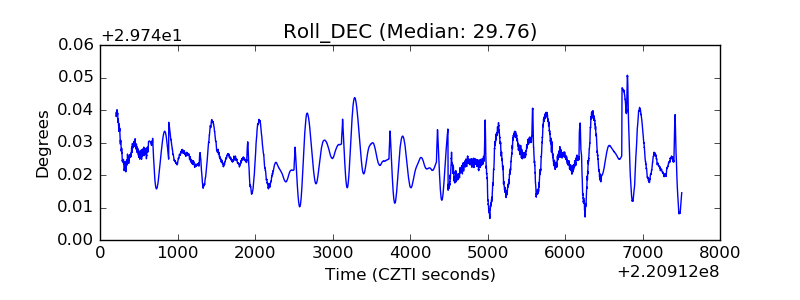 |
| _Roll_RA | 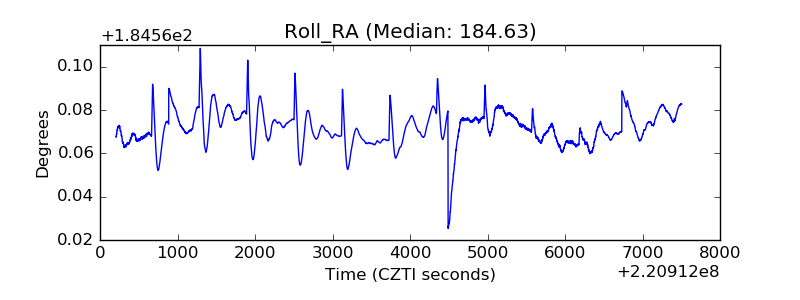 |
| Veto Counter | 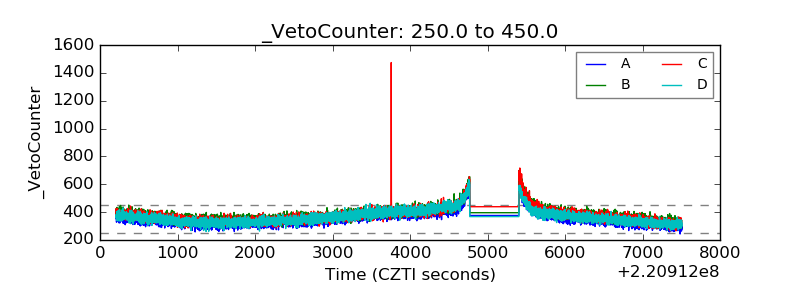 |