| Param | Original file | Final file |
|---|---|---|
| Filename | modeM0/AS1A02_174T04_9000000938_06830cztM0_level2.evt | modeM0/AS1A02_174T04_9000000938_06830cztM0_level2_quad_clean.evt |
| Size (bytes) | 554,857,920 | 63,696,960 |
| Size | 529.2 MB | 60.7 MB |
| Events in quadrant A | 3,551,160 | 371,758 |
| Events in quadrant B | 4,151,370 | 379,272 |
| Events in quadrant C | 3,482,193 | 373,185 |
| Events in quadrant D | 5,180,968 | 353,097 |
| Mode M9 | |||
|---|---|---|---|
| Quadrant | BADHDUFLAG | Total packets | Discarded packets |
| A | 0 | 13 | 0 |
| B | 0 | 13 | 0 |
| C | 0 | 13 | 0 |
| D | 0 | 13 | 0 |
| Mode M0 | |||
|---|---|---|---|
| Quadrant | BADHDUFLAG | Total packets | Discarded packets |
| A | 0 | 14660 | 2 |
| B | 0 | 16391 | 1 |
| C | 0 | 14356 | 1 |
| D | 0 | 20111 | 1 |
| Mode SS | |||
|---|---|---|---|
| Quadrant | BADHDUFLAG | Total packets | Discarded packets |
| A | 0 | 130 | 0 |
| B | 0 | 130 | 0 |
| C | 0 | 130 | 0 |
| D | 0 | 130 | 0 |
| Quadrant | Total seconds | Saturated seconds | Saturation percentage |
|---|---|---|---|
| A | 6472 | 127 | 1.962299% |
| B | 6472 | 338 | 5.222497% |
| C | 6472 | 101 | 1.560569% |
| D | 6472 | 267 | 4.125464% |
Noise dominated data is calculated using 1-second bins in cleaned event files. If a bin has >2000 counts, and if more than 50% of those come from <1% of pixels, then it is considered to be noise-dominated and hence unusable.
| Quadrant | # 1 sec bins | Bins with >0 counts | Bins with >2000 counts | High rate bins dominated by noise | Noise dominated (total time) | Noise dominated (detector-on time) | Marked lightcurve |
|---|---|---|---|---|---|---|---|
| A | 7727 | 6473 | 31 | 31 | 0.40% | 0.48% | 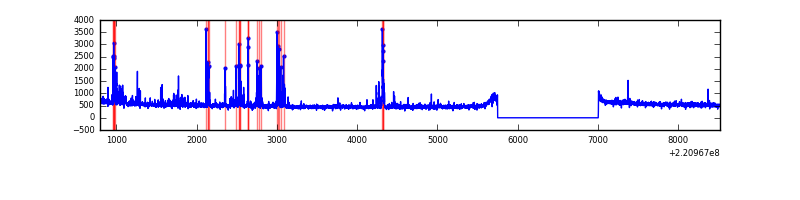 |
| B | 7727 | 6473 | 212 | 212 | 2.74% | 3.28% | 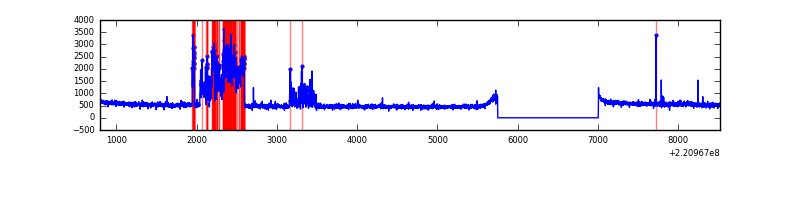 |
| C | 7727 | 6473 | 20 | 20 | 0.26% | 0.31% | 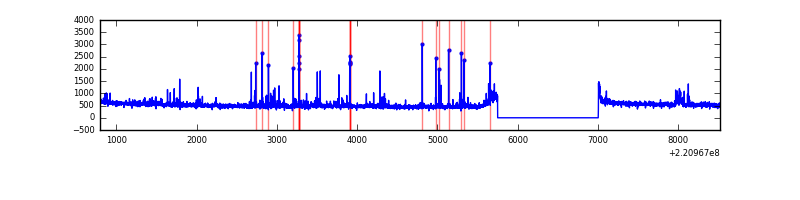 |
| D | 7727 | 6473 | 161 | 161 | 2.08% | 2.49% | 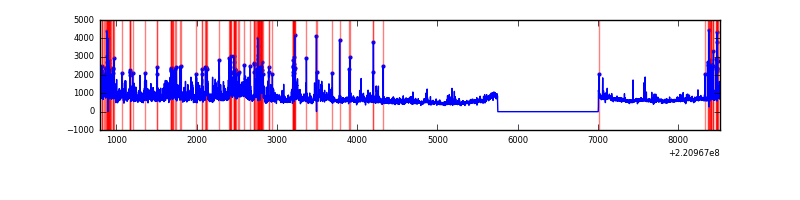 |
Top three noisy pixels from each quadrant. If the there are fewer than three noisy pixels in the level2.evt file, extra rows are filled as -1
| Pixel properties | Quadrant properties | ||||||
|---|---|---|---|---|---|---|---|
| Quadrant | DetID | PixID | Counts | Sigma | Mean | Median | Sigma |
| A | 8 | 15 | 331197 | 1943.34 | 837 | 821 | 170.0 |
| A | 12 | 194 | 8118 | 42.92 | 837 | 821 | 170.0 |
| A | 0 | 226 | 8050 | 42.52 | 837 | 821 | 170.0 |
| B | 0 | 228 | 879796 | 5628.27 | 829 | 811 | 156.2 |
| B | 0 | 214 | 35188 | 220.12 | 829 | 811 | 156.2 |
| B | 12 | 111 | 14853 | 89.91 | 829 | 811 | 156.2 |
| C | 12 | 16 | 164696 | 873.24 | 816 | 821 | 187.7 |
| C | 9 | 247 | 46940 | 245.76 | 816 | 821 | 187.7 |
| C | 9 | 16 | 33681 | 175.1 | 816 | 821 | 187.7 |
| D | 12 | 233 | 711858 | 3583.79 | 811 | 785 | 198.4 |
| D | 8 | 195 | 625688 | 3149.49 | 811 | 785 | 198.4 |
| D | 2 | 33 | 345888 | 1739.31 | 811 | 785 | 198.4 |
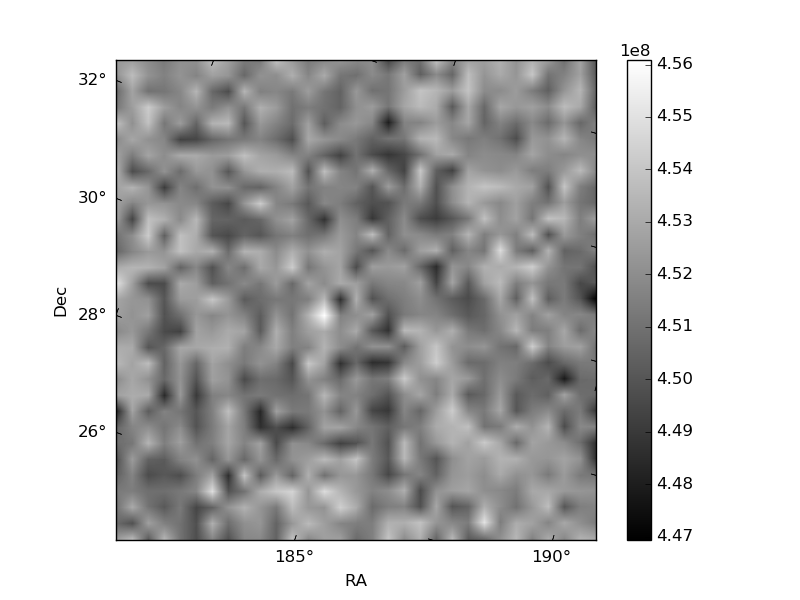
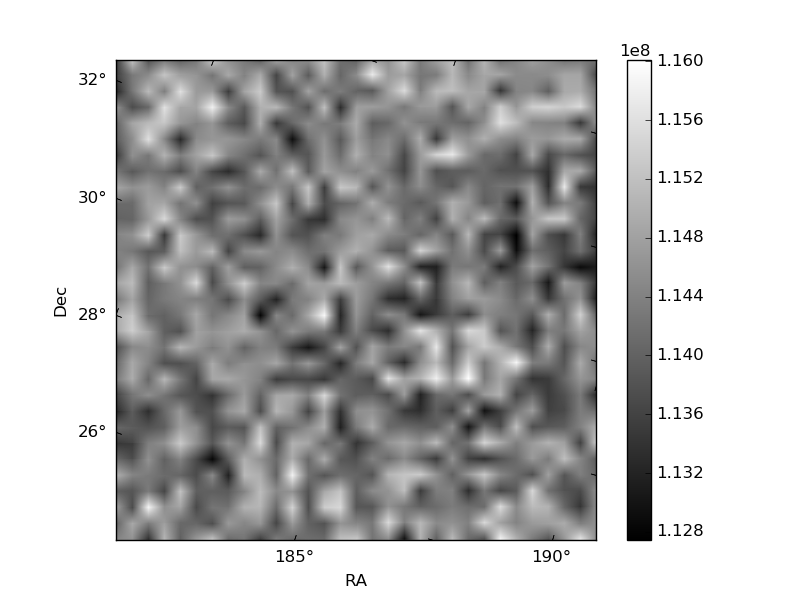
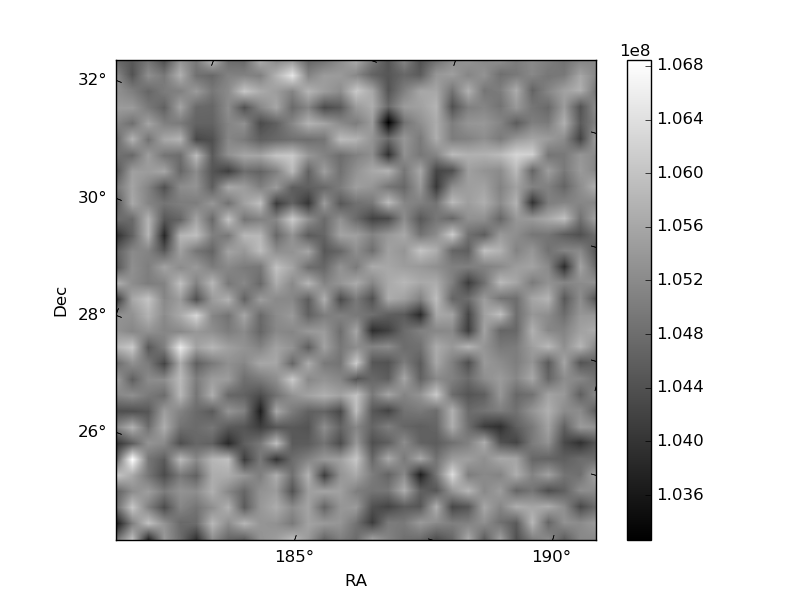
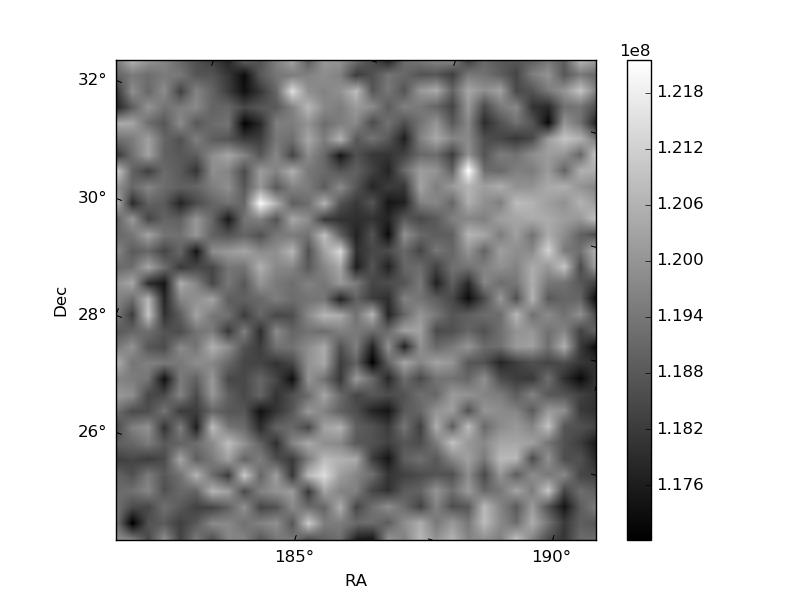
Histogram calculated using DETX and DETY for each event in the final _common_clean file
| Quadrant A | 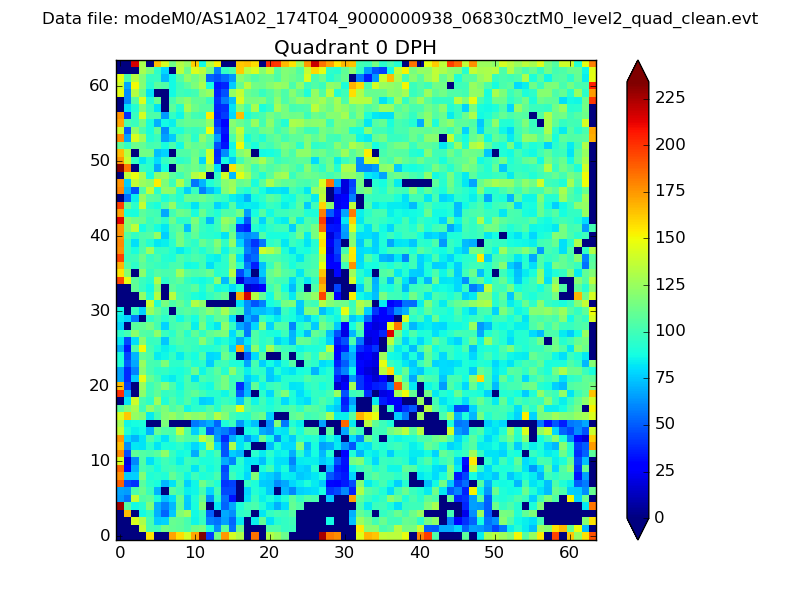 |
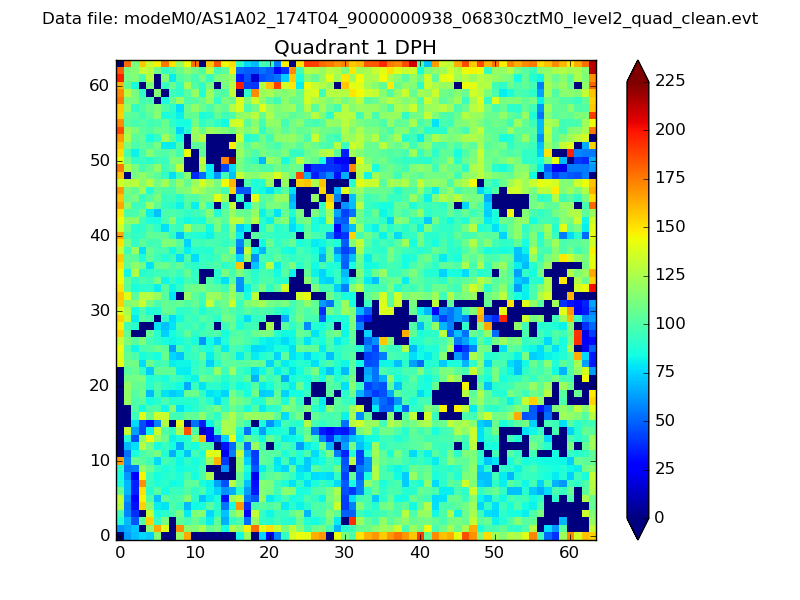 |
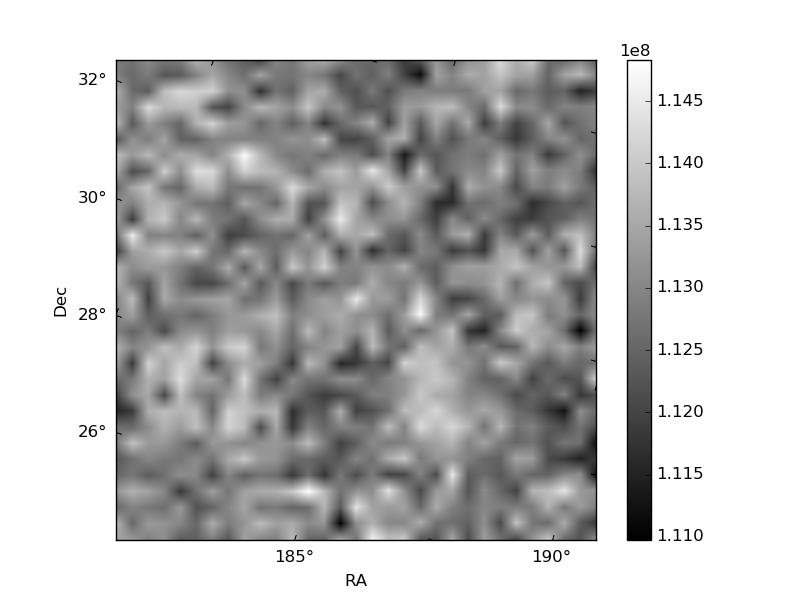
Quadrant B |
|---|---|---|---|
| Quadrant D | 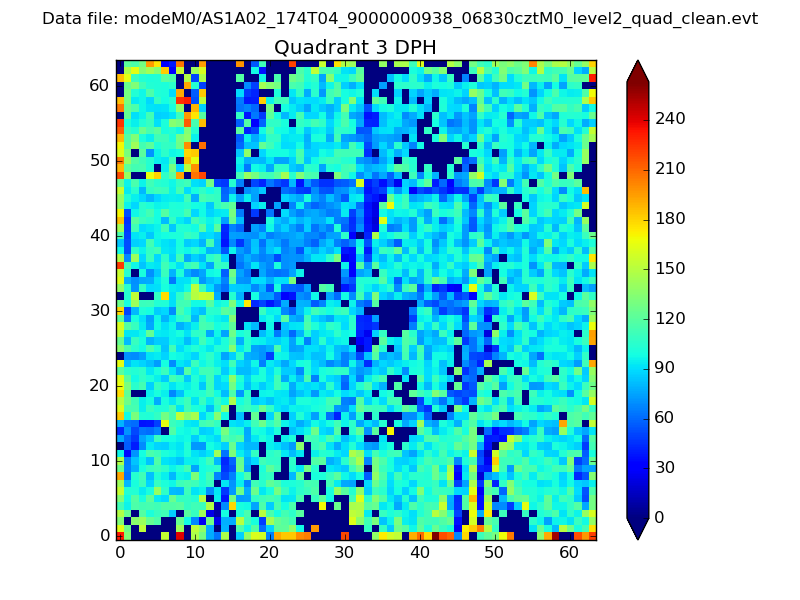 |
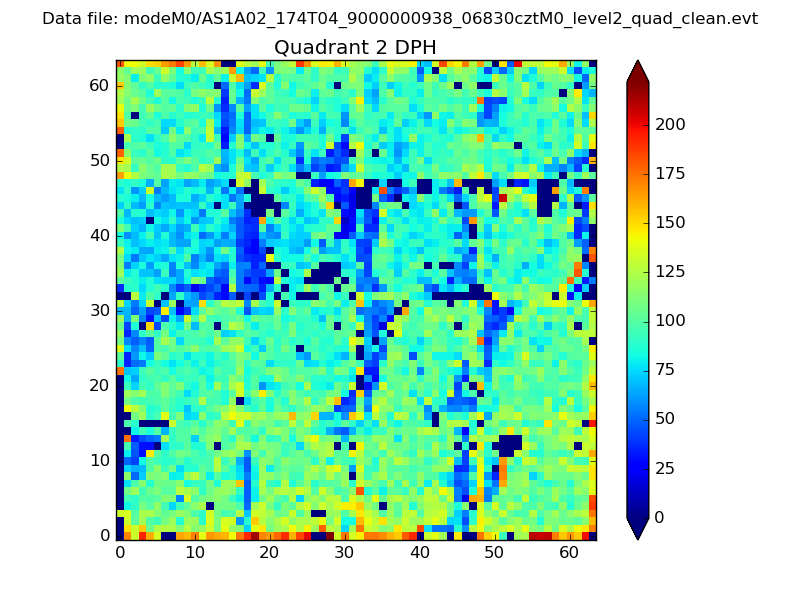 |
Quadrant C |
| Plot type | Count rate plots | Images |
|---|---|---|
| Comparison with Poisson distribution Blue bars denote a histogram of data divided into 1 sec bins. Red curve is a Poisson curve with rate = median count rate of data. |
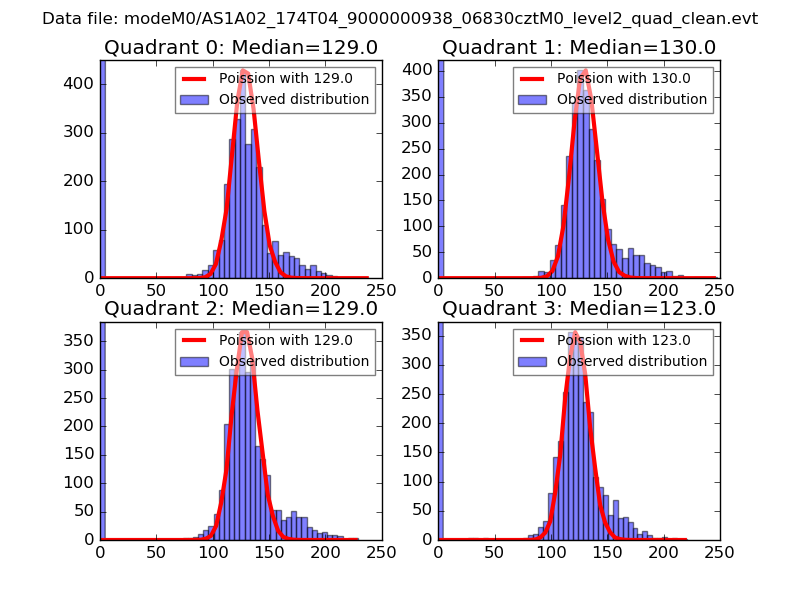 |
 |
| Quadrant-wise count rates Data is divided into 100 sec bins |
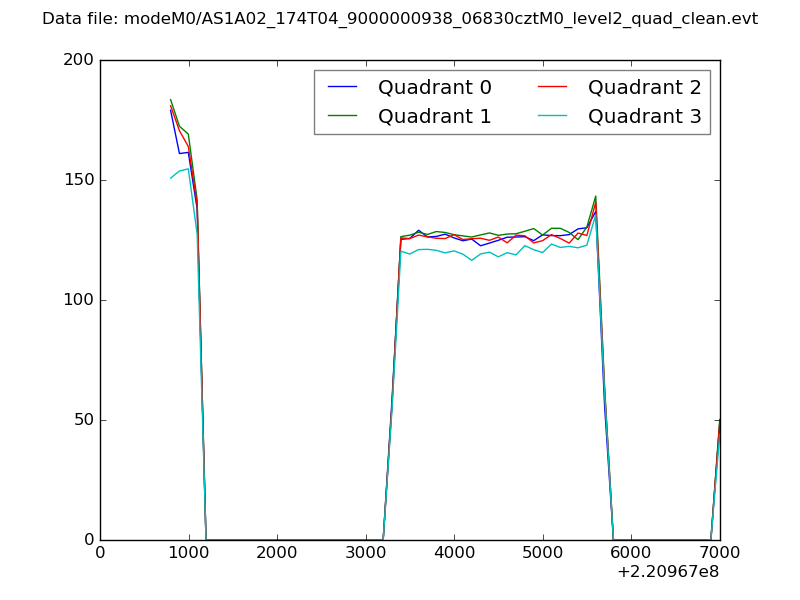 |
|
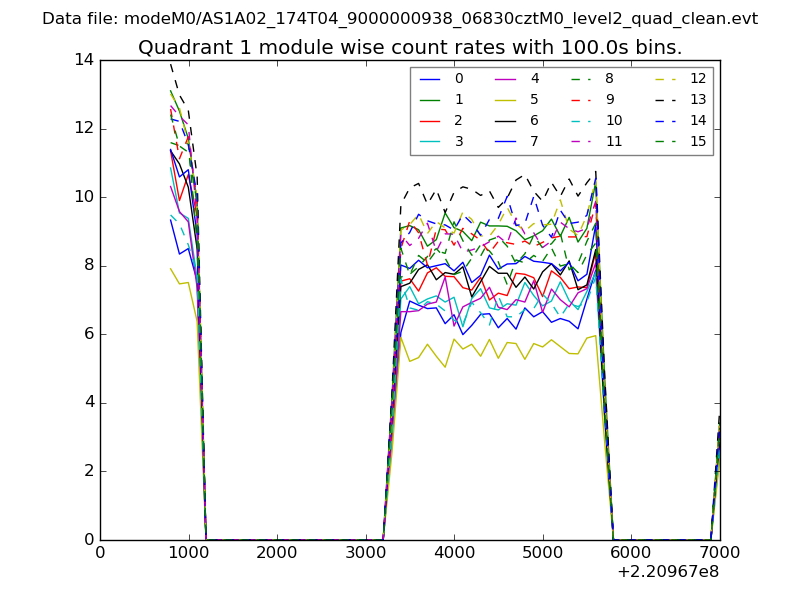
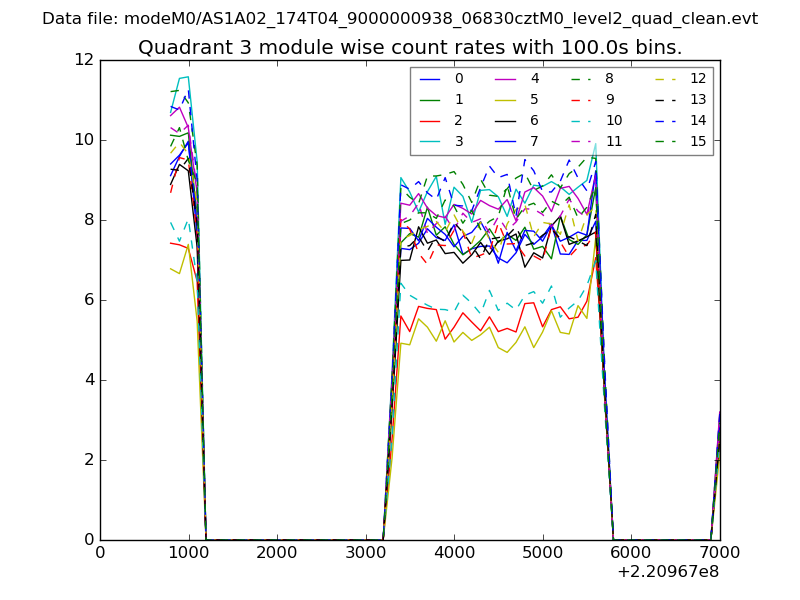
| Module-wise count rates for Quadrant A Data is divided into 100 sec bins |
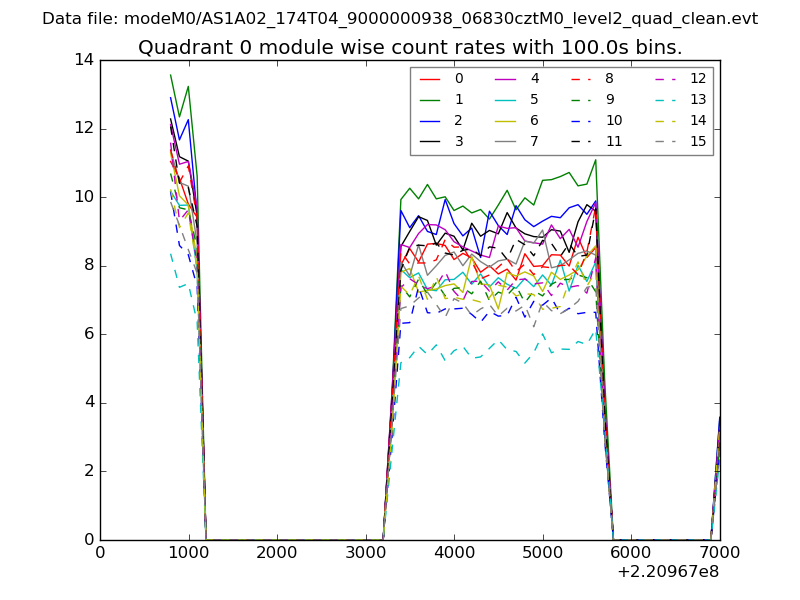 |
 |
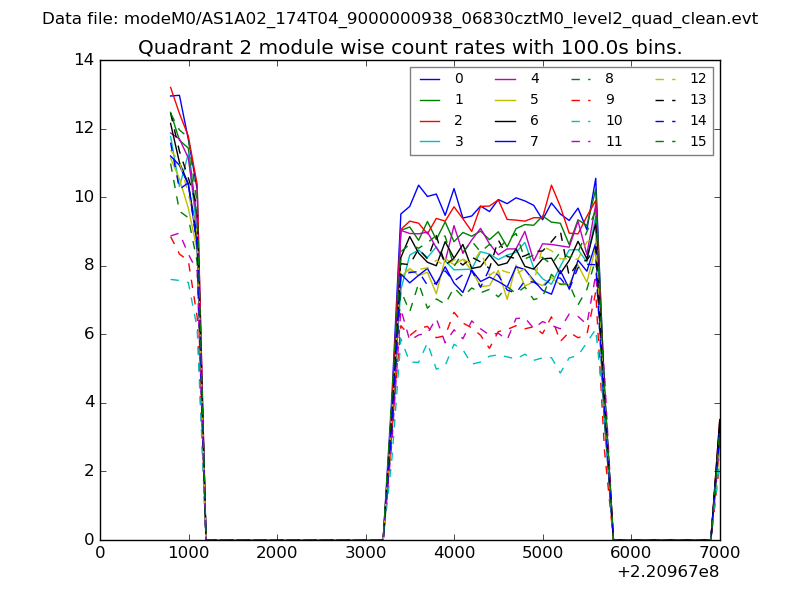
| Module-wise count rates for Quadrant B Data is divided into 100 sec bins |
 |
 |
| Module-wise count rates for Quadrant C Data is divided into 100 sec bins |
 |
 |
| Module-wise count rates for Quadrant D Data is divided into 100 sec bins |
 |
 |
| Parameter | Plot |
|---|---|
| CZT HV Monitor | 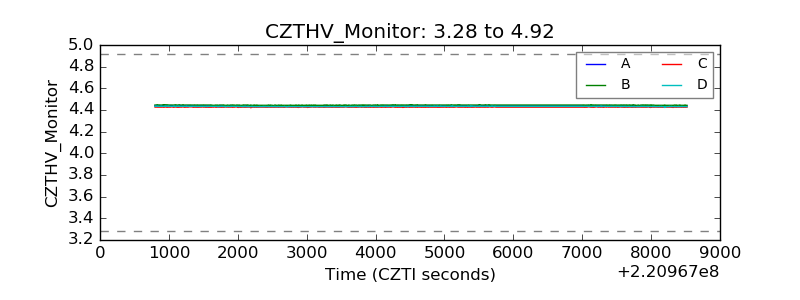 |
| D_VDD | 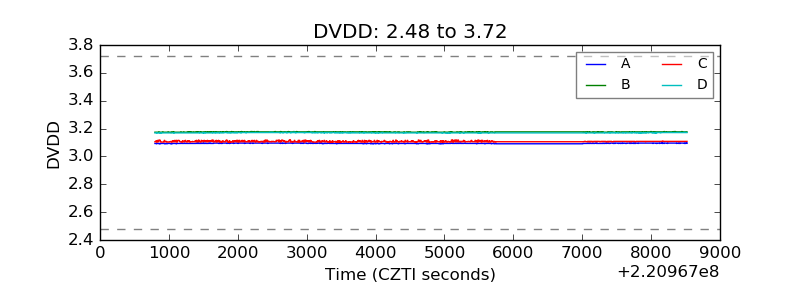 |
| Temperature 1 | 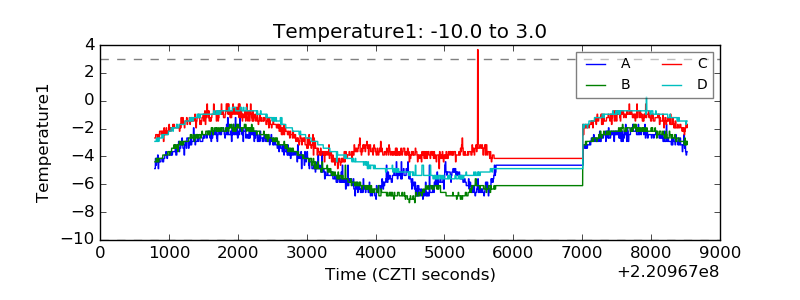 |
| Veto HV Monitor | 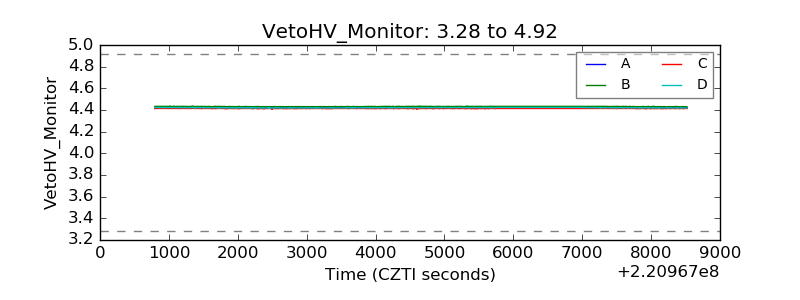 |
| Veto LLD | 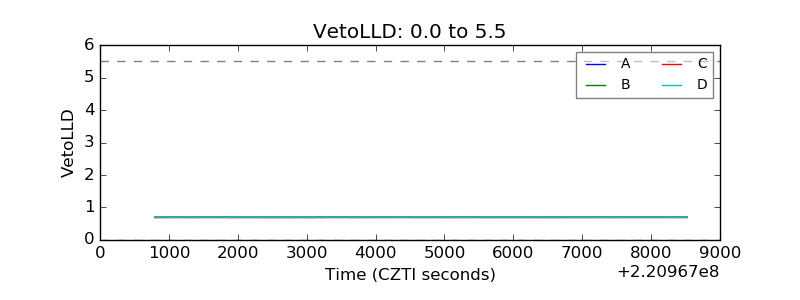 |
| Alpha Counter | 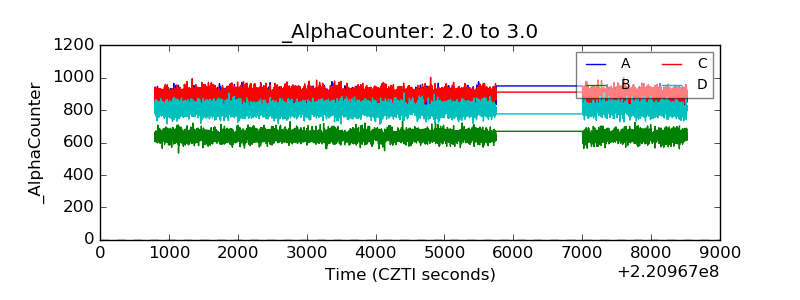 |
| _CPM_Rate | 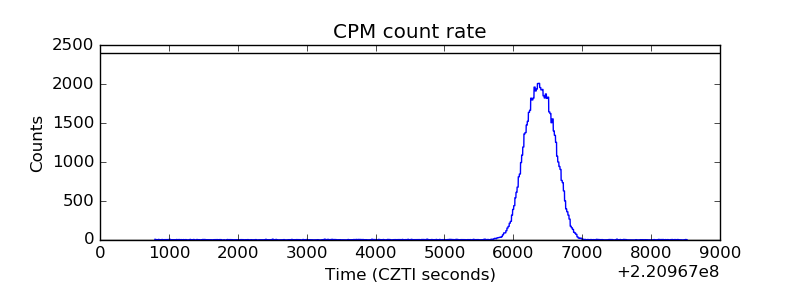 |
| CZT Counter | 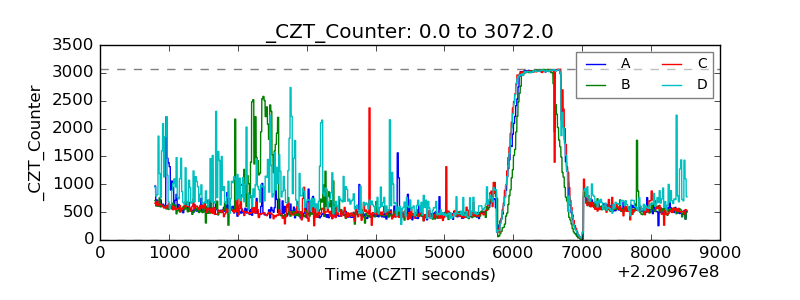 |
| +2.5 Volts monitor |  |
| +5 Volts monitor | 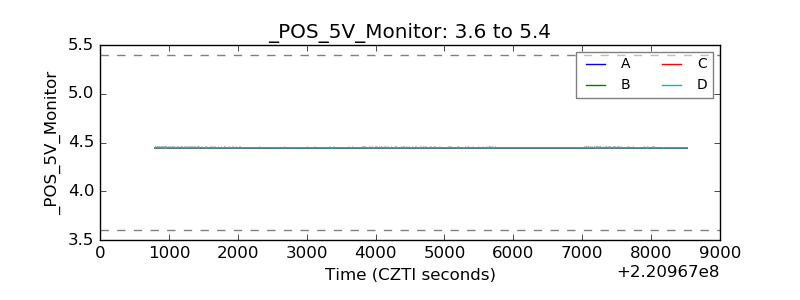 |
| _ROLL_ROT | 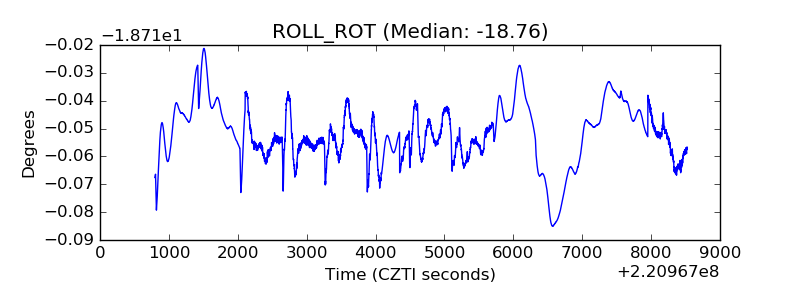 |
| _Roll_DEC | 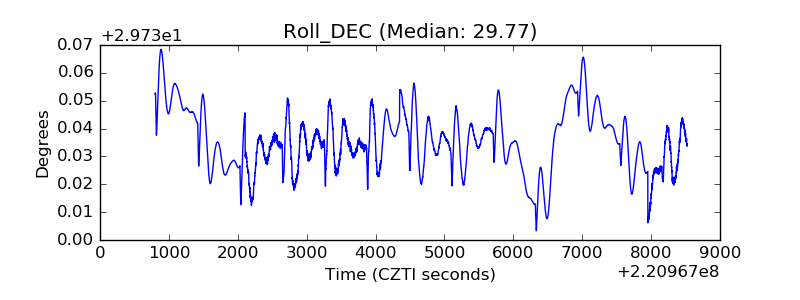 |
| _Roll_RA | 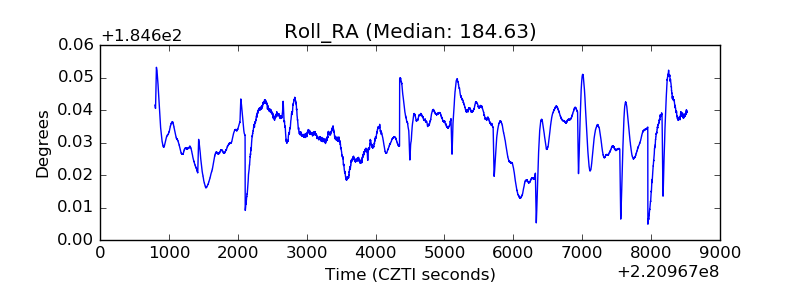 |
| Veto Counter | 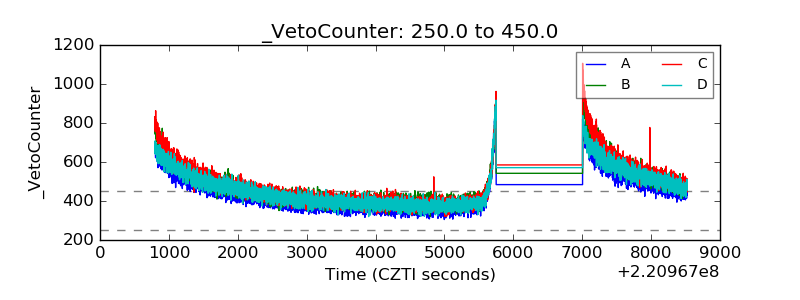 |