| Param | Original file | Final file |
|---|---|---|
| Filename | modeM0/AS1A02_174T04_9000000938_06832cztM0_level2.evt | modeM0/AS1A02_174T04_9000000938_06832cztM0_level2_quad_clean.evt |
| Size (bytes) | 521,136,000 | 66,879,360 |
| Size | 497.0 MB | 63.8 MB |
| Events in quadrant A | 3,142,585 | 398,552 |
| Events in quadrant B | 3,535,332 | 405,845 |
| Events in quadrant C | 3,518,967 | 402,398 |
| Events in quadrant D | 5,164,688 | 384,627 |
| Mode M9 | |||
|---|---|---|---|
| Quadrant | BADHDUFLAG | Total packets | Discarded packets |
| A | 0 | 13 | 0 |
| B | 0 | 13 | 0 |
| C | 0 | 13 | 0 |
| D | 0 | 13 | 0 |
| Mode M0 | |||
|---|---|---|---|
| Quadrant | BADHDUFLAG | Total packets | Discarded packets |
| A | 0 | 13343 | 3 |
| B | 0 | 14604 | 2 |
| C | 0 | 14317 | 2 |
| D | 0 | 19781 | 2 |
| Mode SS | |||
|---|---|---|---|
| Quadrant | BADHDUFLAG | Total packets | Discarded packets |
| A | 0 | 128 | 0 |
| B | 0 | 128 | 0 |
| C | 0 | 128 | 0 |
| D | 0 | 128 | 0 |
| Quadrant | Total seconds | Saturated seconds | Saturation percentage |
|---|---|---|---|
| A | 6203 | 37 | 0.596486% |
| B | 6203 | 183 | 2.950185% |
| C | 6203 | 70 | 1.128486% |
| D | 6204 | 451 | 7.269504% |
Noise dominated data is calculated using 1-second bins in cleaned event files. If a bin has >2000 counts, and if more than 50% of those come from <1% of pixels, then it is considered to be noise-dominated and hence unusable.
| Quadrant | # 1 sec bins | Bins with >0 counts | Bins with >2000 counts | High rate bins dominated by noise | Noise dominated (total time) | Noise dominated (detector-on time) | Marked lightcurve |
|---|---|---|---|---|---|---|---|
| A | 7553 | 6204 | 6 | 6 | 0.08% | 0.10% | 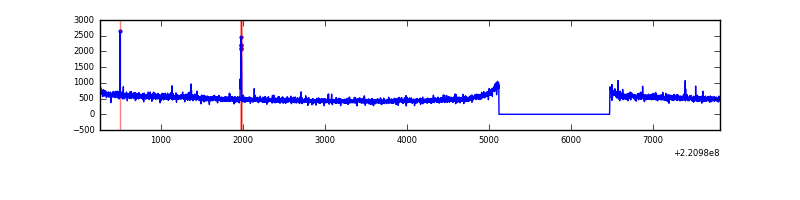 |
| B | 7553 | 6204 | 95 | 95 | 1.26% | 1.53% | 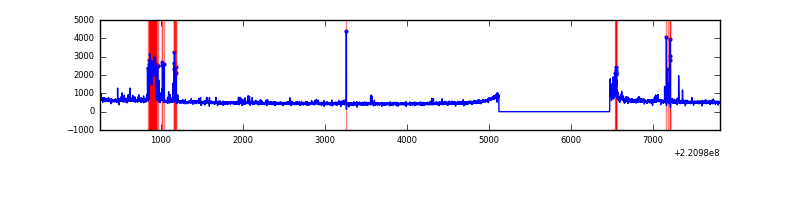 |
| C | 7553 | 6204 | 29 | 29 | 0.38% | 0.47% | 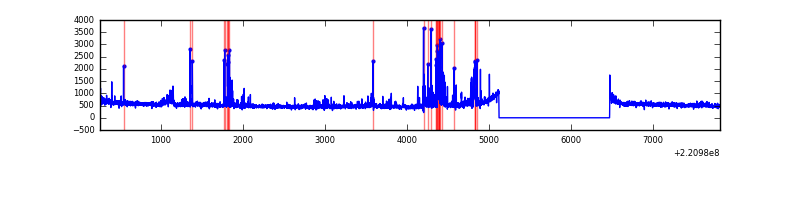 |
| D | 7554 | 6205 | 349 | 349 | 4.62% | 5.62% | 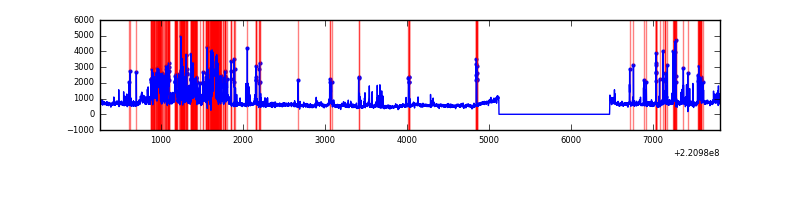 |
Top three noisy pixels from each quadrant. If the there are fewer than three noisy pixels in the level2.evt file, extra rows are filled as -1
| Pixel properties | Quadrant properties | ||||||
|---|---|---|---|---|---|---|---|
| Quadrant | DetID | PixID | Counts | Sigma | Mean | Median | Sigma |
| A | 8 | 15 | 46916 | 287.05 | 794 | 778 | 160.7 |
| A | 15 | 239 | 22241 | 133.53 | 794 | 778 | 160.7 |
| A | 13 | 248 | 10826 | 62.51 | 794 | 778 | 160.7 |
| B | 0 | 228 | 262128 | 1753.08 | 795 | 780 | 149.1 |
| B | 0 | 219 | 111077 | 739.86 | 795 | 780 | 149.1 |
| B | 0 | 214 | 48902 | 322.79 | 795 | 780 | 149.1 |
| C | 9 | 68 | 214602 | 1187.04 | 781 | 785 | 180.1 |
| C | 12 | 16 | 155687 | 859.96 | 781 | 785 | 180.1 |
| C | 9 | 247 | 67542 | 370.61 | 781 | 785 | 180.1 |
| D | 2 | 33 | 773731 | 4142.28 | 761 | 738 | 186.6 |
| D | 8 | 195 | 715152 | 3828.37 | 761 | 738 | 186.6 |
| D | 2 | 216 | 528684 | 2829.13 | 761 | 738 | 186.6 |
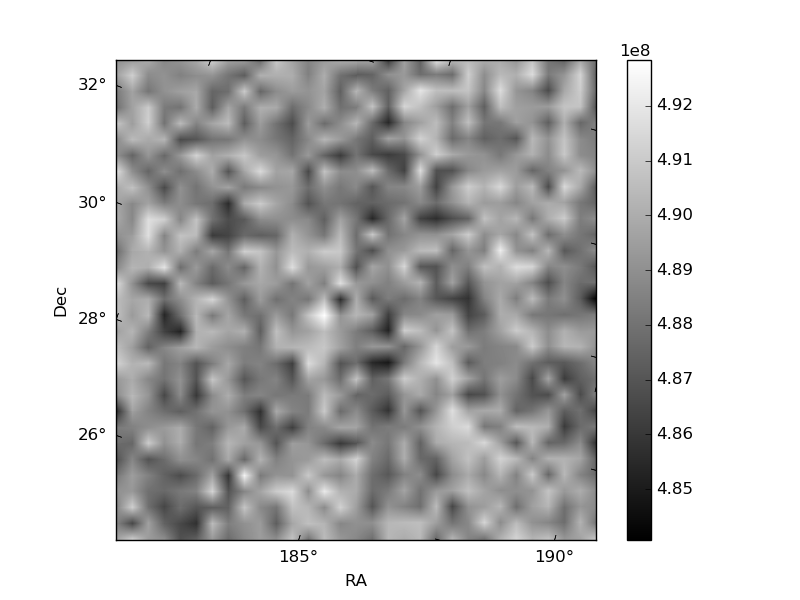
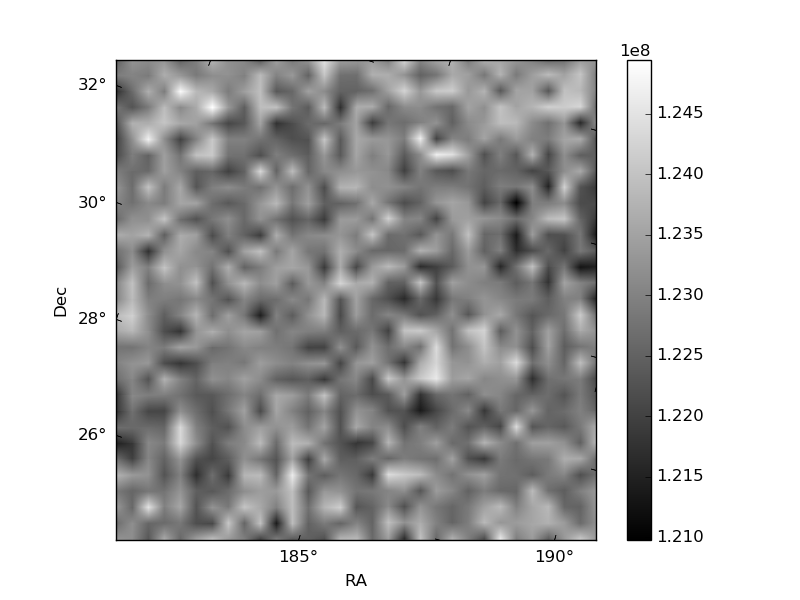
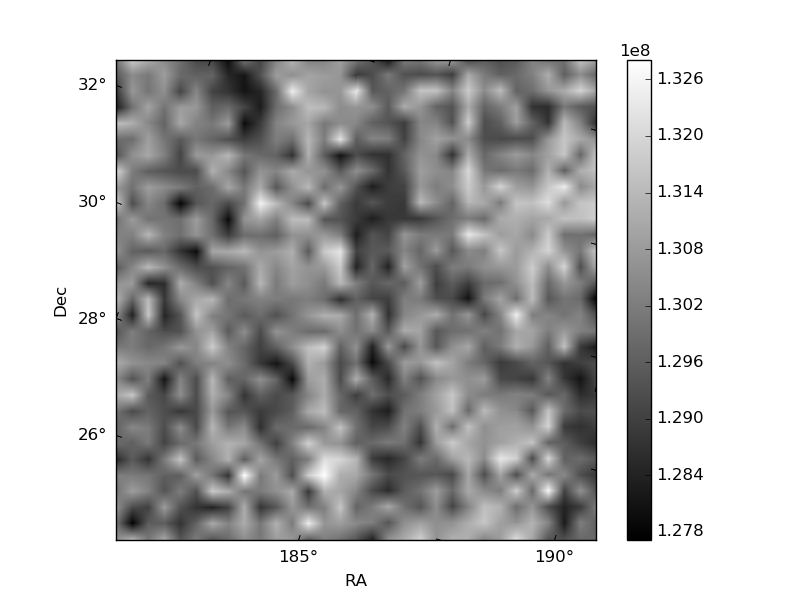
Histogram calculated using DETX and DETY for each event in the final _common_clean file
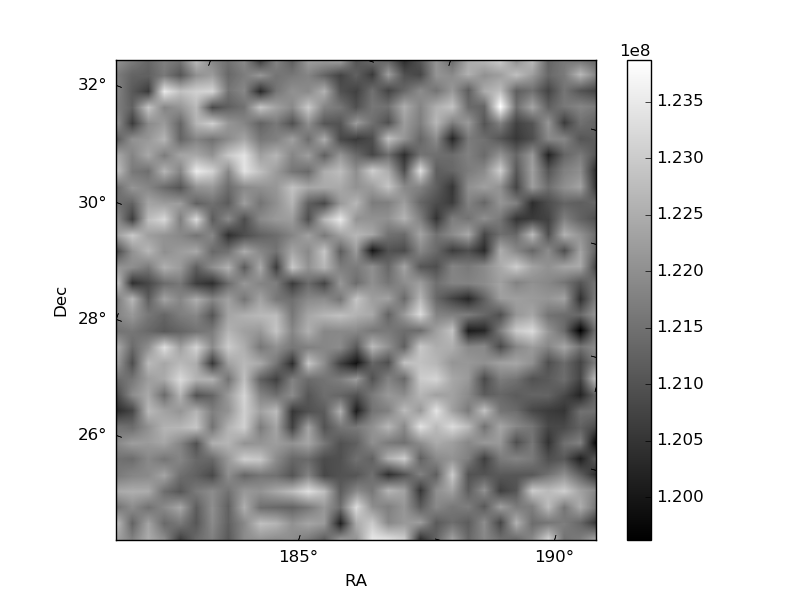
| Quadrant A | 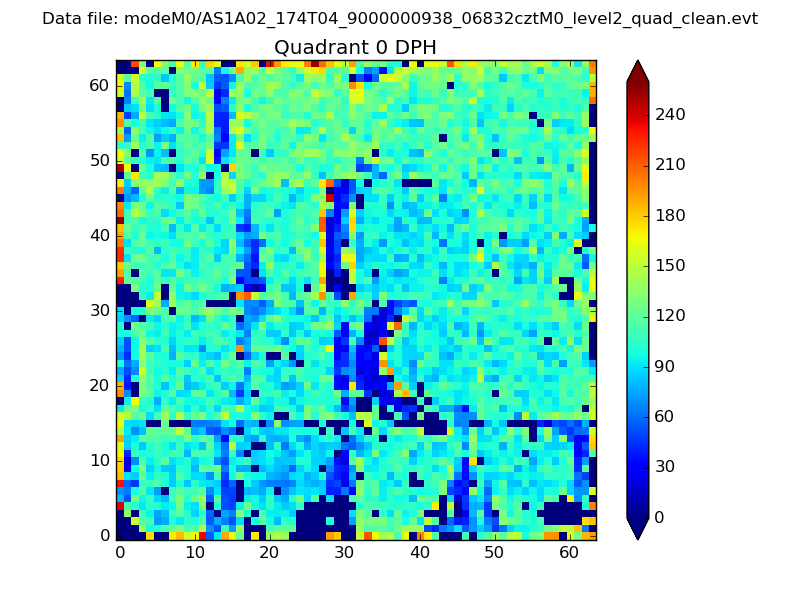 |
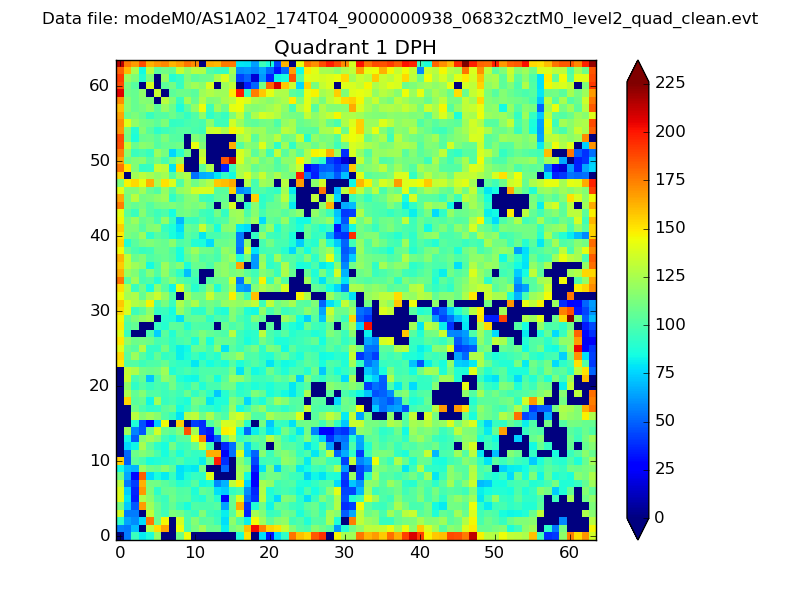 |
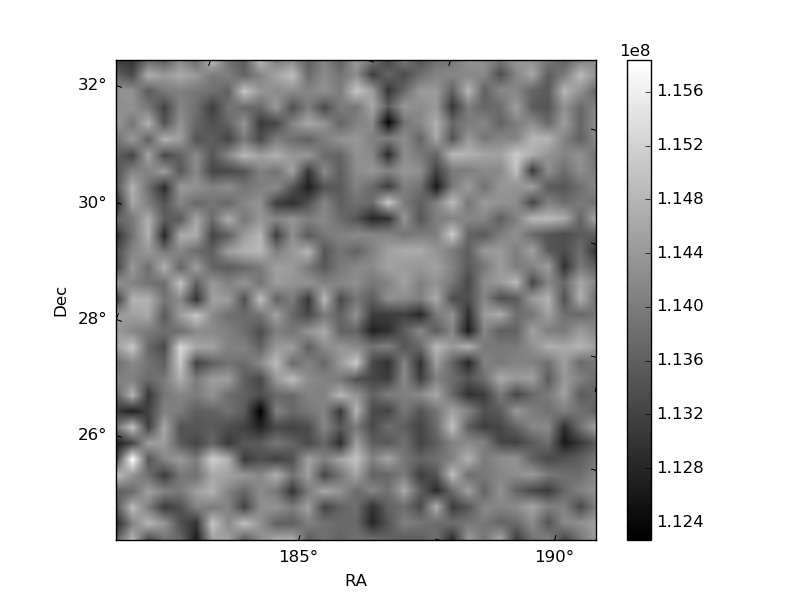
Quadrant B |
|---|---|---|---|
| Quadrant D | 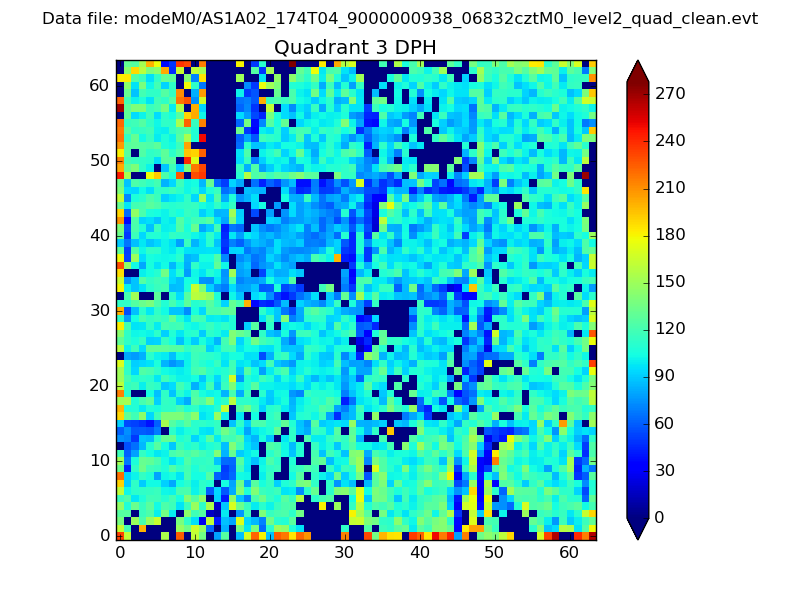 |
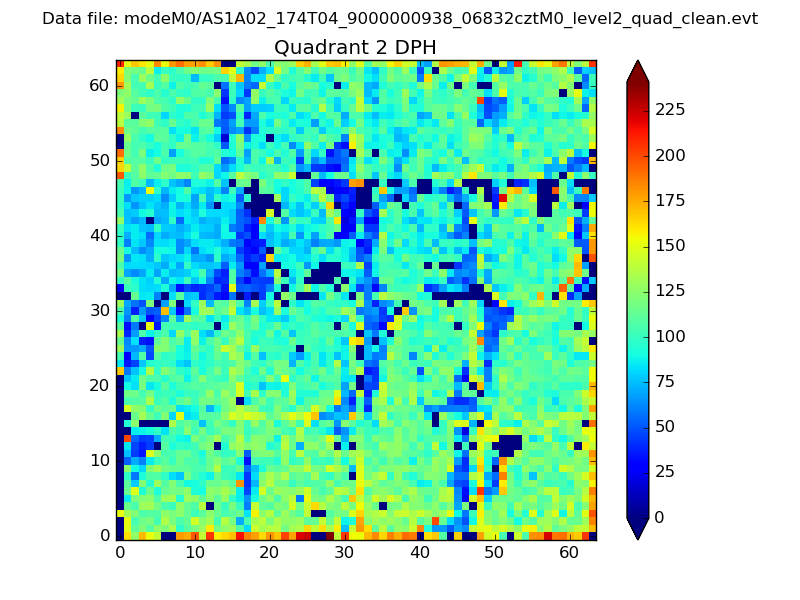 |
Quadrant C |
| Plot type | Count rate plots | Images |
|---|---|---|
| Comparison with Poisson distribution Blue bars denote a histogram of data divided into 1 sec bins. Red curve is a Poisson curve with rate = median count rate of data. |
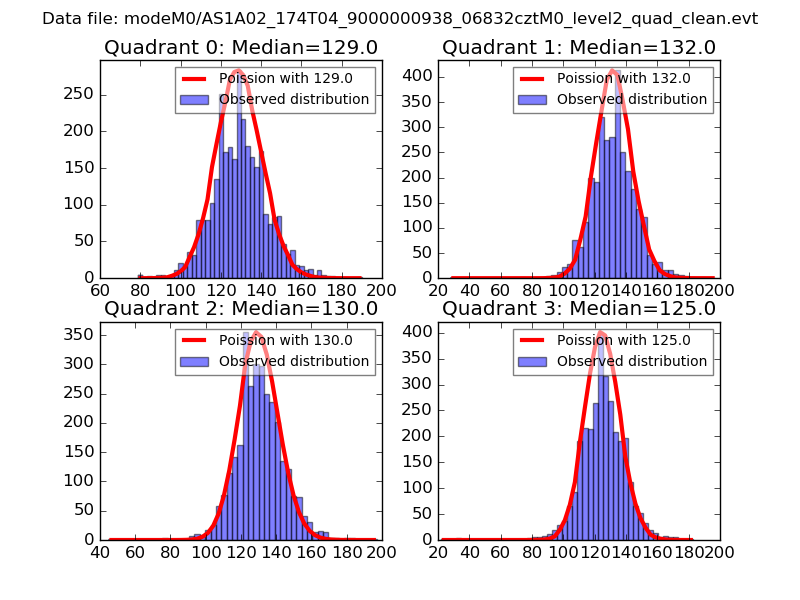 |
 |
| Quadrant-wise count rates Data is divided into 100 sec bins |
 |
|
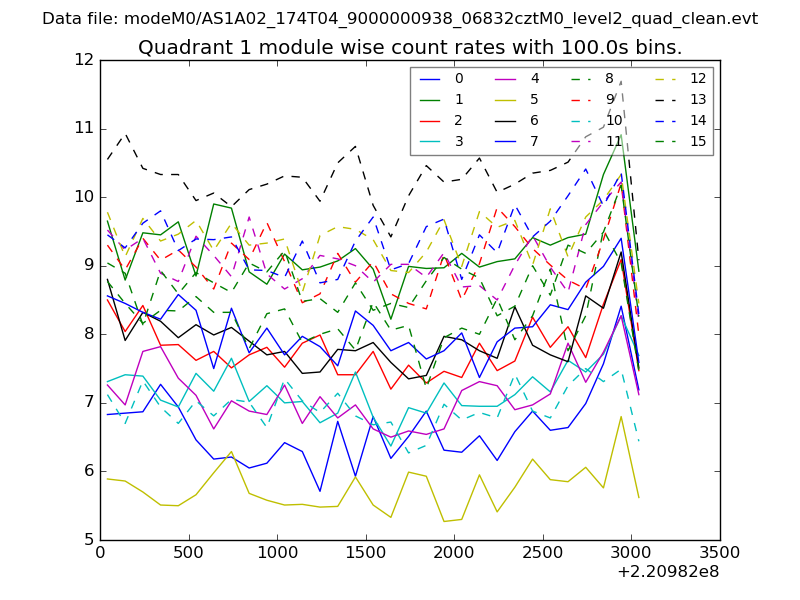
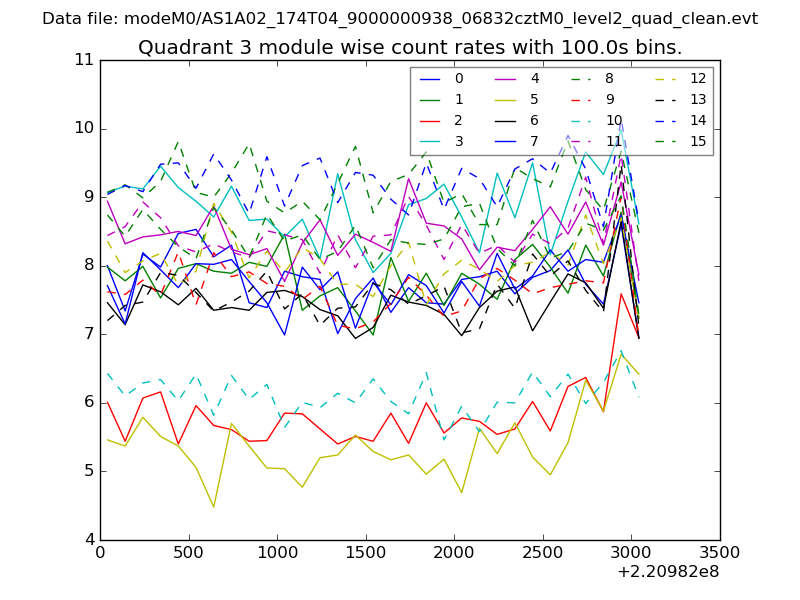
| Module-wise count rates for Quadrant A Data is divided into 100 sec bins |
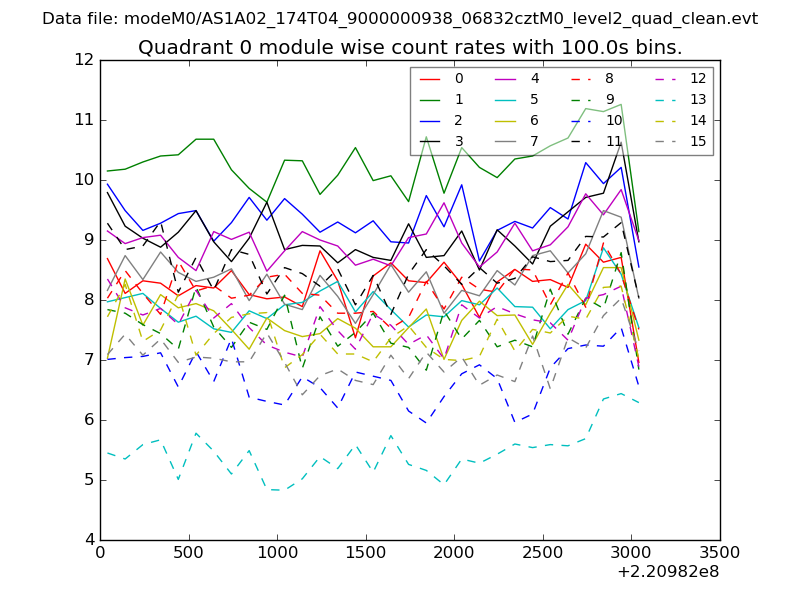 |
 |
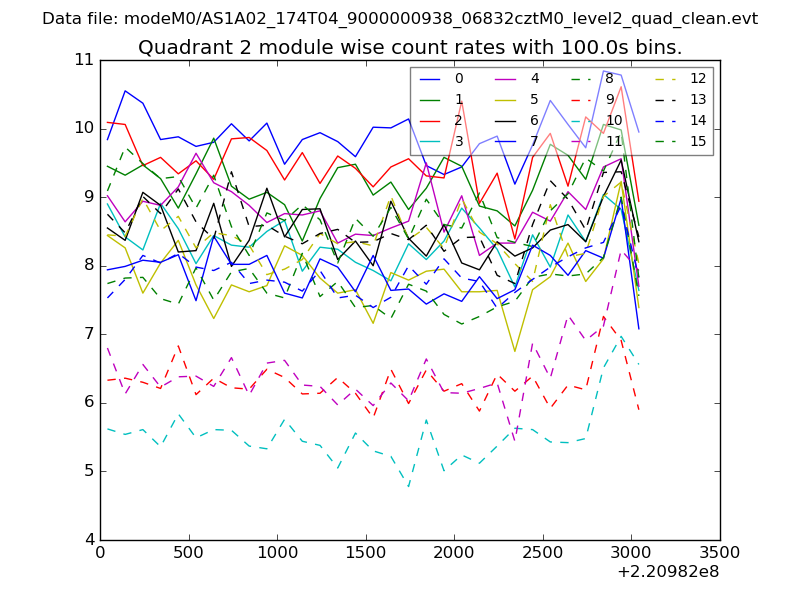
| Module-wise count rates for Quadrant B Data is divided into 100 sec bins |
 |
 |
| Module-wise count rates for Quadrant C Data is divided into 100 sec bins |
 |
 |
| Module-wise count rates for Quadrant D Data is divided into 100 sec bins |
 |
 |
| Parameter | Plot |
|---|---|
| CZT HV Monitor | 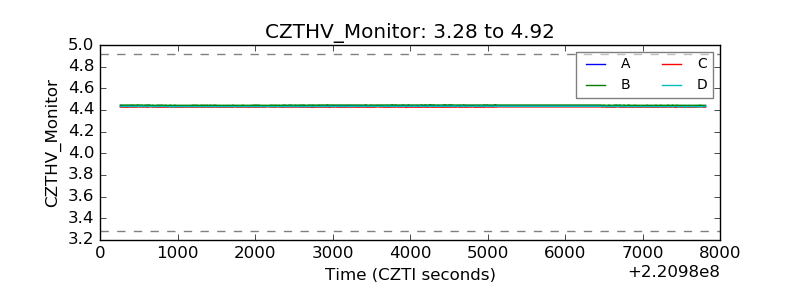 |
| D_VDD | 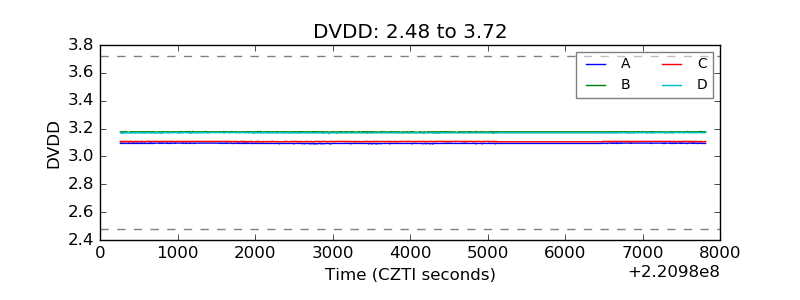 |
| Temperature 1 | 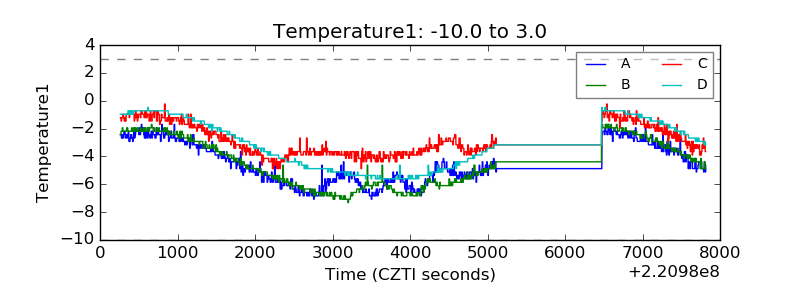 |
| Veto HV Monitor | 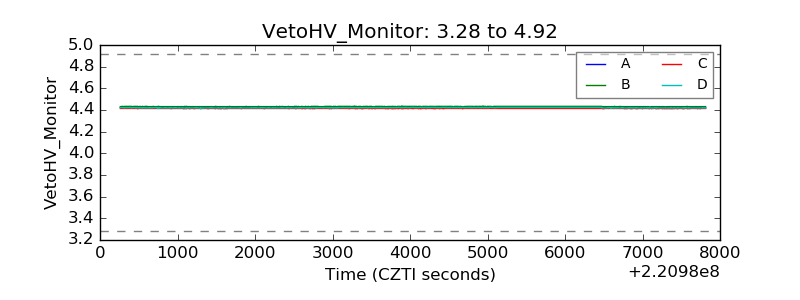 |
| Veto LLD | 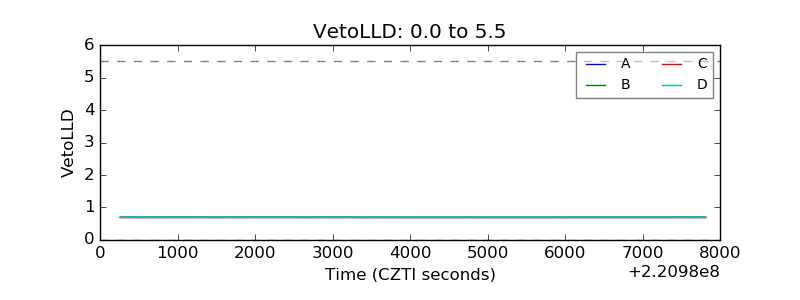 |
| Alpha Counter |  |
| _CPM_Rate | 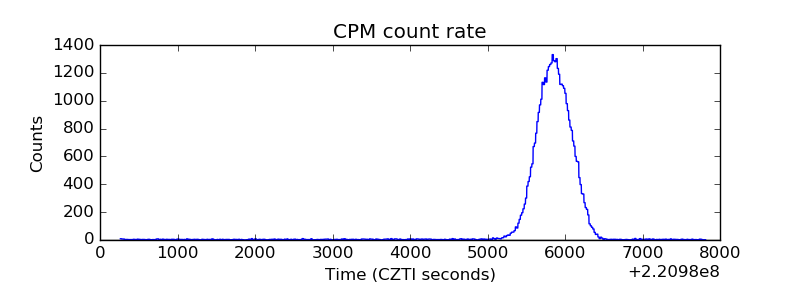 |
| CZT Counter | 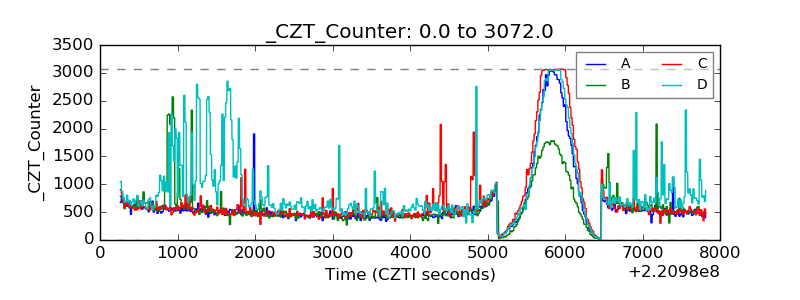 |
| +2.5 Volts monitor |  |
| +5 Volts monitor |  |
| _ROLL_ROT | 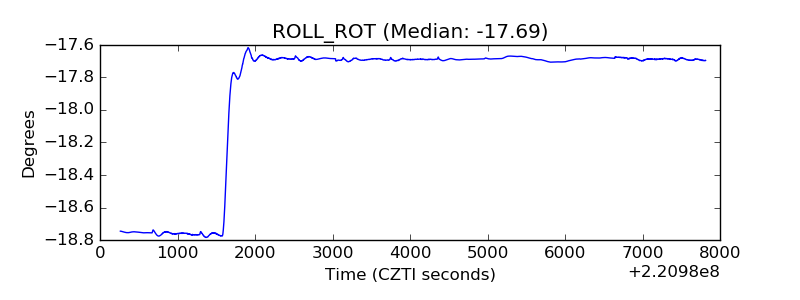 |
| _Roll_DEC |  |
| _Roll_RA | 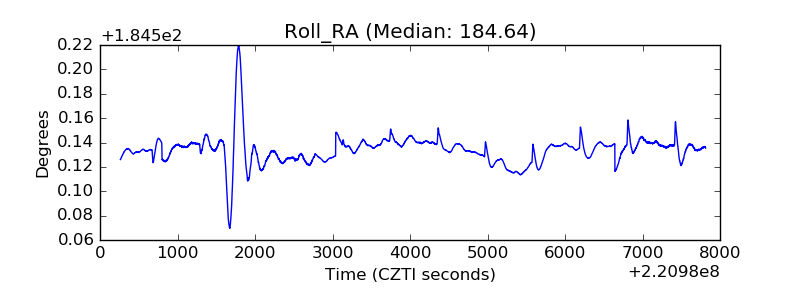 |
| Veto Counter | 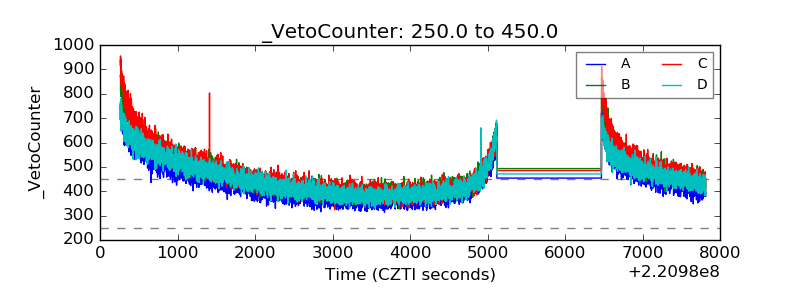 |