| Param | Original file | Final file |
|---|---|---|
| Filename | modeM0/AS1A02_174T04_9000000938_06834cztM0_level2.evt | modeM0/AS1A02_174T04_9000000938_06834cztM0_level2_quad_clean.evt |
| Size (bytes) | 515,666,880 | 86,532,480 |
| Size | 491.8 MB | 82.5 MB |
| Events in quadrant A | 3,317,180 | 539,639 |
| Events in quadrant B | 3,440,573 | 549,784 |
| Events in quadrant C | 3,521,626 | 543,404 |
| Events in quadrant D | 4,873,986 | 511,625 |
| Mode M9 | |||
|---|---|---|---|
| Quadrant | BADHDUFLAG | Total packets | Discarded packets |
| A | 0 | 21 | 0 |
| B | 0 | 21 | 0 |
| C | 0 | 21 | 0 |
| D | 0 | 21 | 0 |
| Mode M0 | |||
|---|---|---|---|
| Quadrant | BADHDUFLAG | Total packets | Discarded packets |
| A | 0 | 14595 | 3 |
| B | 0 | 14890 | 2 |
| C | 0 | 14945 | 2 |
| D | 0 | 19385 | 2 |
| Mode SS | |||
|---|---|---|---|
| Quadrant | BADHDUFLAG | Total packets | Discarded packets |
| A | 0 | 140 | 0 |
| B | 0 | 140 | 0 |
| C | 0 | 140 | 0 |
| D | 0 | 140 | 0 |
| Quadrant | Total seconds | Saturated seconds | Saturation percentage |
|---|---|---|---|
| A | 6831 | 79 | 1.156492% |
| B | 6831 | 128 | 1.873811% |
| C | 6831 | 116 | 1.698141% |
| D | 6831 | 488 | 7.143903% |
Noise dominated data is calculated using 1-second bins in cleaned event files. If a bin has >2000 counts, and if more than 50% of those come from <1% of pixels, then it is considered to be noise-dominated and hence unusable.
| Quadrant | # 1 sec bins | Bins with >0 counts | Bins with >2000 counts | High rate bins dominated by noise | Noise dominated (total time) | Noise dominated (detector-on time) | Marked lightcurve |
|---|---|---|---|---|---|---|---|
| A | 8866 | 6833 | 4 | 4 | 0.05% | 0.06% | 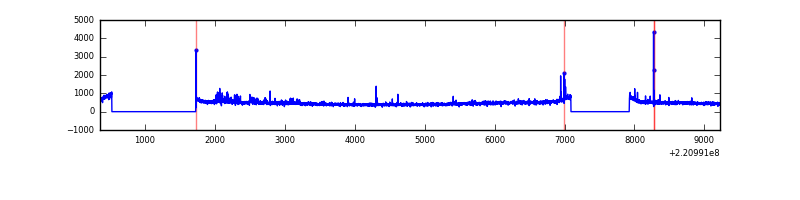 |
| B | 8866 | 6833 | 3 | 3 | 0.03% | 0.04% | 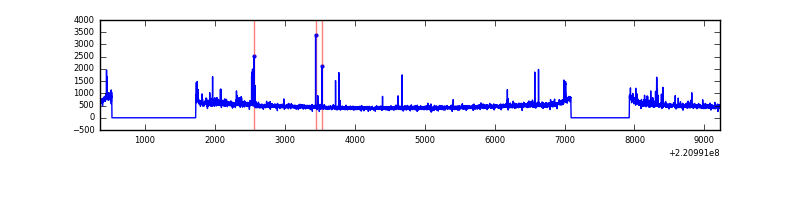 |
| C | 8866 | 6833 | 30 | 30 | 0.34% | 0.44% |  |
| D | 8866 | 6833 | 288 | 288 | 3.25% | 4.21% | 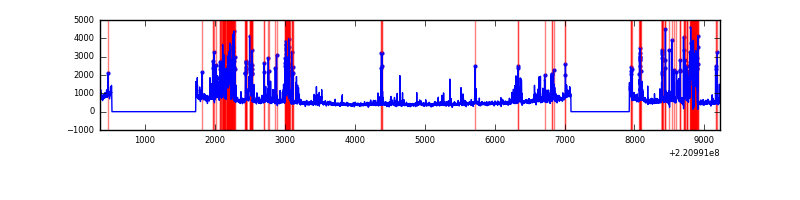 |
Top three noisy pixels from each quadrant. If the there are fewer than three noisy pixels in the level2.evt file, extra rows are filled as -1
| Pixel properties | Quadrant properties | ||||||
|---|---|---|---|---|---|---|---|
| Quadrant | DetID | PixID | Counts | Sigma | Mean | Median | Sigma |
| A | 8 | 15 | 76614 | 442.77 | 829 | 812 | 171.2 |
| A | 0 | 23 | 41747 | 239.11 | 829 | 812 | 171.2 |
| A | 0 | 226 | 11053 | 59.82 | 829 | 812 | 171.2 |
| B | 0 | 228 | 44629 | 273.61 | 836 | 815 | 160.1 |
| B | 0 | 214 | 41971 | 257.01 | 836 | 815 | 160.1 |
| B | 0 | 219 | 36465 | 222.62 | 836 | 815 | 160.1 |
| C | 12 | 16 | 177693 | 935.92 | 812 | 814 | 189.0 |
| C | 9 | 247 | 154275 | 812.01 | 812 | 814 | 189.0 |
| C | 12 | 4 | 9908 | 48.12 | 812 | 814 | 189.0 |
| D | 2 | 33 | 867930 | 4462.93 | 793 | 769 | 194.3 |
| D | 2 | 216 | 397342 | 2041.0 | 793 | 769 | 194.3 |
| D | 8 | 195 | 285320 | 1464.47 | 793 | 769 | 194.3 |
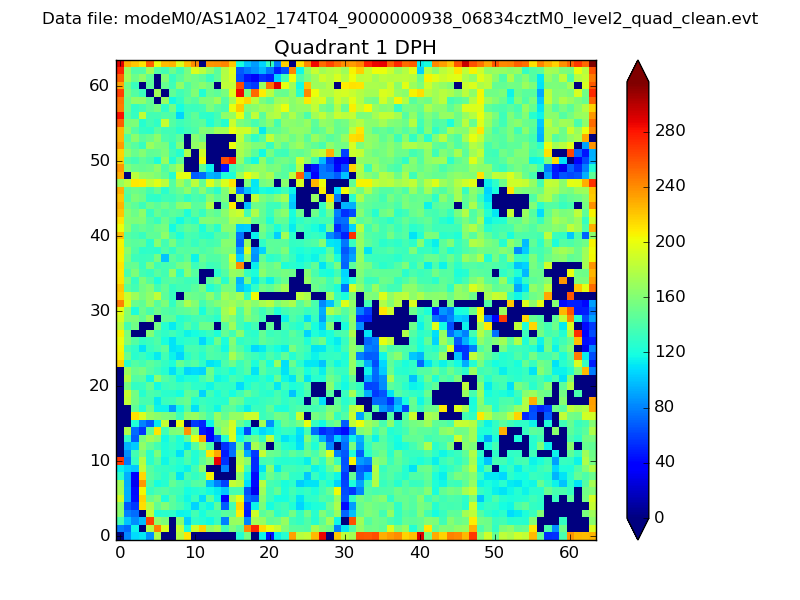
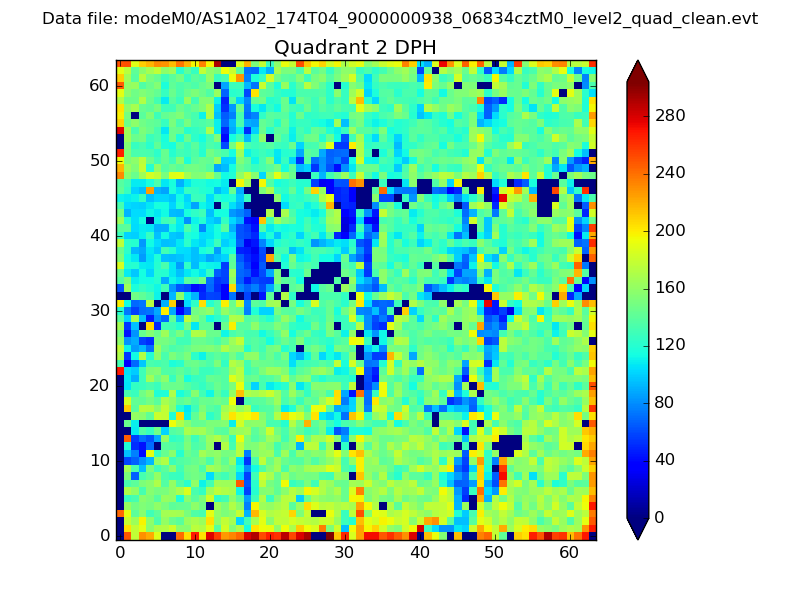
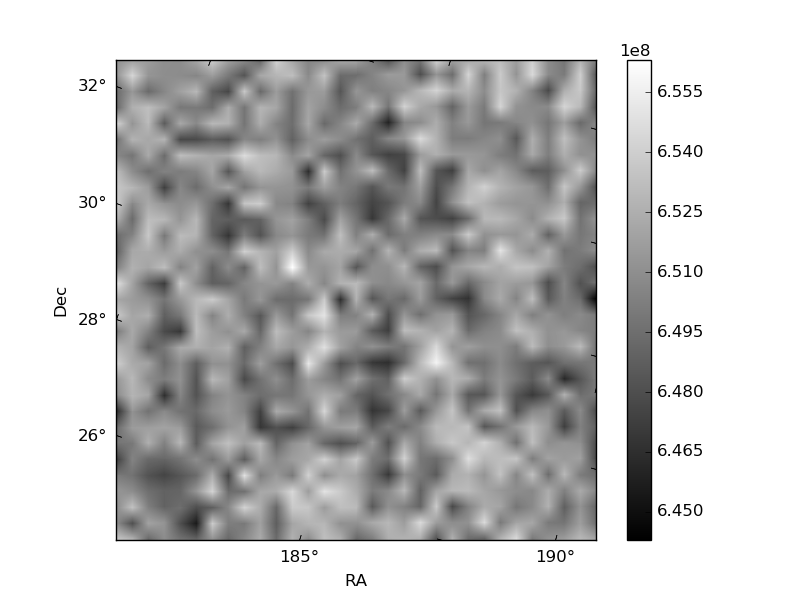
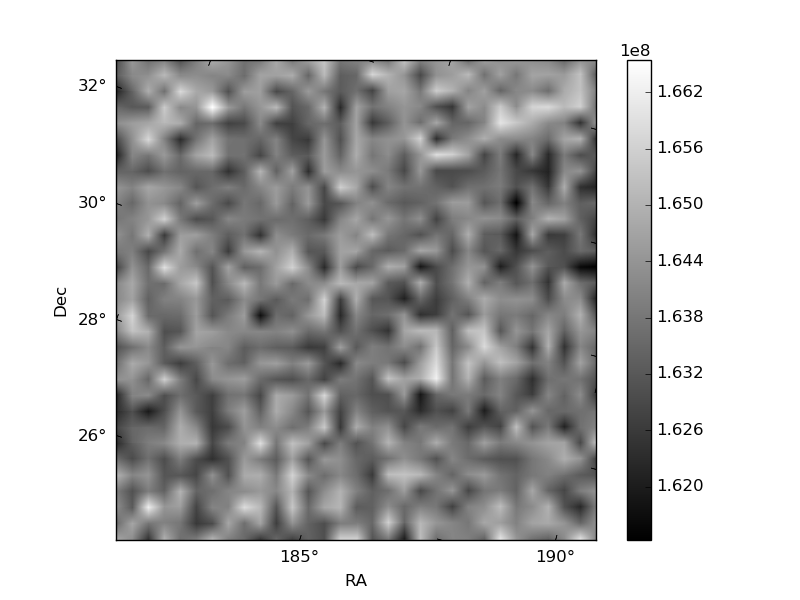
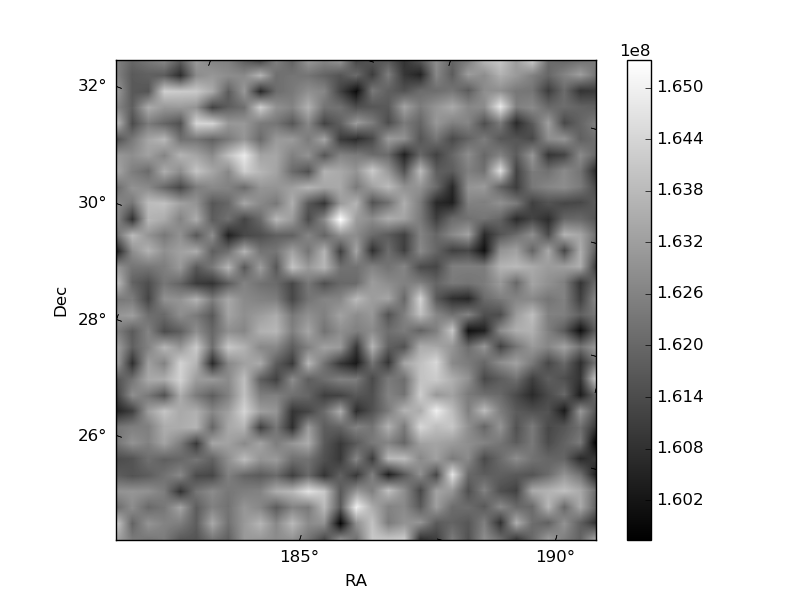
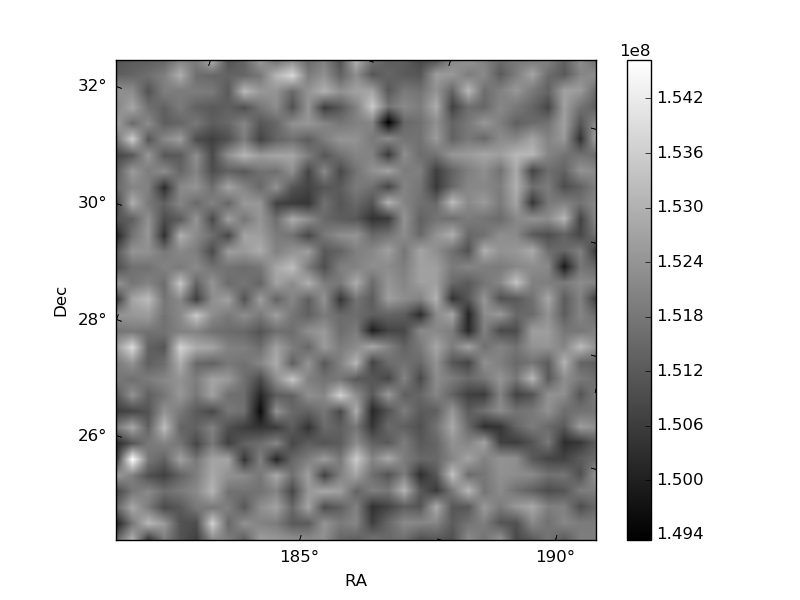
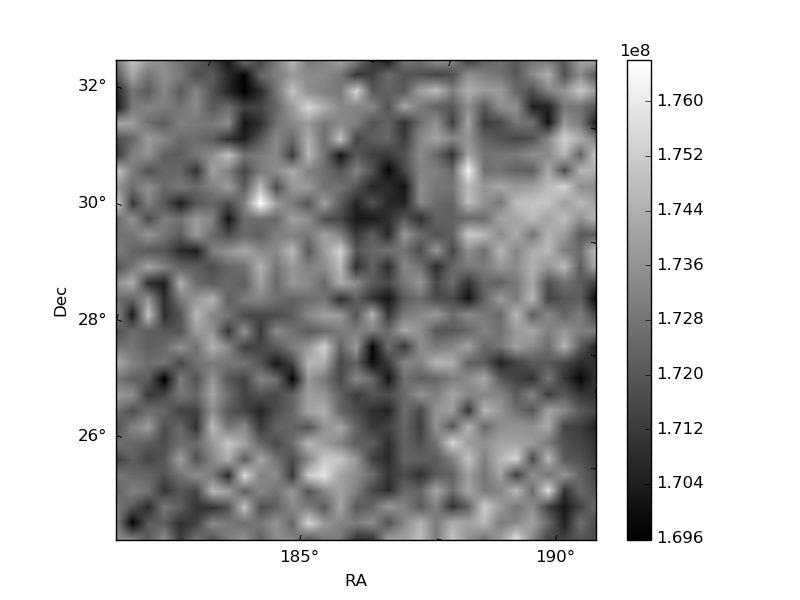
Histogram calculated using DETX and DETY for each event in the final _common_clean file
| Quadrant A | 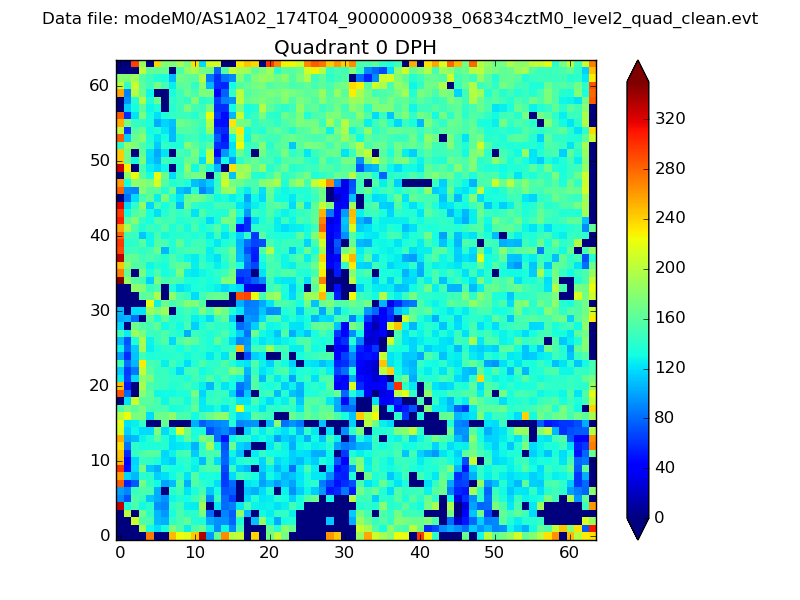 |
 |
Quadrant B |
|---|---|---|---|
| Quadrant D | 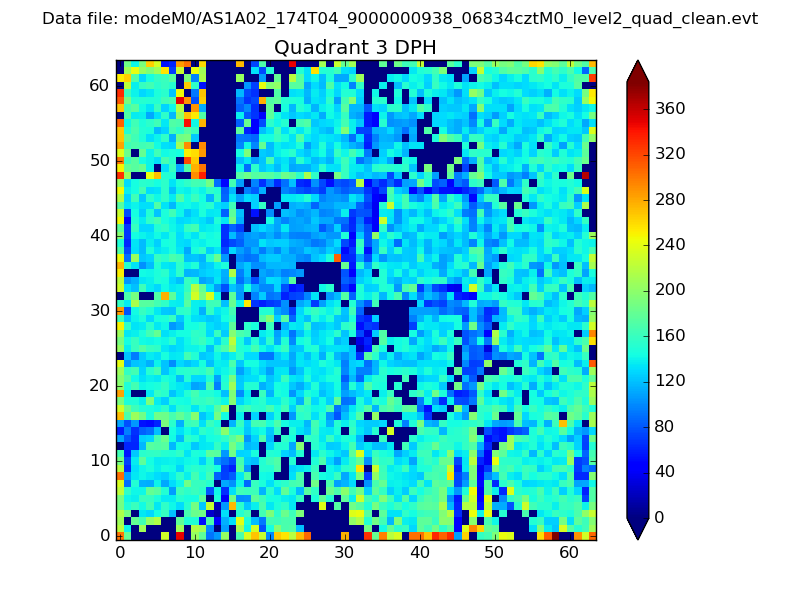 |
 |
Quadrant C |
| Plot type | Count rate plots | Images |
|---|---|---|
| Comparison with Poisson distribution Blue bars denote a histogram of data divided into 1 sec bins. Red curve is a Poisson curve with rate = median count rate of data. |
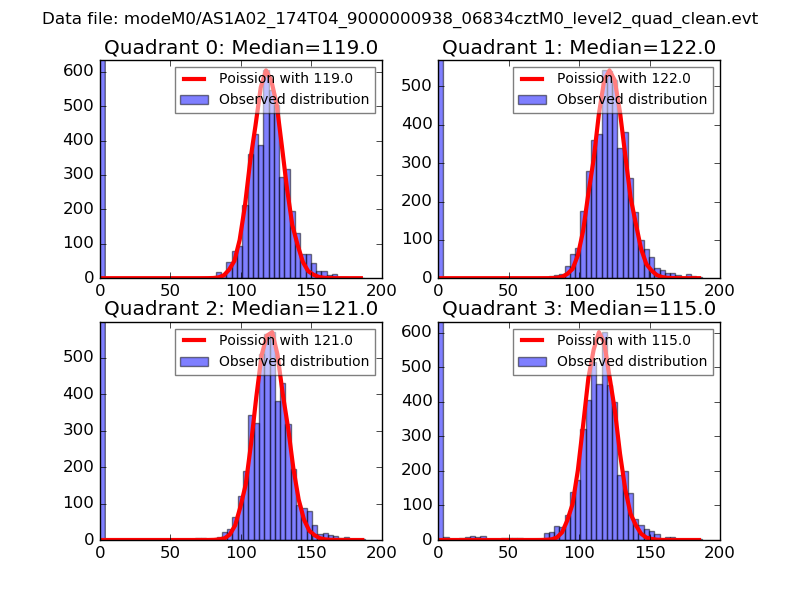 |
 |
| Quadrant-wise count rates Data is divided into 100 sec bins |
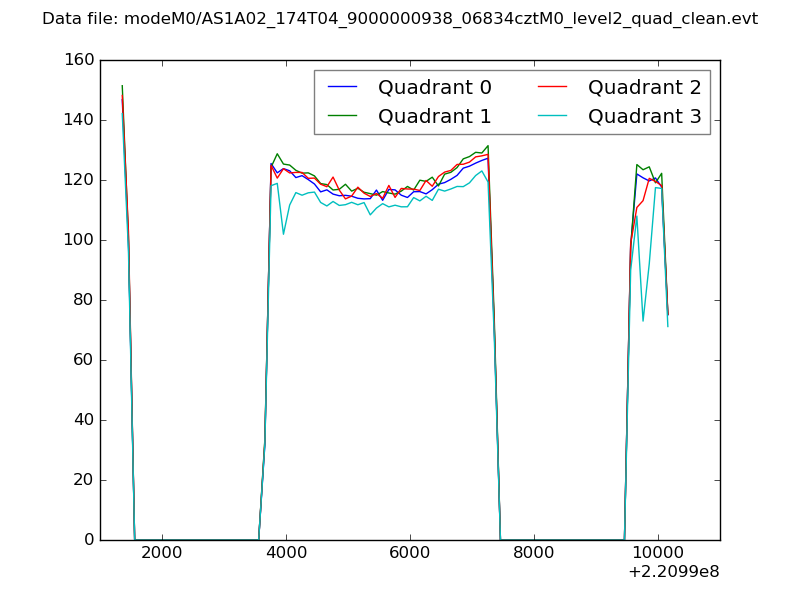 |
|
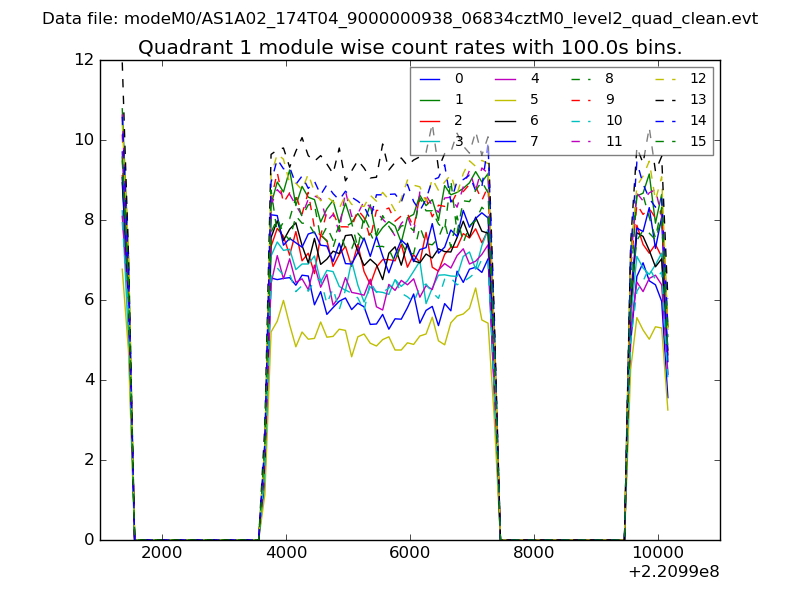
| Module-wise count rates for Quadrant A Data is divided into 100 sec bins |
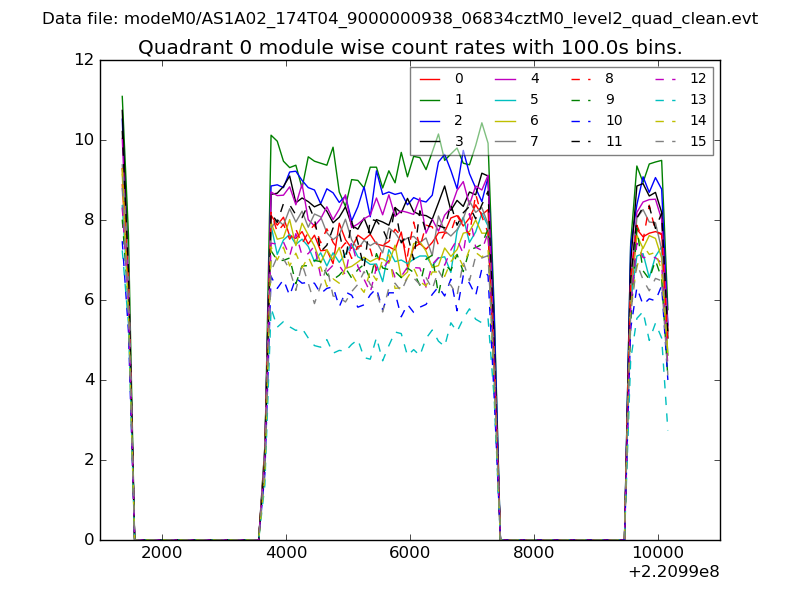 |
 |
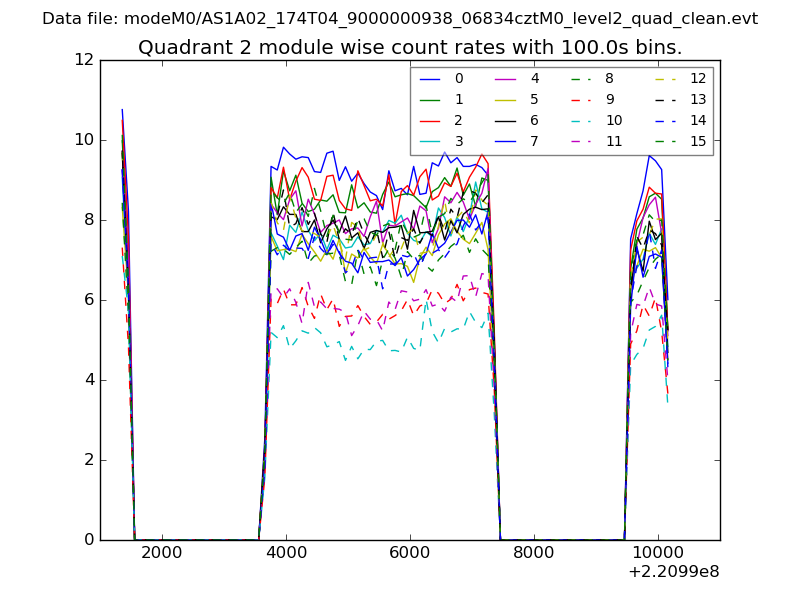
| Module-wise count rates for Quadrant B Data is divided into 100 sec bins |
 |
 |
| Module-wise count rates for Quadrant C Data is divided into 100 sec bins |
 |
 |
| Module-wise count rates for Quadrant D Data is divided into 100 sec bins |
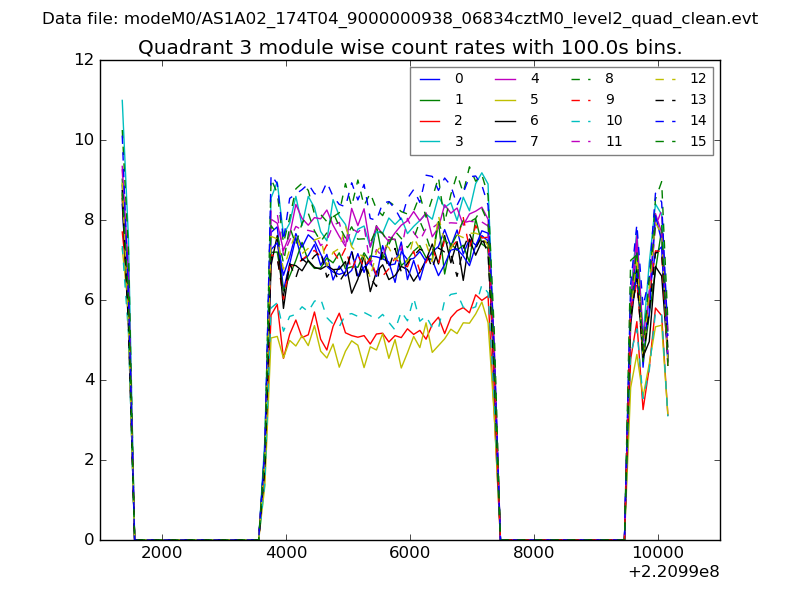 |
 |
| Parameter | Plot |
|---|---|
| CZT HV Monitor | 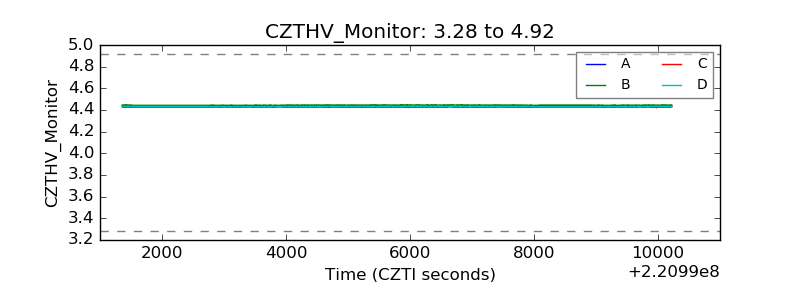 |
| D_VDD | 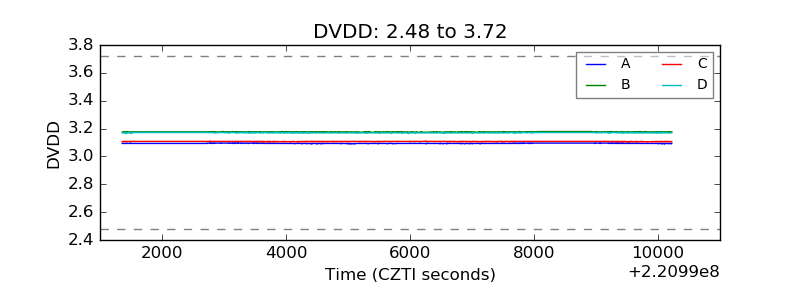 |
| Temperature 1 | 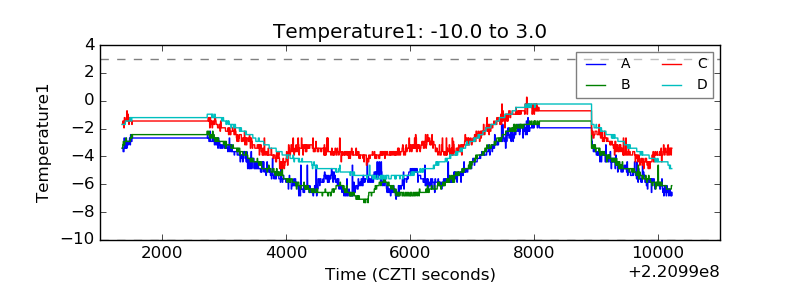 |
| Veto HV Monitor |  |
| Veto LLD | 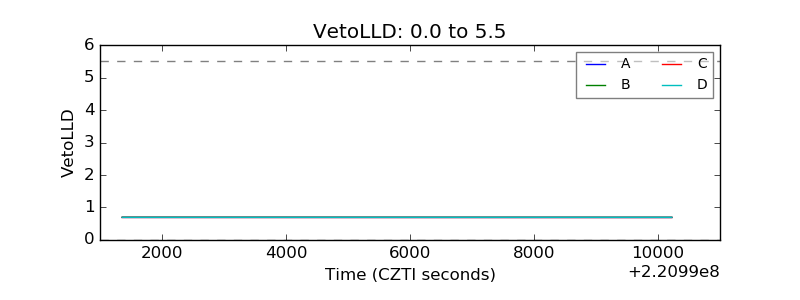 |
| Alpha Counter | 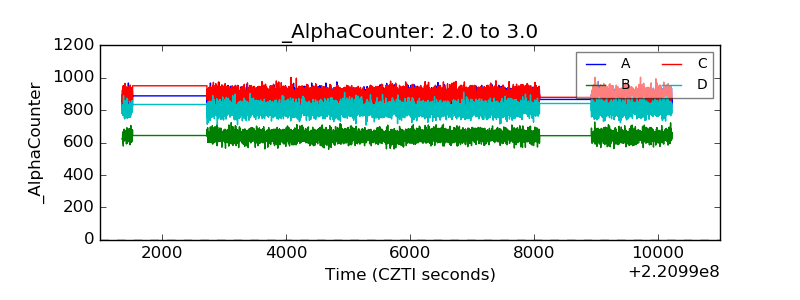 |
| _CPM_Rate | 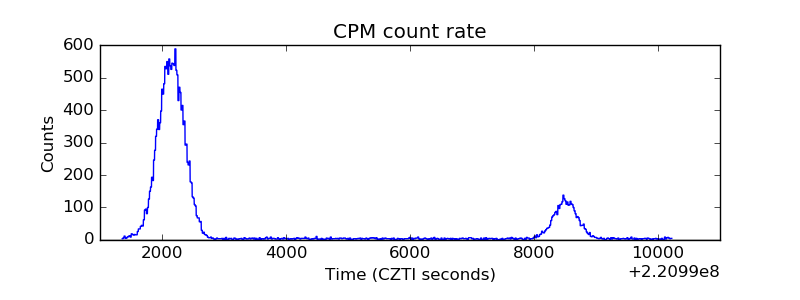 |
| CZT Counter | 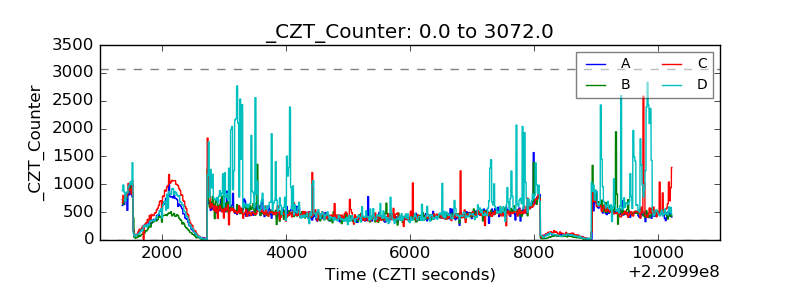 |
| +2.5 Volts monitor | 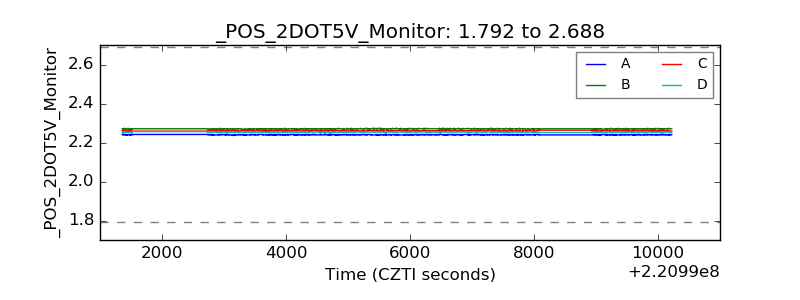 |
| +5 Volts monitor |  |
| _ROLL_ROT | 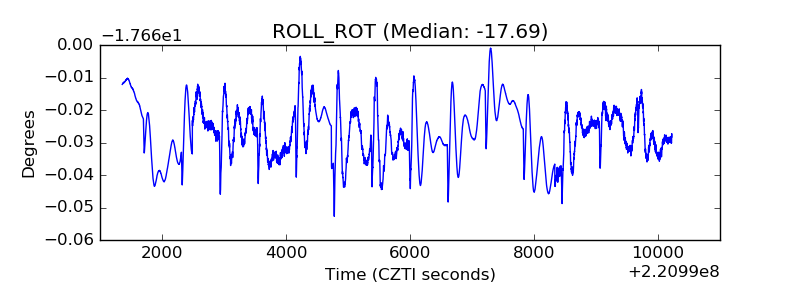 |
| _Roll_DEC | 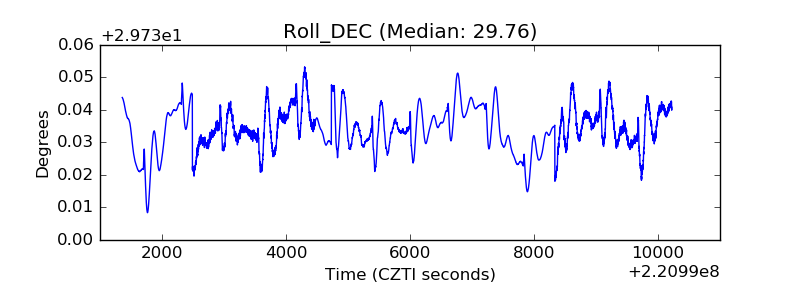 |
| _Roll_RA | 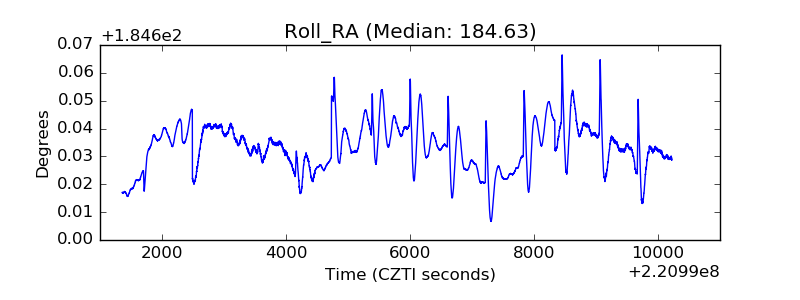 |
| Veto Counter | 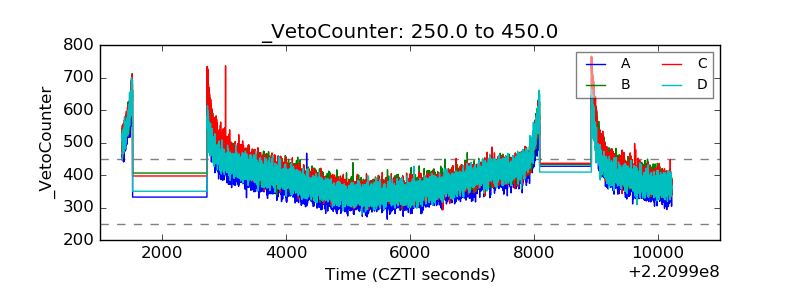 |