| Param | Original file | Final file |
|---|---|---|
| Filename | modeM0/AS1A02_174T04_9000000938_06835cztM0_level2.evt | modeM0/AS1A02_174T04_9000000938_06835cztM0_level2_quad_clean.evt |
| Size (bytes) | 642,326,400 | 91,546,560 |
| Size | 612.6 MB | 87.3 MB |
| Events in quadrant A | 3,643,686 | 569,491 |
| Events in quadrant B | 3,832,243 | 577,202 |
| Events in quadrant C | 6,167,522 | 549,451 |
| Events in quadrant D | 5,287,903 | 540,416 |
| Mode M9 | |||
|---|---|---|---|
| Quadrant | BADHDUFLAG | Total packets | Discarded packets |
| A | 0 | 13 | 0 |
| B | 0 | 13 | 0 |
| C | 0 | 13 | 0 |
| D | 0 | 13 | 0 |
| Mode M0 | |||
|---|---|---|---|
| Quadrant | BADHDUFLAG | Total packets | Discarded packets |
| A | 0 | 16190 | 4 |
| B | 0 | 16716 | 3 |
| C | 0 | 23538 | 3 |
| D | 0 | 21379 | 3 |
| Mode SS | |||
|---|---|---|---|
| Quadrant | BADHDUFLAG | Total packets | Discarded packets |
| A | 0 | 156 | 0 |
| B | 0 | 156 | 0 |
| C | 0 | 156 | 0 |
| D | 0 | 156 | 0 |
| Quadrant | Total seconds | Saturated seconds | Saturation percentage |
|---|---|---|---|
| A | 7706 | 102 | 1.323644% |
| B | 7706 | 162 | 2.102258% |
| C | 7706 | 490 | 6.358682% |
| D | 7706 | 493 | 6.397612% |
Noise dominated data is calculated using 1-second bins in cleaned event files. If a bin has >2000 counts, and if more than 50% of those come from <1% of pixels, then it is considered to be noise-dominated and hence unusable.
| Quadrant | # 1 sec bins | Bins with >0 counts | Bins with >2000 counts | High rate bins dominated by noise | Noise dominated (total time) | Noise dominated (detector-on time) | Marked lightcurve |
|---|---|---|---|---|---|---|---|
| A | 8906 | 7710 | 3 | 3 | 0.03% | 0.04% | 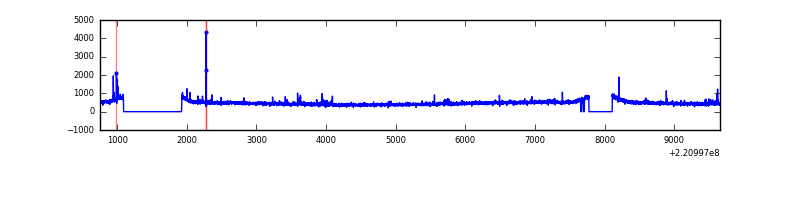 |
| B | 8906 | 7710 | 9 | 9 | 0.10% | 0.12% | 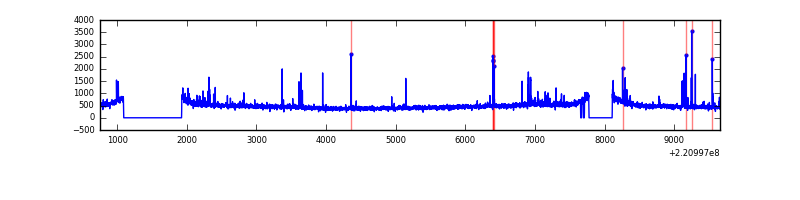 |
| C | 8906 | 7710 | 441 | 441 | 4.95% | 5.72% | 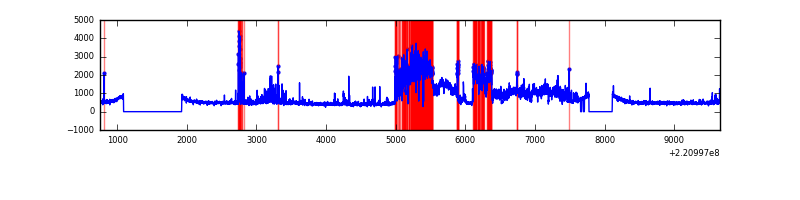 |
| D | 8906 | 7709 | 240 | 240 | 2.69% | 3.11% | 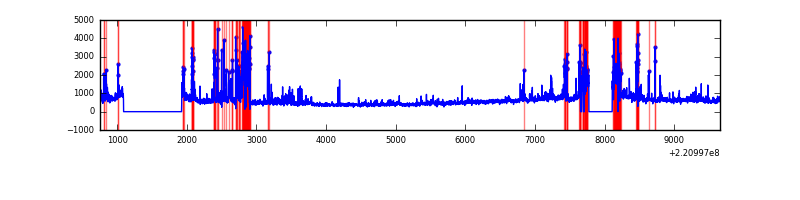 |
Top three noisy pixels from each quadrant. If the there are fewer than three noisy pixels in the level2.evt file, extra rows are filled as -1
| Pixel properties | Quadrant properties | ||||||
|---|---|---|---|---|---|---|---|
| Quadrant | DetID | PixID | Counts | Sigma | Mean | Median | Sigma |
| A | 8 | 15 | 64936 | 339.24 | 924 | 902 | 188.8 |
| A | 13 | 248 | 18623 | 93.88 | 924 | 902 | 188.8 |
| A | 0 | 226 | 9086 | 43.36 | 924 | 902 | 188.8 |
| B | 0 | 219 | 65933 | 364.62 | 931 | 909 | 178.3 |
| B | 4 | 48 | 40157 | 220.08 | 931 | 909 | 178.3 |
| B | 4 | 81 | 25696 | 138.99 | 931 | 909 | 178.3 |
| C | 9 | 68 | 2240276 | 10777.19 | 890 | 891 | 207.8 |
| C | 9 | 247 | 260113 | 1247.52 | 890 | 891 | 207.8 |
| C | 12 | 16 | 176375 | 844.53 | 890 | 891 | 207.8 |
| D | 2 | 33 | 777232 | 3640.4 | 862 | 834 | 213.3 |
| D | 8 | 195 | 630935 | 2954.44 | 862 | 834 | 213.3 |
| D | 2 | 216 | 267452 | 1250.13 | 862 | 834 | 213.3 |
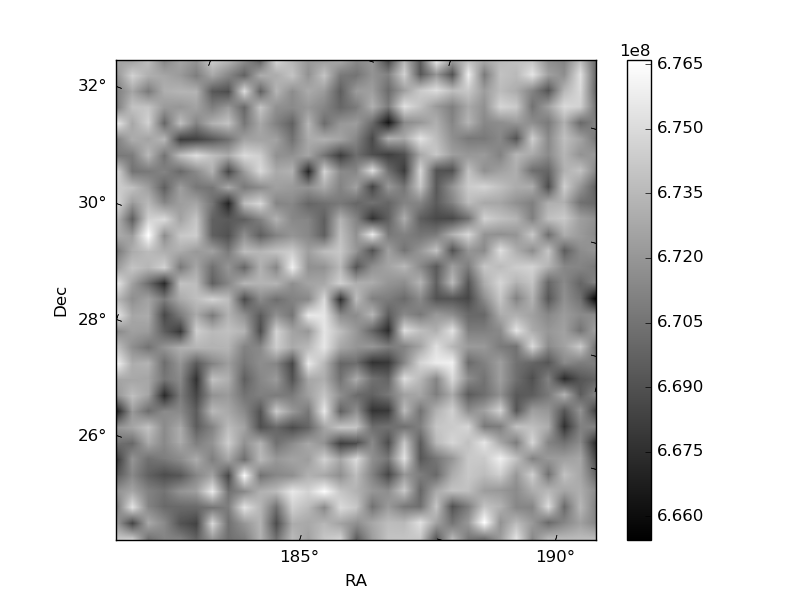
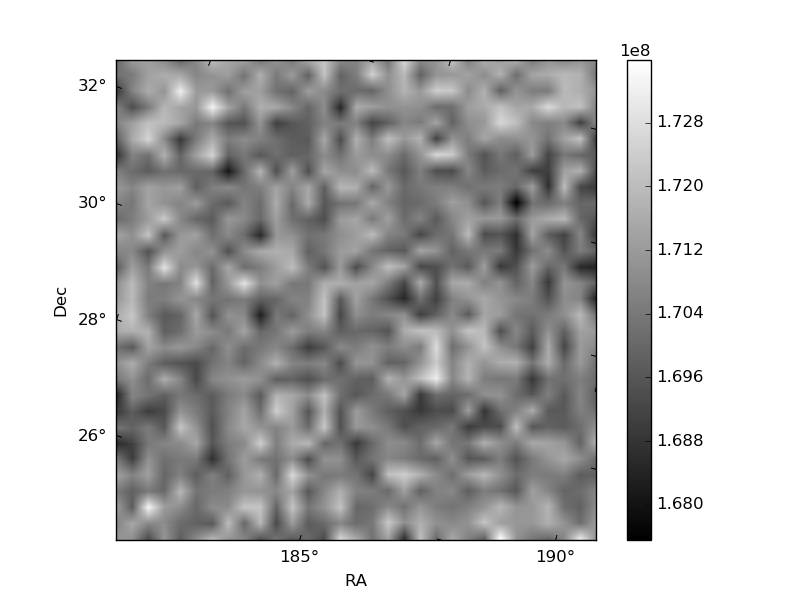
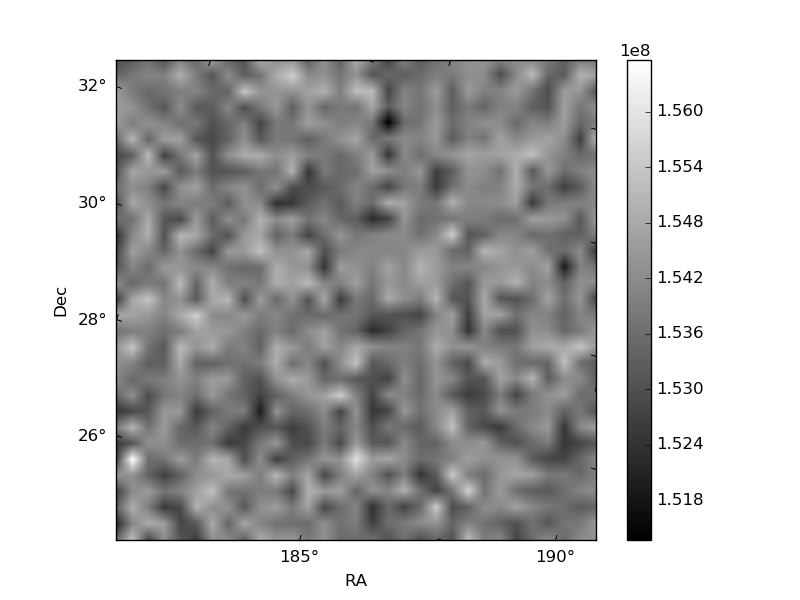
Histogram calculated using DETX and DETY for each event in the final _common_clean file
| Quadrant A | 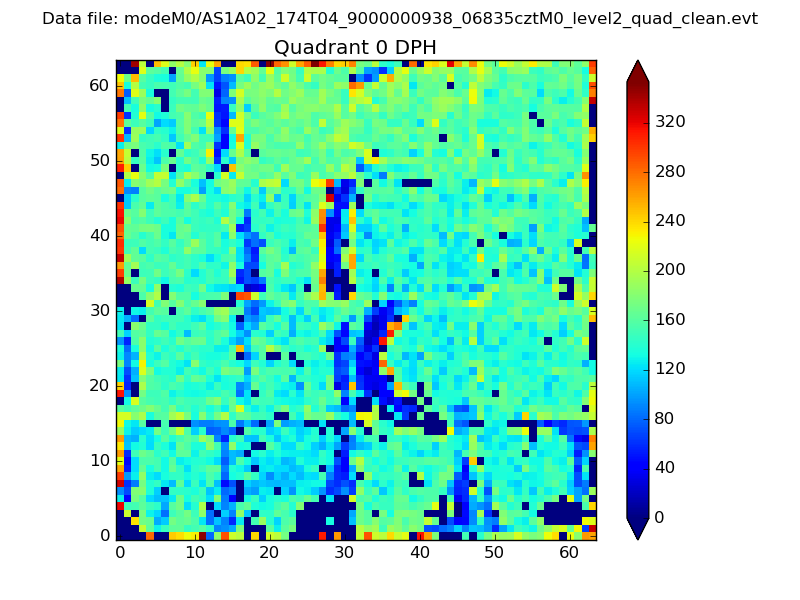 |
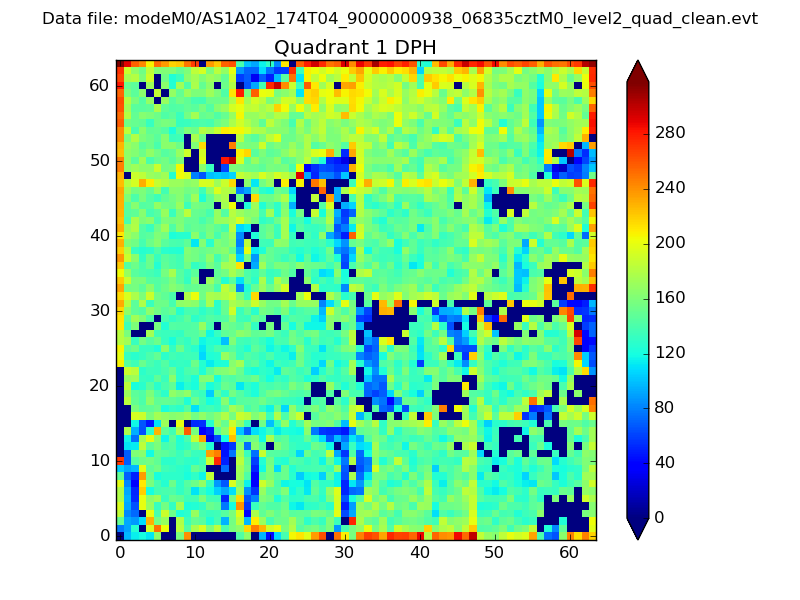 |
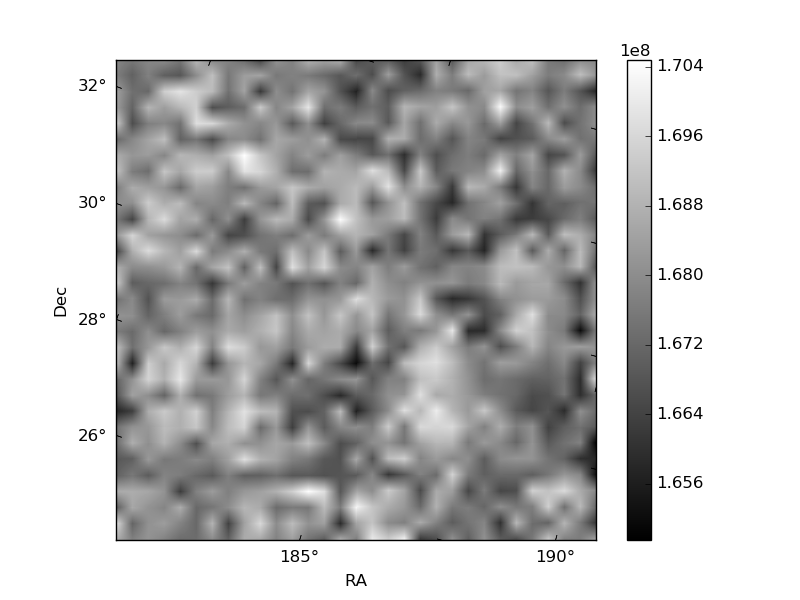
Quadrant B |
|---|---|---|---|
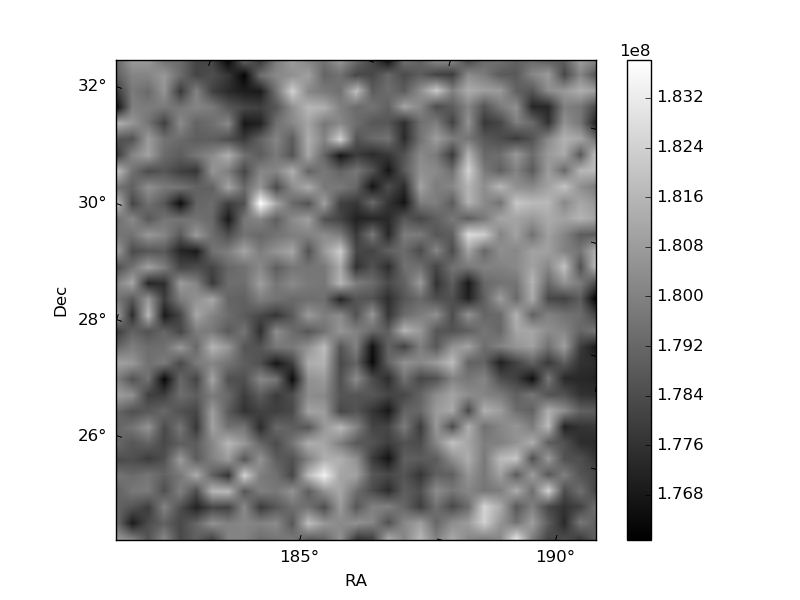
| Quadrant D | 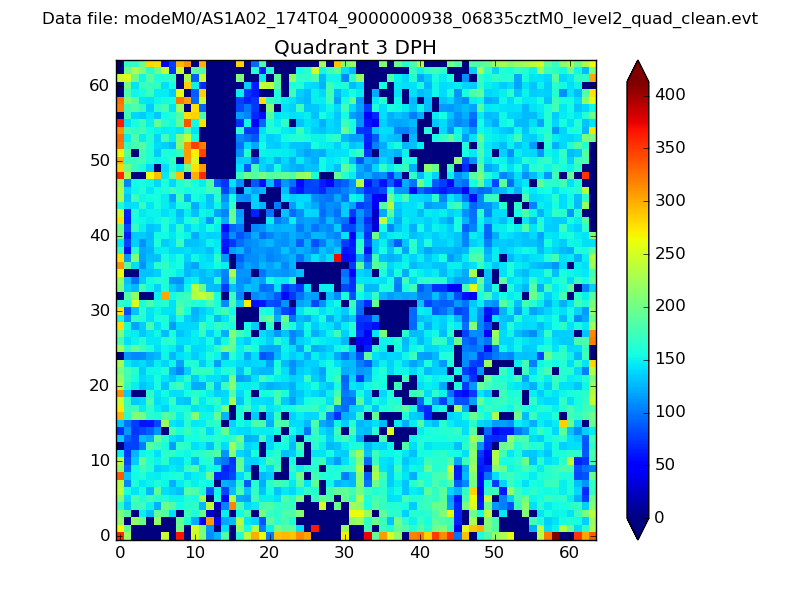 |
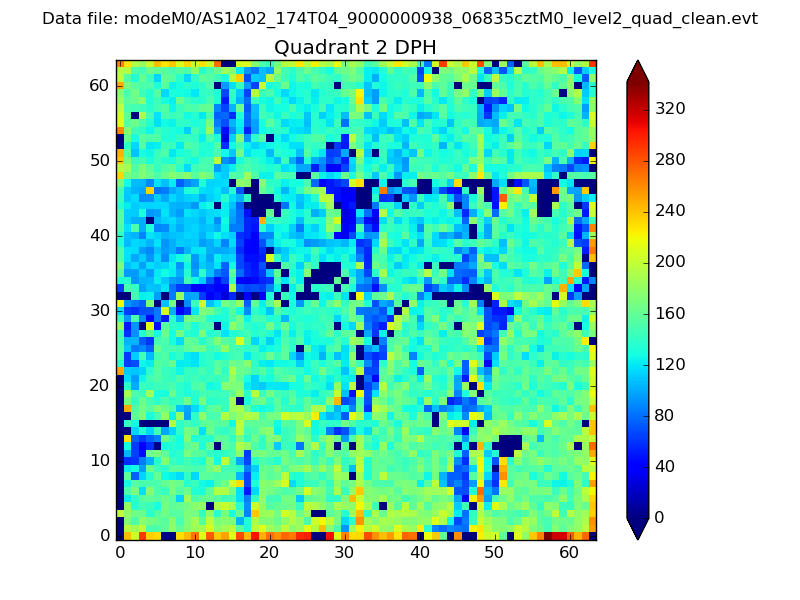 |
Quadrant C |
| Plot type | Count rate plots | Images |
|---|---|---|
| Comparison with Poisson distribution Blue bars denote a histogram of data divided into 1 sec bins. Red curve is a Poisson curve with rate = median count rate of data. |
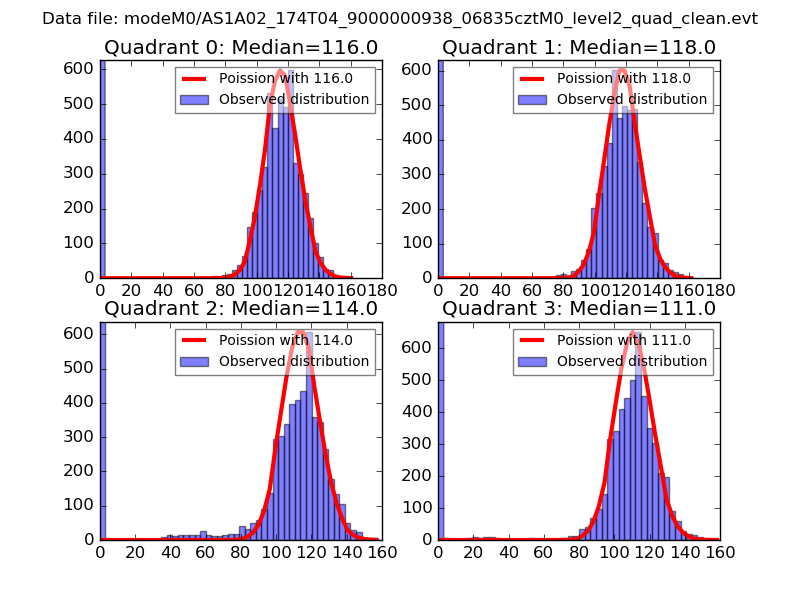 |
 |
| Quadrant-wise count rates Data is divided into 100 sec bins |
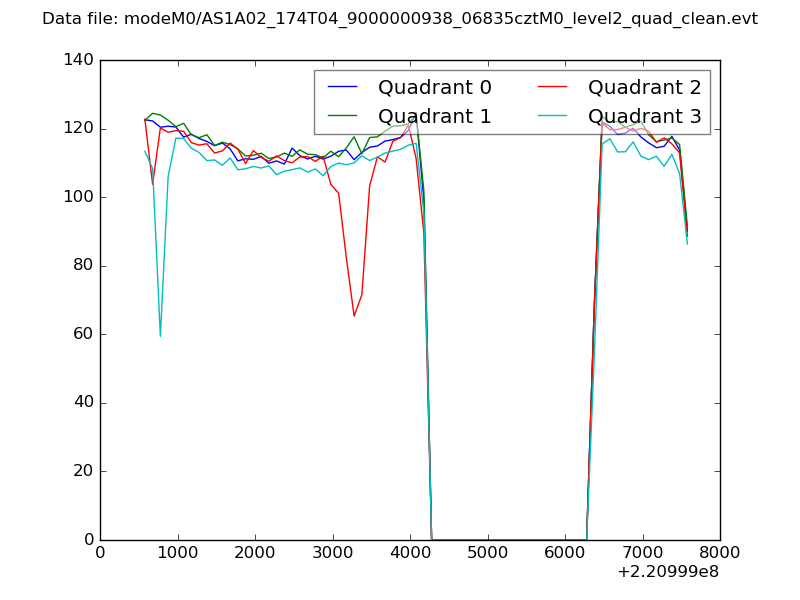 |
|
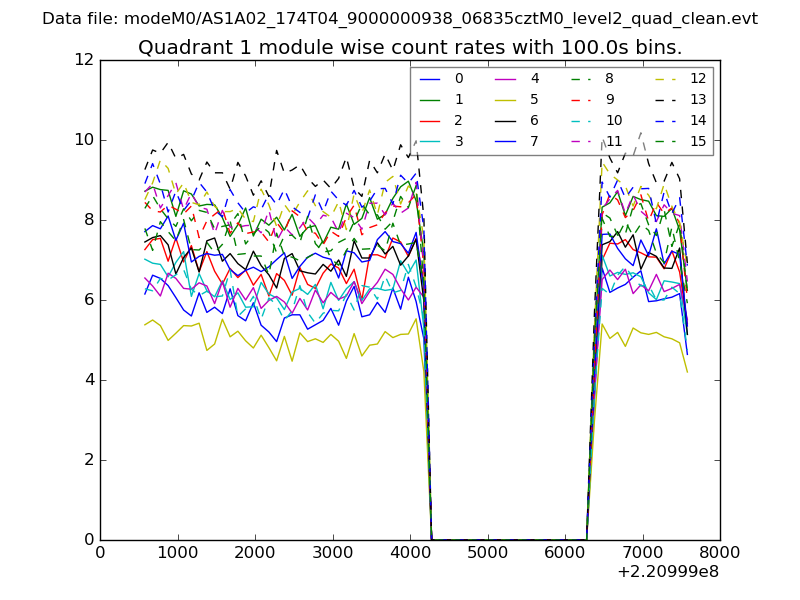
| Module-wise count rates for Quadrant A Data is divided into 100 sec bins |
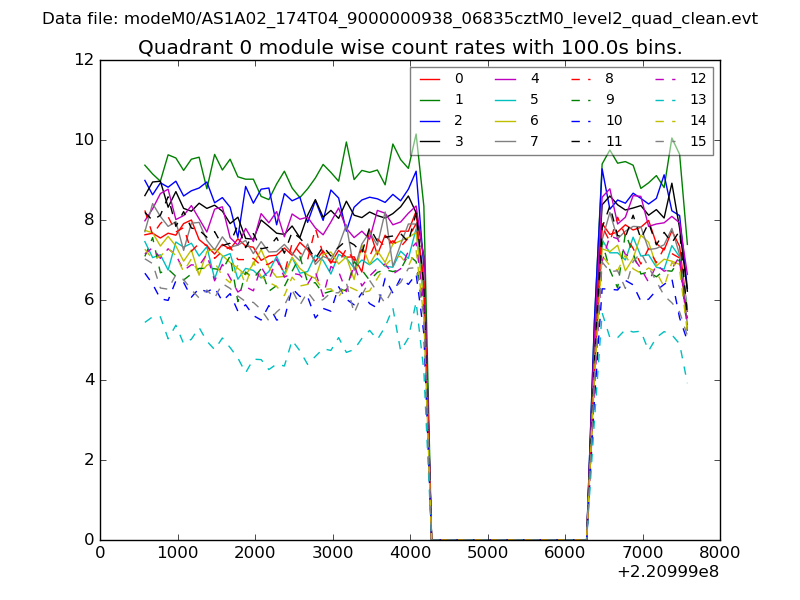 |
 |
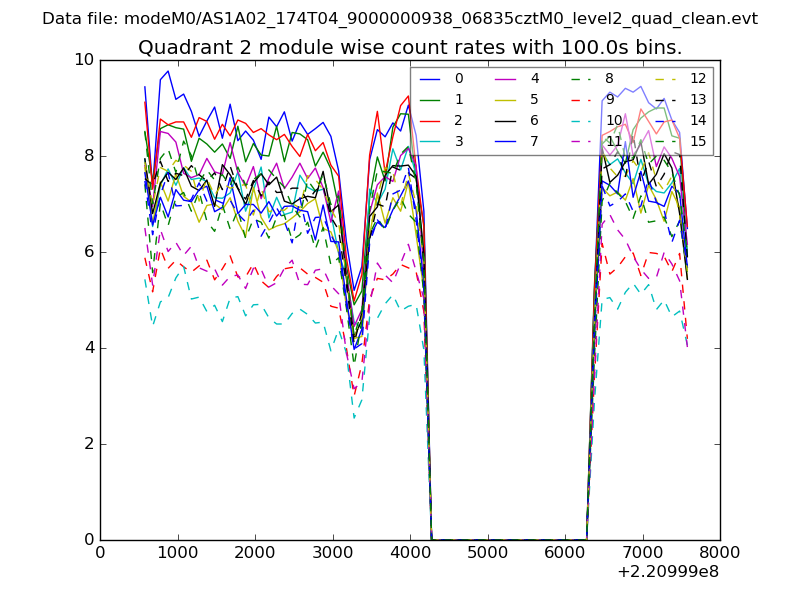
| Module-wise count rates for Quadrant B Data is divided into 100 sec bins |
 |
 |
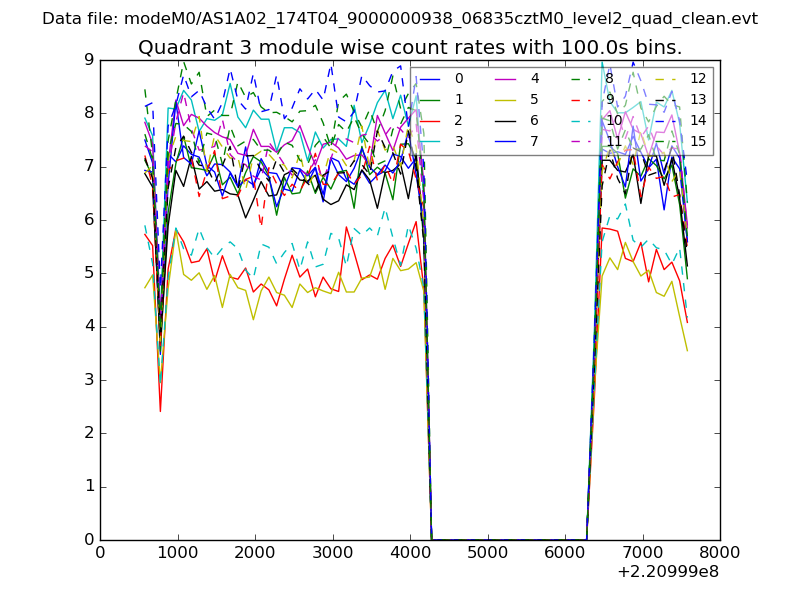
| Module-wise count rates for Quadrant C Data is divided into 100 sec bins |
 |
 |
| Module-wise count rates for Quadrant D Data is divided into 100 sec bins |
 |
 |
| Parameter | Plot |
|---|---|
| CZT HV Monitor | 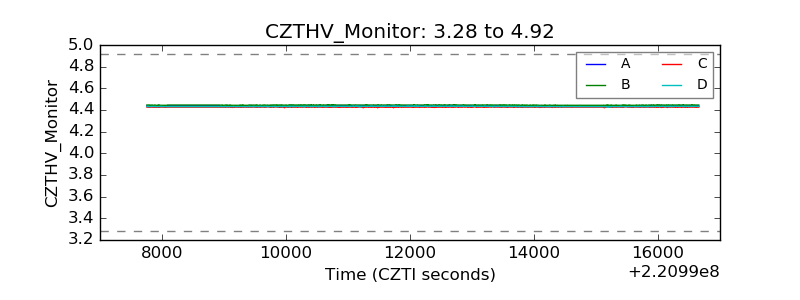 |
| D_VDD | 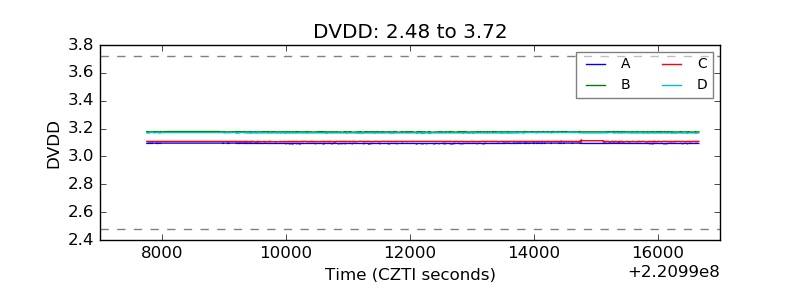 |
| Temperature 1 | 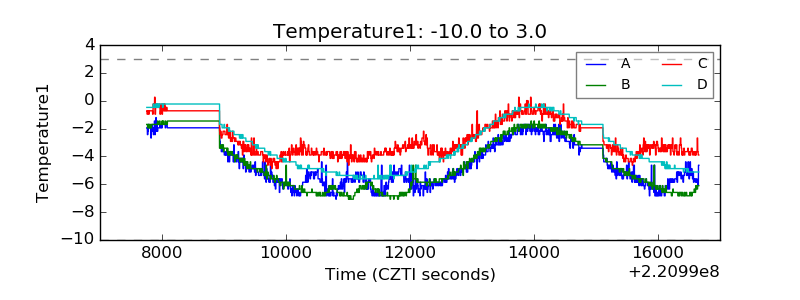 |
| Veto HV Monitor | 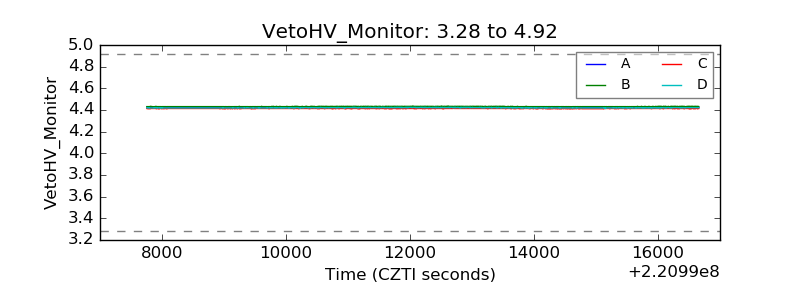 |
| Veto LLD | 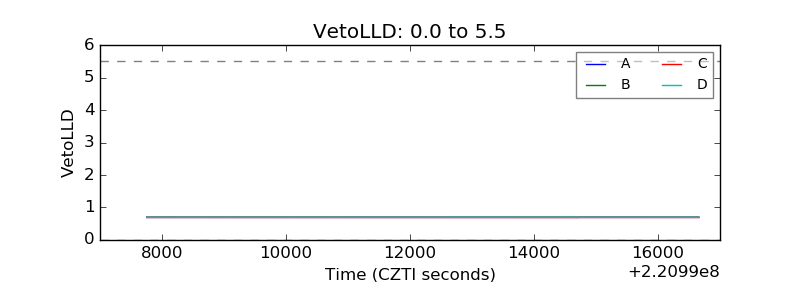 |
| Alpha Counter | 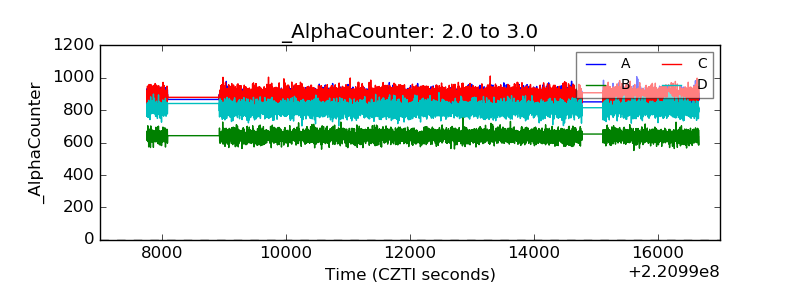 |
| _CPM_Rate | 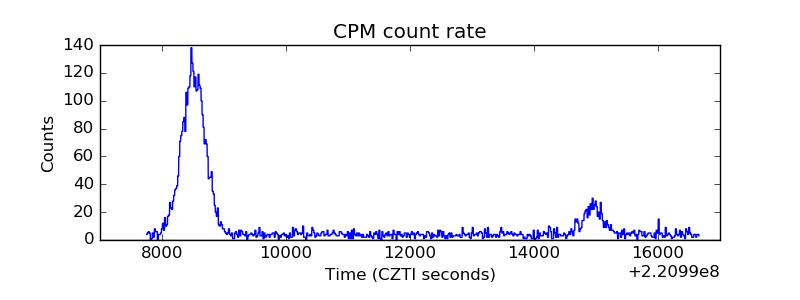 |
| CZT Counter | 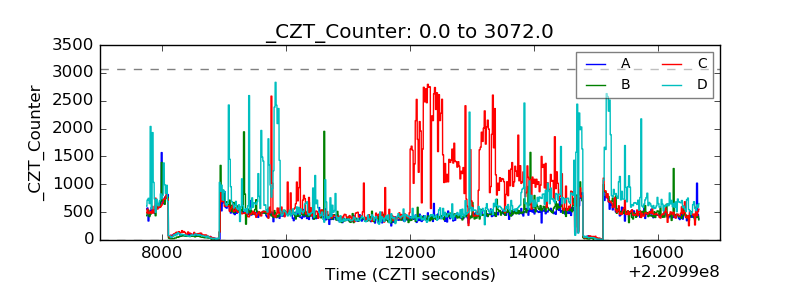 |
| +2.5 Volts monitor | 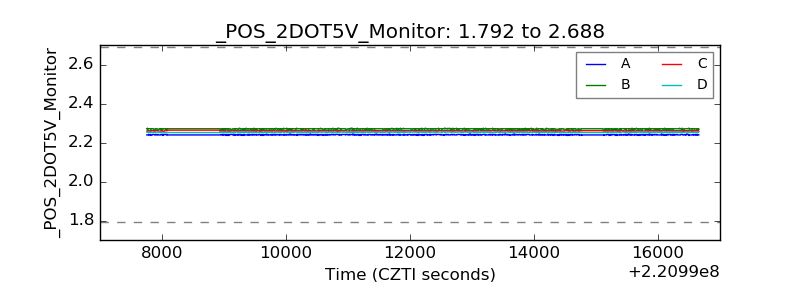 |
| +5 Volts monitor | 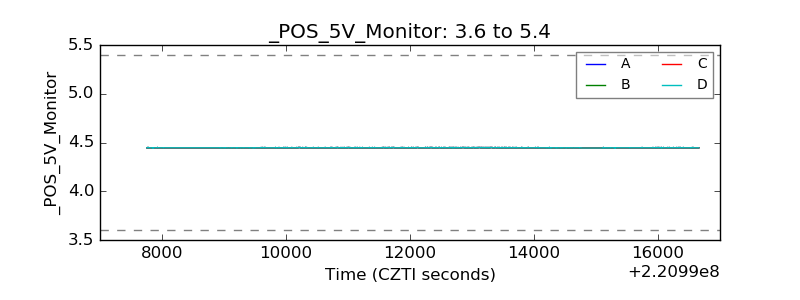 |
| _ROLL_ROT | 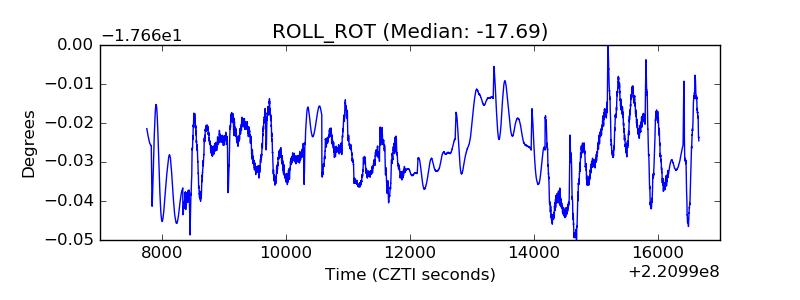 |
| _Roll_DEC | 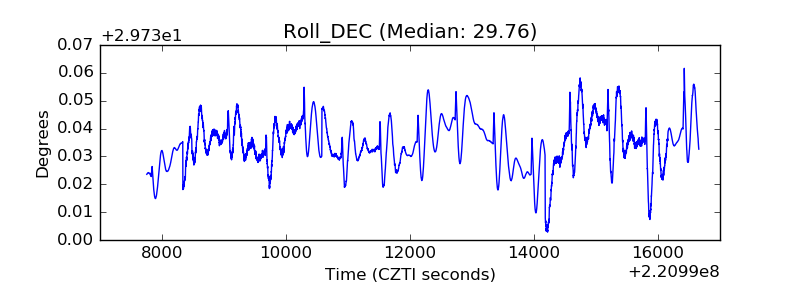 |
| _Roll_RA | 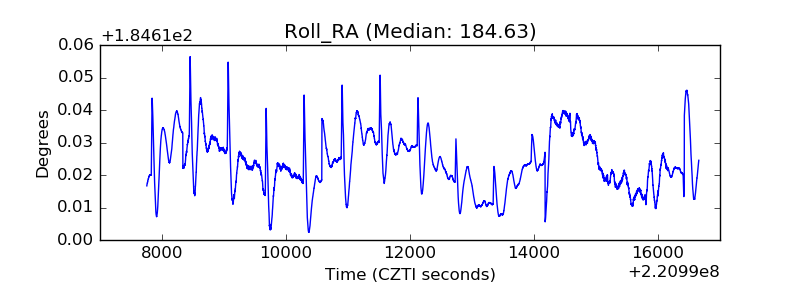 |
| Veto Counter | 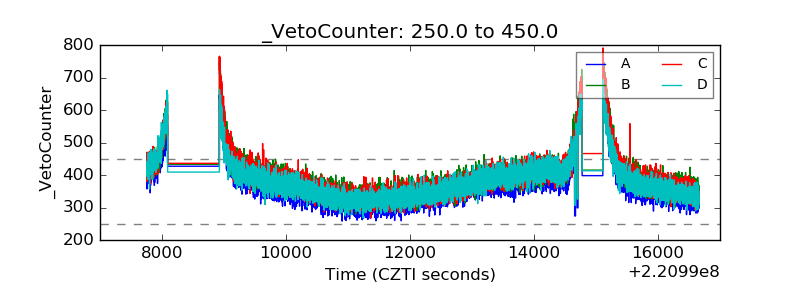 |