| Param | Original file | Final file |
|---|---|---|
| Filename | modeM0/AS1A02_174T04_9000000938_06839cztM0_level2.evt | modeM0/AS1A02_174T04_9000000938_06839cztM0_level2_quad_clean.evt |
| Size (bytes) | 190,304,640 | 52,859,520 |
| Size | 181.5 MB | 50.4 MB |
| Events in quadrant A | 1,284,232 | 345,847 |
| Events in quadrant B | 1,327,215 | 354,286 |
| Events in quadrant C | 1,399,471 | 349,243 |
| Events in quadrant D | 1,541,695 | 332,906 |
| Mode M9 | |||
|---|---|---|---|
| Quadrant | BADHDUFLAG | Total packets | Discarded packets |
| A | 1 | 251318637792 | 0 |
| B | 1 | -1 | -1 |
| C | 1 | -1 | -1 |
| D | 1 | -1 | -1 |
| Mode M0 | |||
|---|---|---|---|
| Quadrant | BADHDUFLAG | Total packets | Discarded packets |
| A | 0 | 6295 | 2 |
| B | 0 | 6333 | 1 |
| C | 0 | 6371 | 1 |
| D | 0 | 6584 | 1 |
| Mode SS | |||
|---|---|---|---|
| Quadrant | BADHDUFLAG | Total packets | Discarded packets |
| A | 0 | 60 | 0 |
| B | 0 | 60 | 0 |
| C | 0 | 60 | 0 |
| D | 0 | 60 | 0 |
| Quadrant | Total seconds | Saturated seconds | Saturation percentage |
|---|---|---|---|
| A | 3070 | 13 | 0.423453% |
| B | 3070 | 34 | 1.107492% |
| C | 3070 | 21 | 0.684039% |
| D | 3070 | 14 | 0.456026% |
Noise dominated data is calculated using 1-second bins in cleaned event files. If a bin has >2000 counts, and if more than 50% of those come from <1% of pixels, then it is considered to be noise-dominated and hence unusable.
| Quadrant | # 1 sec bins | Bins with >0 counts | Bins with >2000 counts | High rate bins dominated by noise | Noise dominated (total time) | Noise dominated (detector-on time) | Marked lightcurve |
|---|---|---|---|---|---|---|---|
| A | 3070 | 3070 | 0 | 0 | 0.00% | 0.00% | 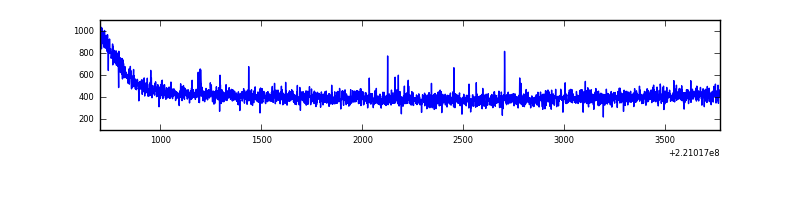 |
| B | 3070 | 3070 | 1 | 1 | 0.03% | 0.03% | 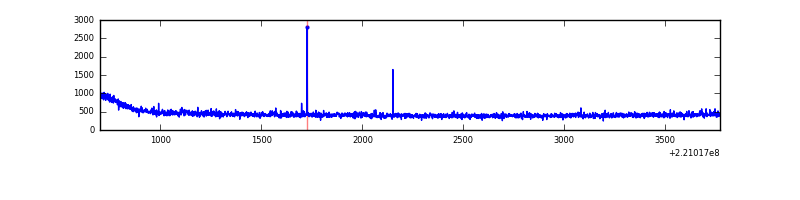 |
| C | 3070 | 3070 | 0 | 0 | 0.00% | 0.00% | 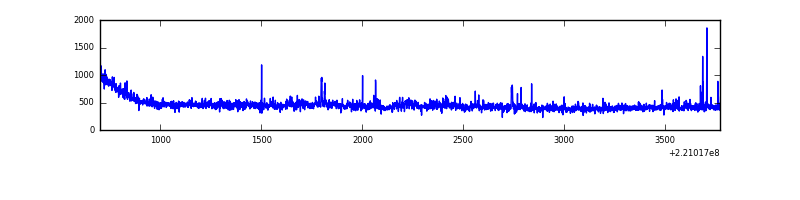 |
| D | 3070 | 3070 | 2 | 2 | 0.07% | 0.07% | 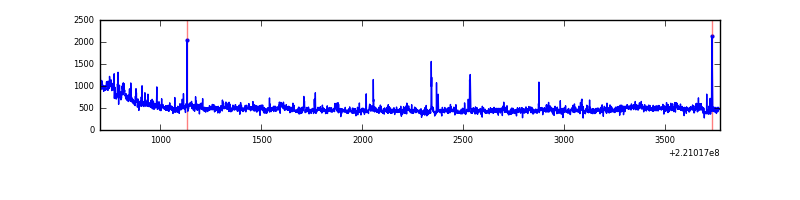 |
Top three noisy pixels from each quadrant. If the there are fewer than three noisy pixels in the level2.evt file, extra rows are filled as -1
| Pixel properties | Quadrant properties | ||||||
|---|---|---|---|---|---|---|---|
| Quadrant | DetID | PixID | Counts | Sigma | Mean | Median | Sigma |
| A | 0 | 226 | 3080 | 39.25 | 332 | 326 | 70.2 |
| A | 12 | 194 | 3060 | 38.96 | 332 | 326 | 70.2 |
| A | 13 | 248 | 2931 | 37.12 | 332 | 326 | 70.2 |
| B | 0 | 219 | 9364 | 134.08 | 338 | 329 | 67.4 |
| B | 12 | 111 | 7107 | 100.58 | 338 | 329 | 67.4 |
| B | 4 | 81 | 6327 | 89.01 | 338 | 329 | 67.4 |
| C | 9 | 247 | 86145 | 1119.86 | 323 | 325 | 76.6 |
| C | 9 | 68 | 22990 | 295.75 | 323 | 325 | 76.6 |
| C | 10 | 22 | 9348 | 117.74 | 323 | 325 | 76.6 |
| D | 8 | 195 | 275385 | 3408.82 | 320 | 309 | 80.7 |
| D | 2 | 216 | 24183 | 295.85 | 320 | 309 | 80.7 |
| D | 2 | 136 | 14283 | 173.17 | 320 | 309 | 80.7 |
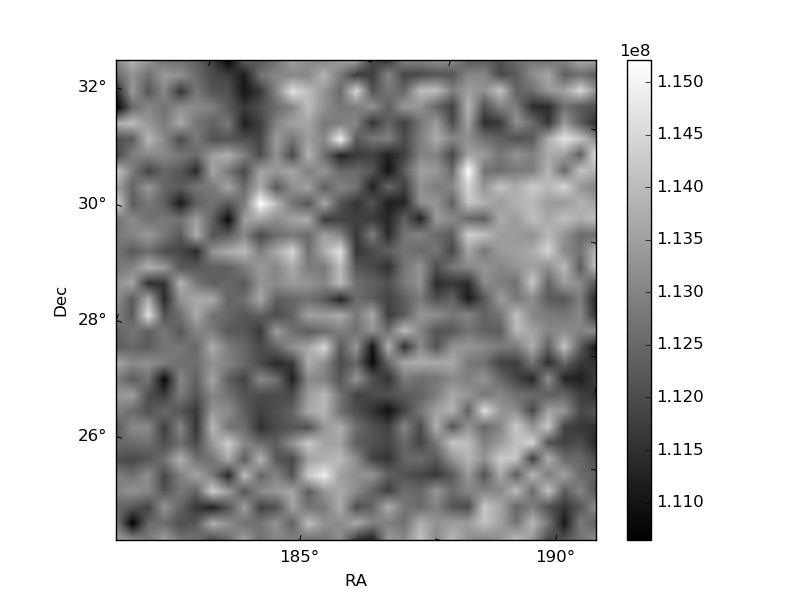
Histogram calculated using DETX and DETY for each event in the final _common_clean file
| Quadrant A | 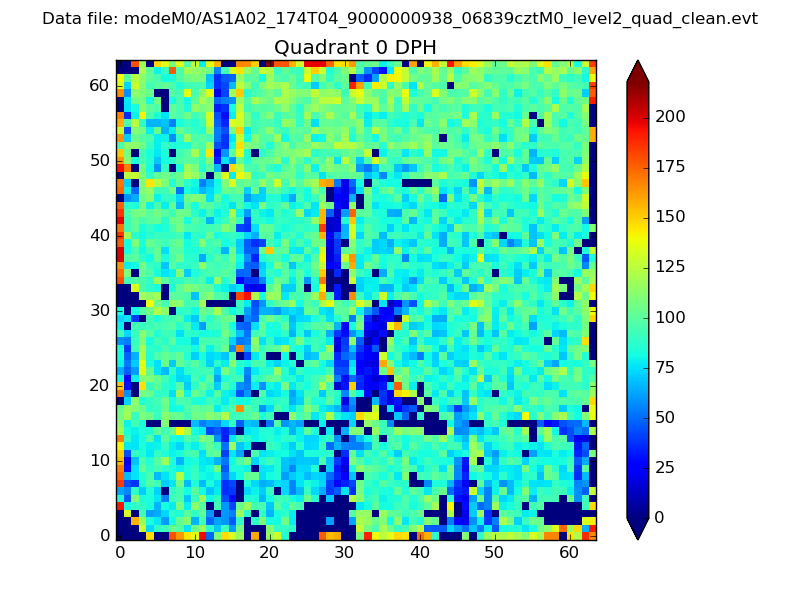 |
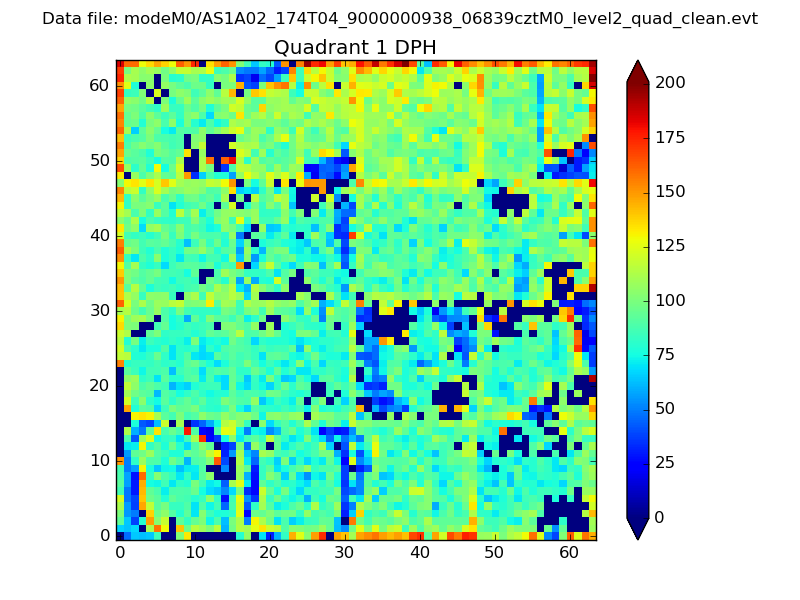 |
Quadrant B |
|---|---|---|---|
| Quadrant D | 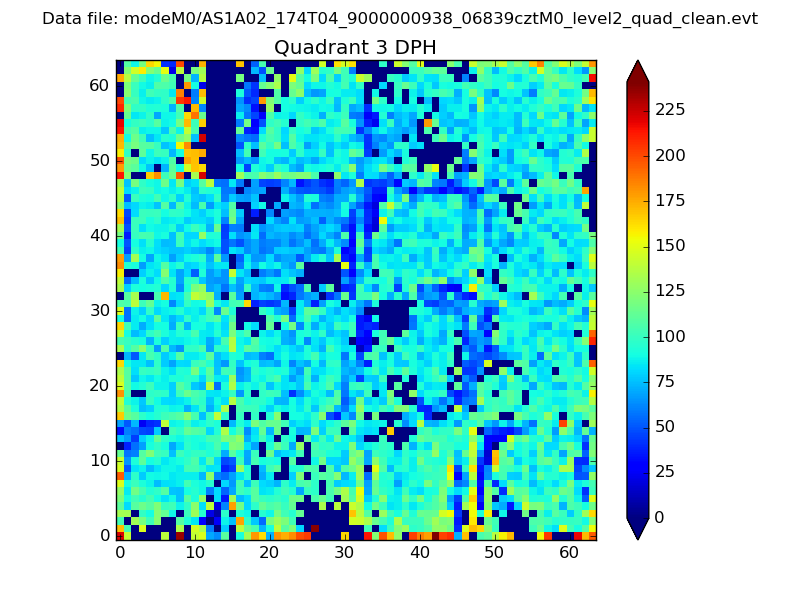 |
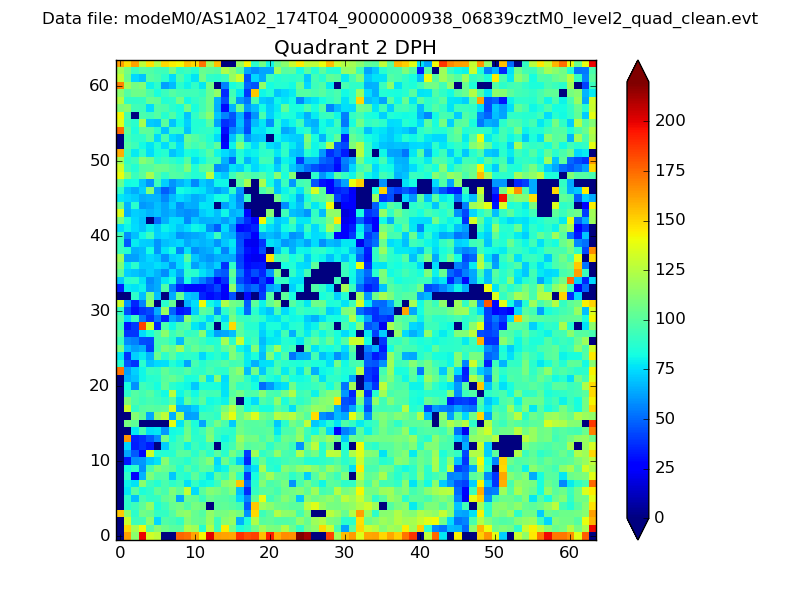 |
Quadrant C |
| Plot type | Count rate plots | Images |
|---|---|---|
| Comparison with Poisson distribution Blue bars denote a histogram of data divided into 1 sec bins. Red curve is a Poisson curve with rate = median count rate of data. |
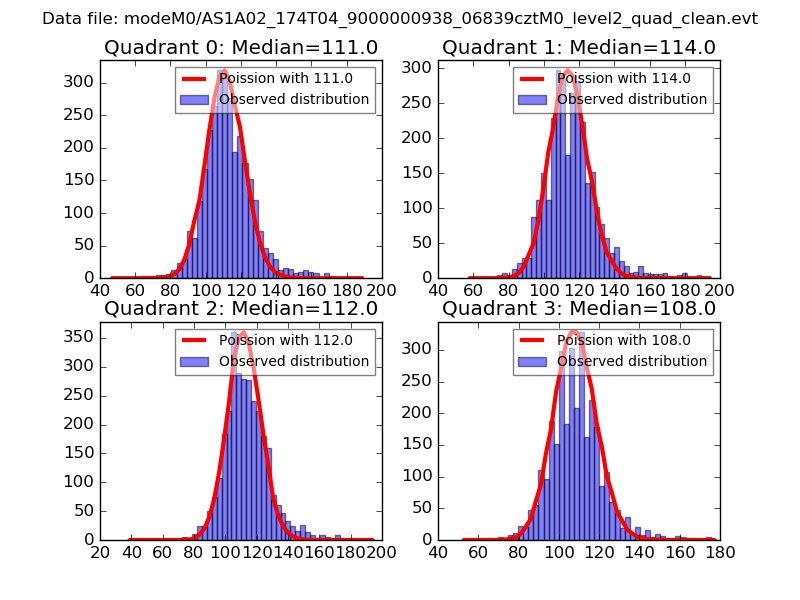 |
 |
| Quadrant-wise count rates Data is divided into 100 sec bins |
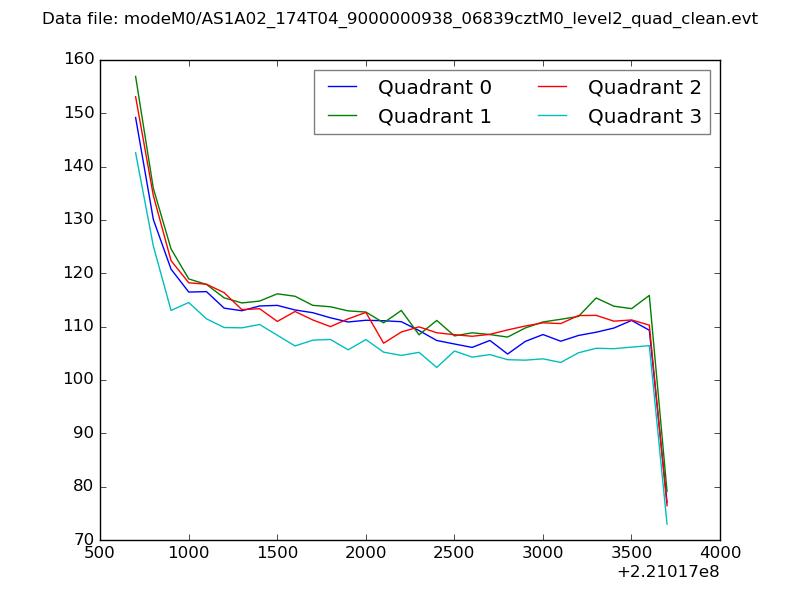 |
|
| Module-wise count rates for Quadrant A Data is divided into 100 sec bins |
 |
 |
| Module-wise count rates for Quadrant B Data is divided into 100 sec bins |
 |
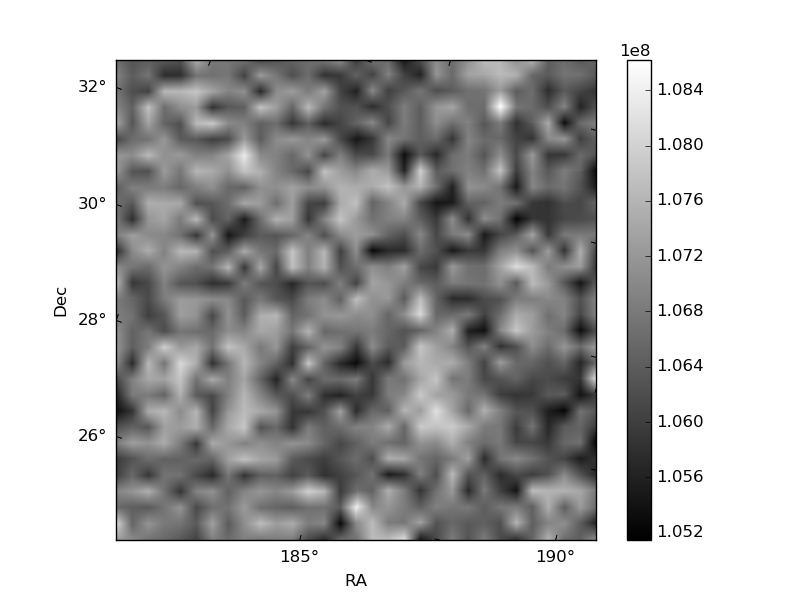 |
| Module-wise count rates for Quadrant C Data is divided into 100 sec bins |
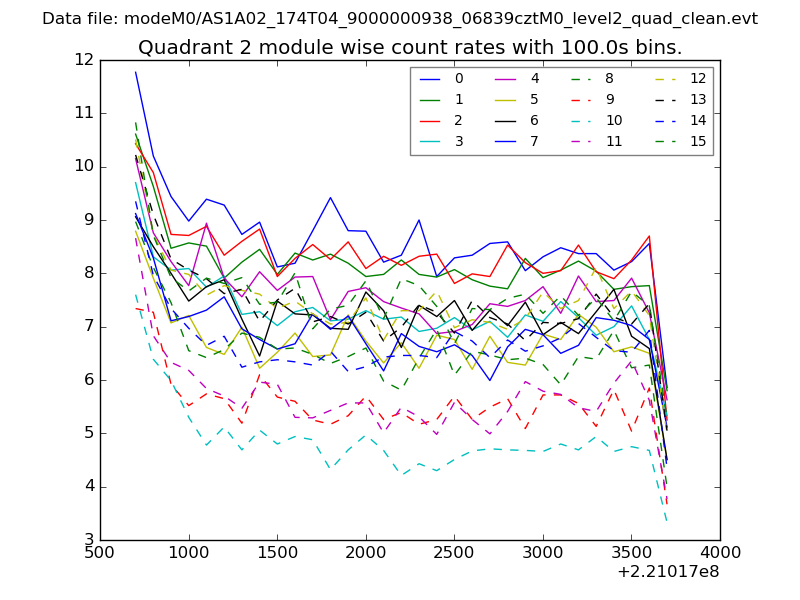 |
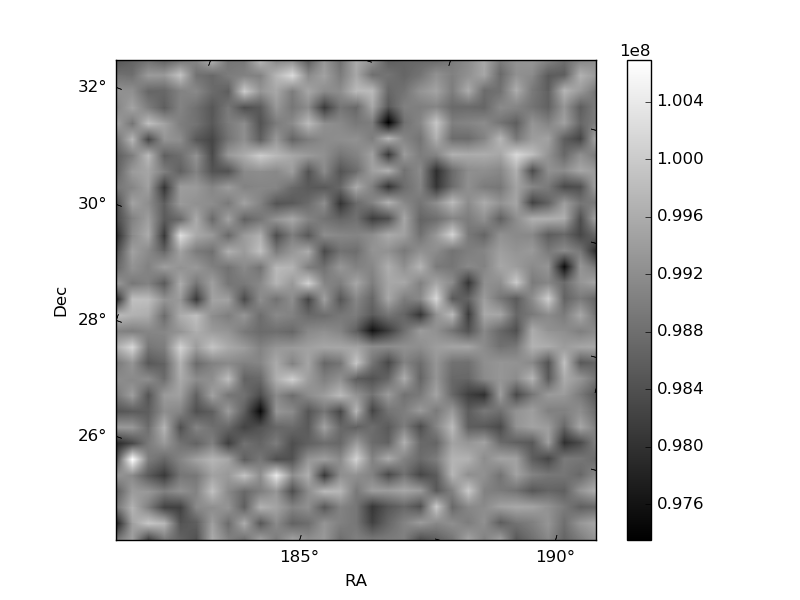 |
| Module-wise count rates for Quadrant D Data is divided into 100 sec bins |
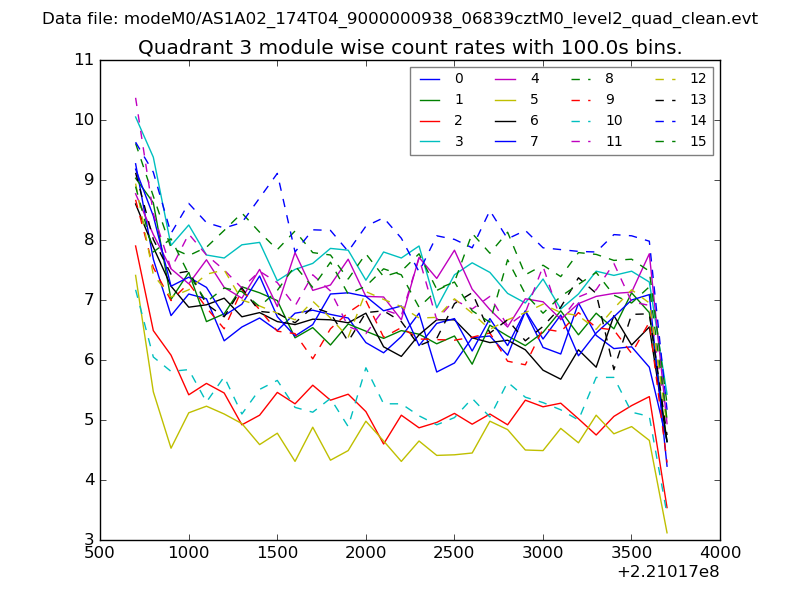 |
 |
| Parameter | Plot |
|---|---|
| CZT HV Monitor | 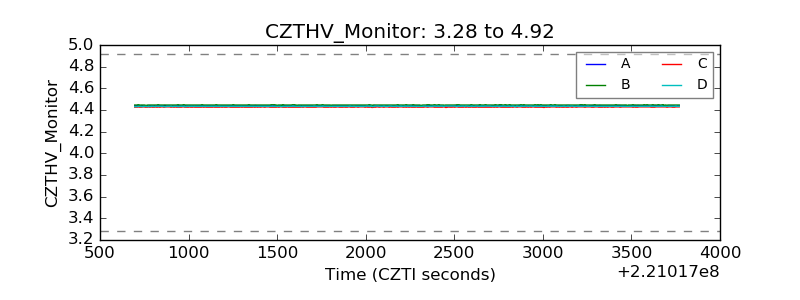 |
| D_VDD | 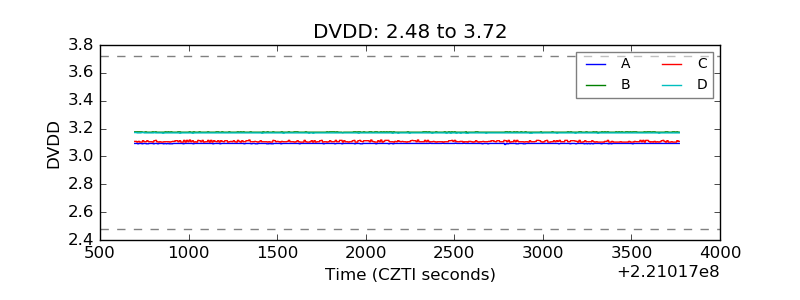 |
| Temperature 1 | 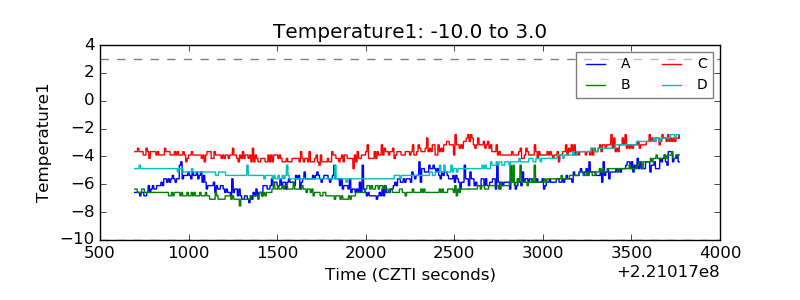 |
| Veto HV Monitor | 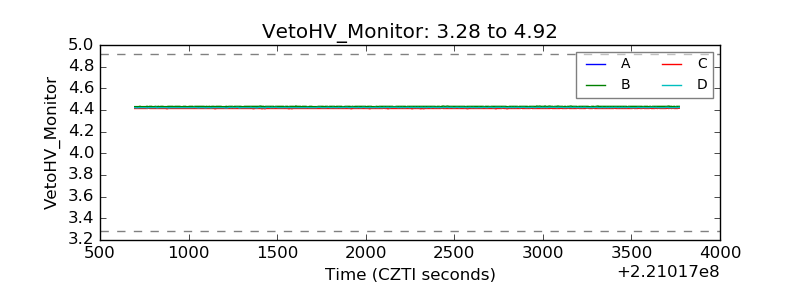 |
| Veto LLD | 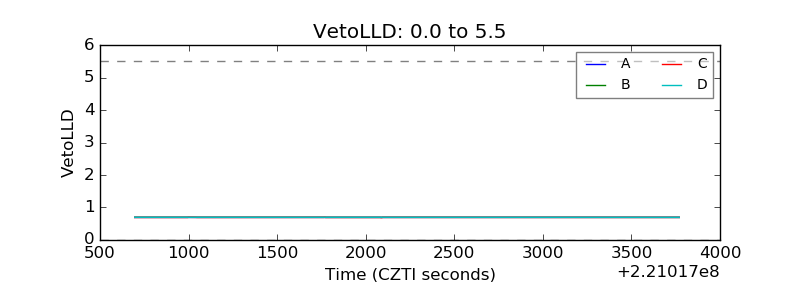 |
| Alpha Counter | 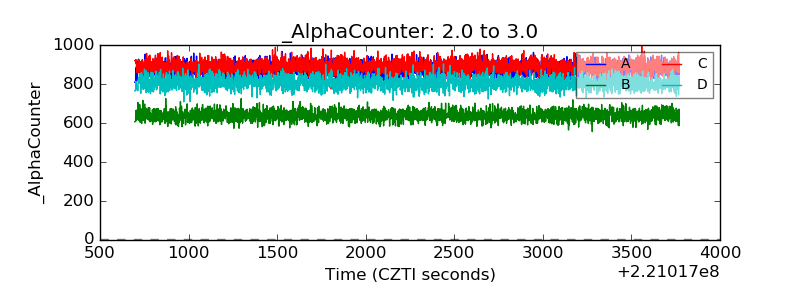 |
| _CPM_Rate | 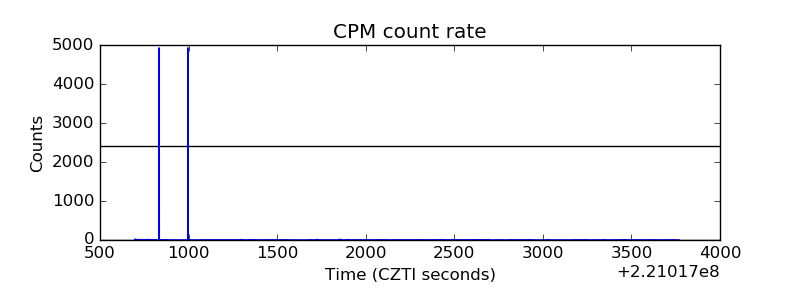 |
| CZT Counter | 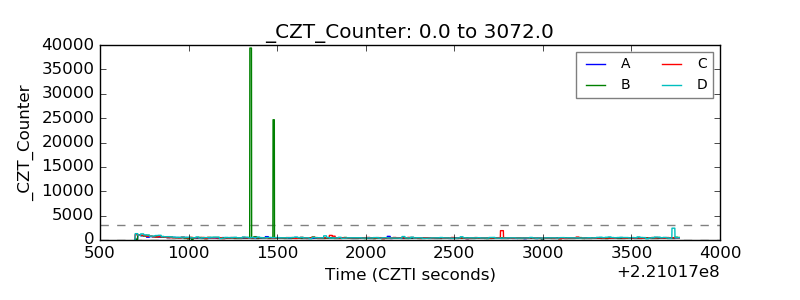 |
| +2.5 Volts monitor |  |
| +5 Volts monitor |  |
| _ROLL_ROT | 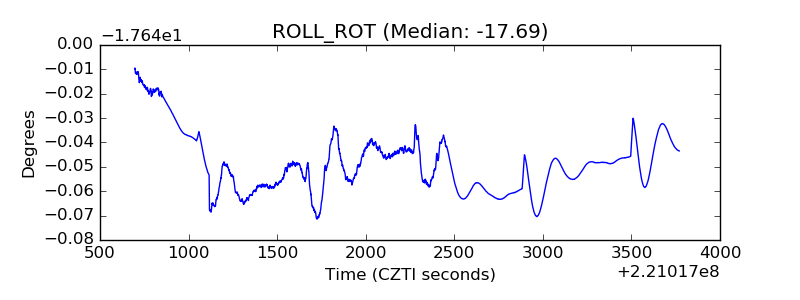 |
| _Roll_DEC | 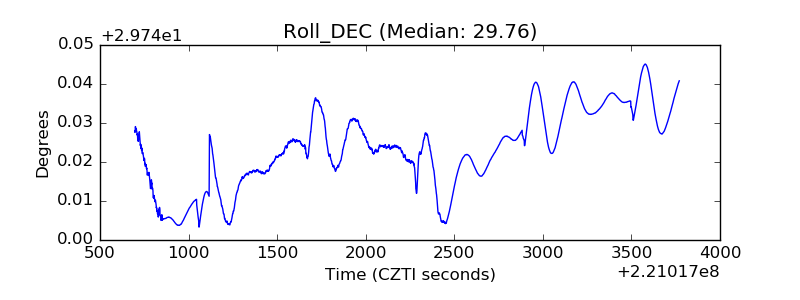 |
| _Roll_RA | 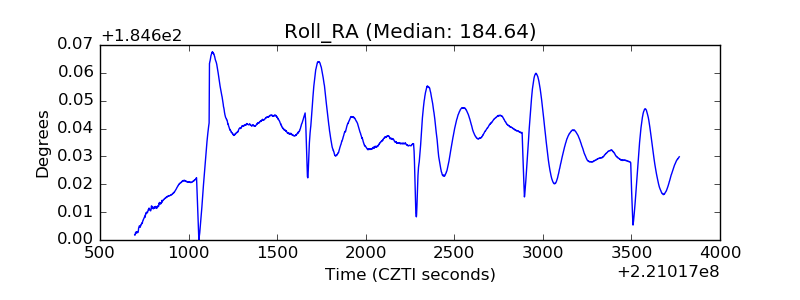 |
| Veto Counter |  |