| Param | Original file | Final file |
|---|---|---|
| Filename | modeM0/AS1A02_174T04_9000000938_06841cztM0_level2.evt | modeM0/AS1A02_174T04_9000000938_06841cztM0_level2_quad_clean.evt |
| Size (bytes) | 423,866,880 | 79,565,760 |
| Size | 404.2 MB | 75.9 MB |
| Events in quadrant A | 2,908,185 | 494,102 |
| Events in quadrant B | 3,000,097 | 502,196 |
| Events in quadrant C | 3,033,200 | 495,120 |
| Events in quadrant D | 3,463,039 | 474,279 |
| Mode M9 | |||
|---|---|---|---|
| Quadrant | BADHDUFLAG | Total packets | Discarded packets |
| A | 0 | 10 | 0 |
| B | 0 | 10 | 0 |
| C | 0 | 10 | 0 |
| D | 0 | 10 | 0 |
| Mode M0 | |||
|---|---|---|---|
| Quadrant | BADHDUFLAG | Total packets | Discarded packets |
| A | 0 | 12889 | 2 |
| B | 0 | 12990 | 1 |
| C | 0 | 13257 | 1 |
| D | 0 | 14094 | 4 |
| Mode SS | |||
|---|---|---|---|
| Quadrant | BADHDUFLAG | Total packets | Discarded packets |
| A | 0 | 128 | 0 |
| B | 0 | 128 | 0 |
| C | 0 | 128 | 0 |
| D | 0 | 128 | 0 |
| Quadrant | Total seconds | Saturated seconds | Saturation percentage |
|---|---|---|---|
| A | 6361 | 46 | 0.723157% |
| B | 6361 | 45 | 0.707436% |
| C | 6361 | 38 | 0.597390% |
| D | 6360 | 54 | 0.849057% |
Noise dominated data is calculated using 1-second bins in cleaned event files. If a bin has >2000 counts, and if more than 50% of those come from <1% of pixels, then it is considered to be noise-dominated and hence unusable.
| Quadrant | # 1 sec bins | Bins with >0 counts | Bins with >2000 counts | High rate bins dominated by noise | Noise dominated (total time) | Noise dominated (detector-on time) | Marked lightcurve |
|---|---|---|---|---|---|---|---|
| A | 7358 | 6363 | 0 | 0 | 0.00% | 0.00% | 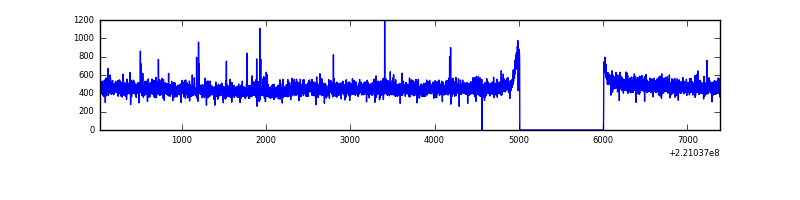 |
| B | 7358 | 6363 | 1 | 1 | 0.01% | 0.02% | 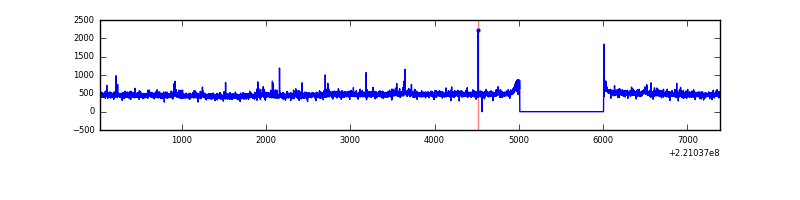 |
| C | 7358 | 6363 | 6 | 6 | 0.08% | 0.09% |  |
| D | 7357 | 6362 | 14 | 14 | 0.19% | 0.22% | 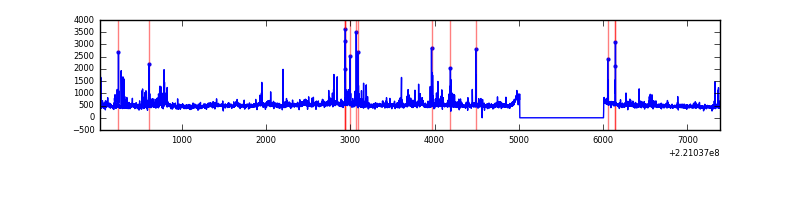 |
Top three noisy pixels from each quadrant. If the there are fewer than three noisy pixels in the level2.evt file, extra rows are filled as -1
| Pixel properties | Quadrant properties | ||||||
|---|---|---|---|---|---|---|---|
| Quadrant | DetID | PixID | Counts | Sigma | Mean | Median | Sigma |
| A | 15 | 239 | 17167 | 107.47 | 744 | 727 | 153.0 |
| A | 8 | 15 | 16660 | 104.16 | 744 | 727 | 153.0 |
| A | 0 | 226 | 7156 | 42.03 | 744 | 727 | 153.0 |
| B | 0 | 219 | 42851 | 291.17 | 747 | 730 | 144.7 |
| B | 4 | 81 | 21248 | 141.83 | 747 | 730 | 144.7 |
| B | 12 | 111 | 14651 | 96.23 | 747 | 730 | 144.7 |
| C | 9 | 68 | 141425 | 840.97 | 720 | 723 | 167.3 |
| C | 10 | 22 | 61744 | 364.72 | 720 | 723 | 167.3 |
| C | 9 | 247 | 11524 | 64.56 | 720 | 723 | 167.3 |
| D | 8 | 195 | 407891 | 2288.41 | 722 | 699 | 177.9 |
| D | 2 | 216 | 116189 | 649.05 | 722 | 699 | 177.9 |
| D | 2 | 136 | 82486 | 459.64 | 722 | 699 | 177.9 |
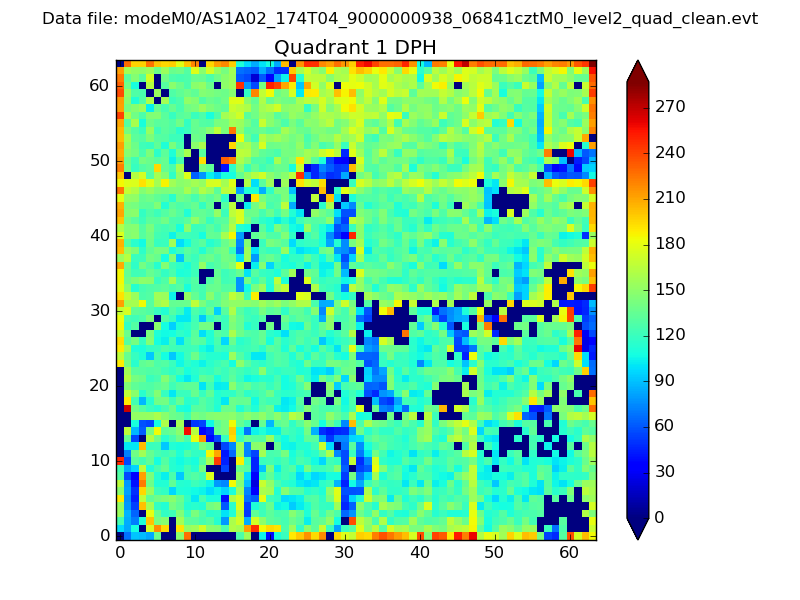
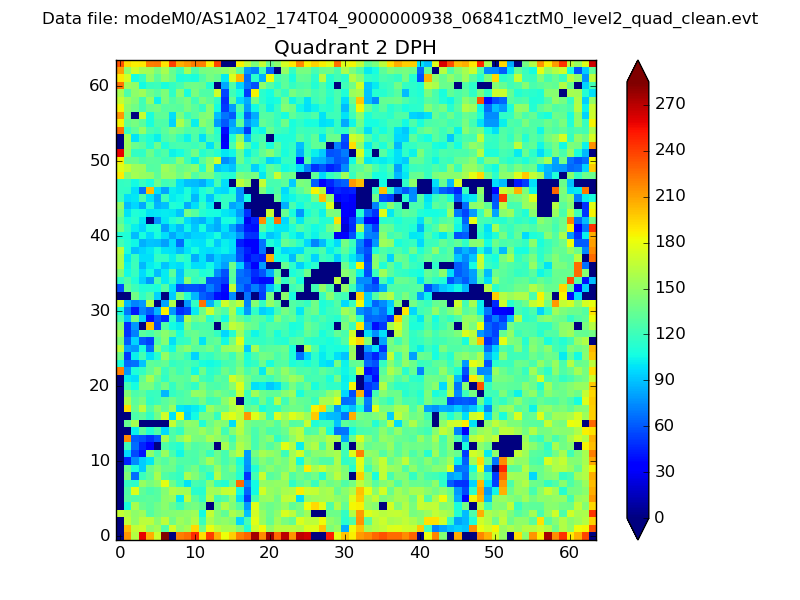
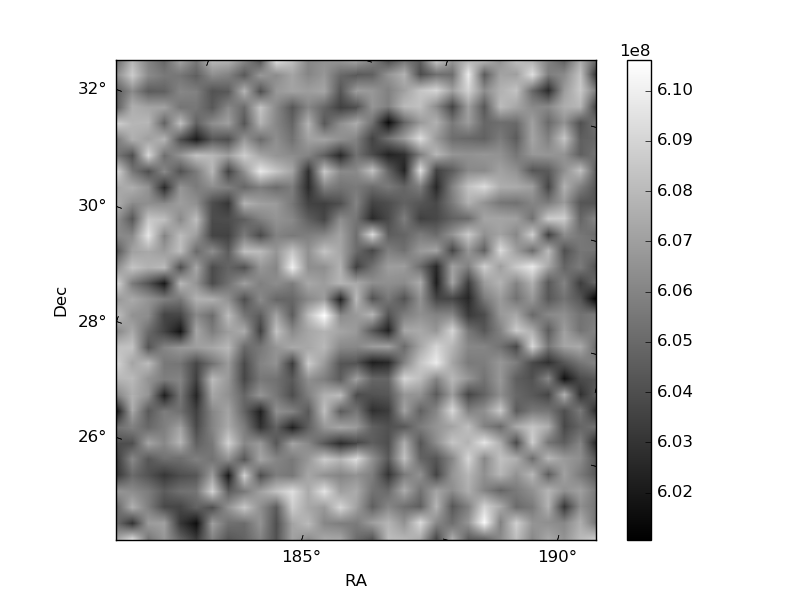
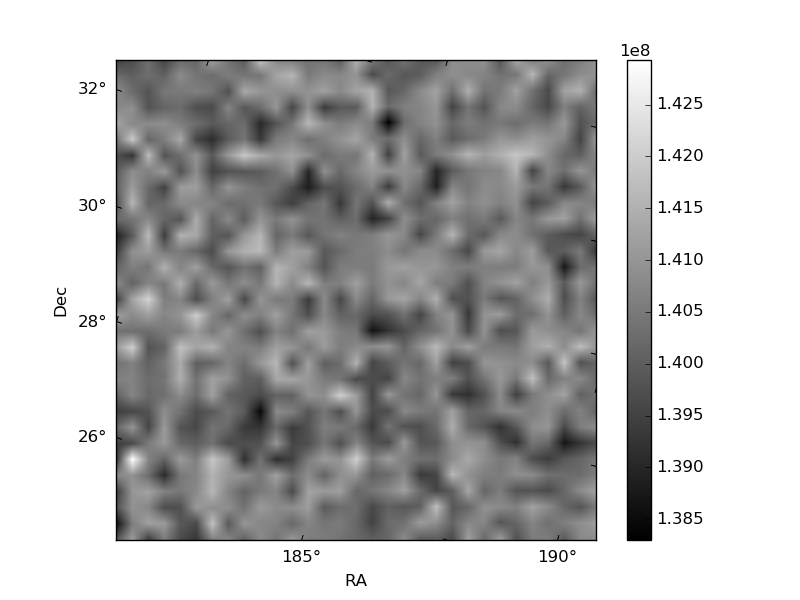
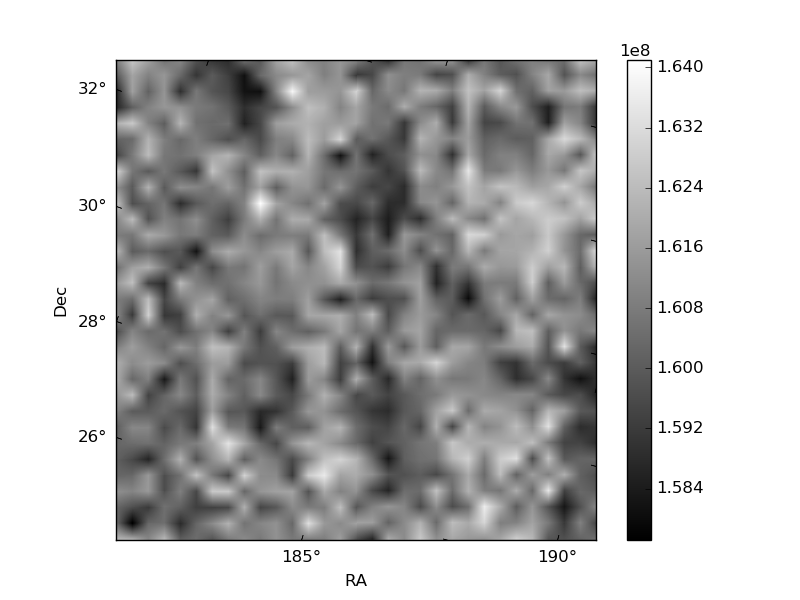
Histogram calculated using DETX and DETY for each event in the final _common_clean file
| Quadrant A | 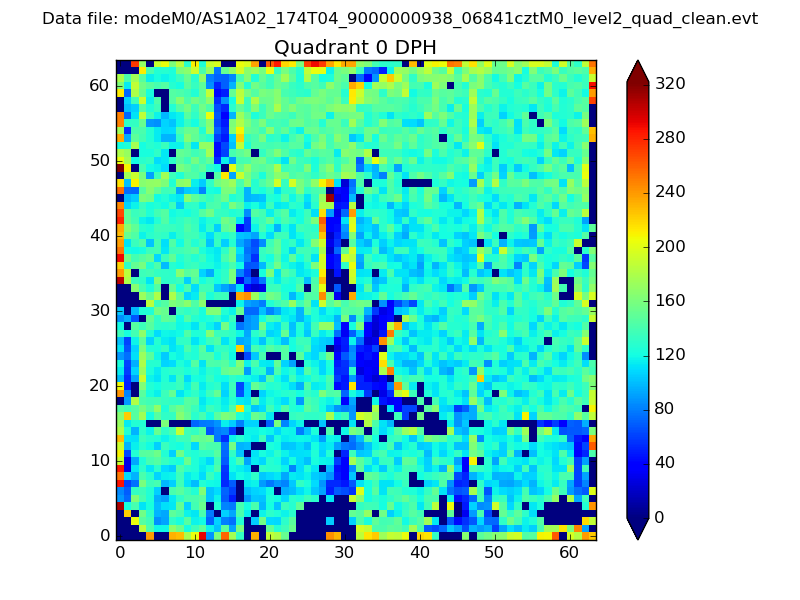 |
 |
Quadrant B |
|---|---|---|---|
| Quadrant D | 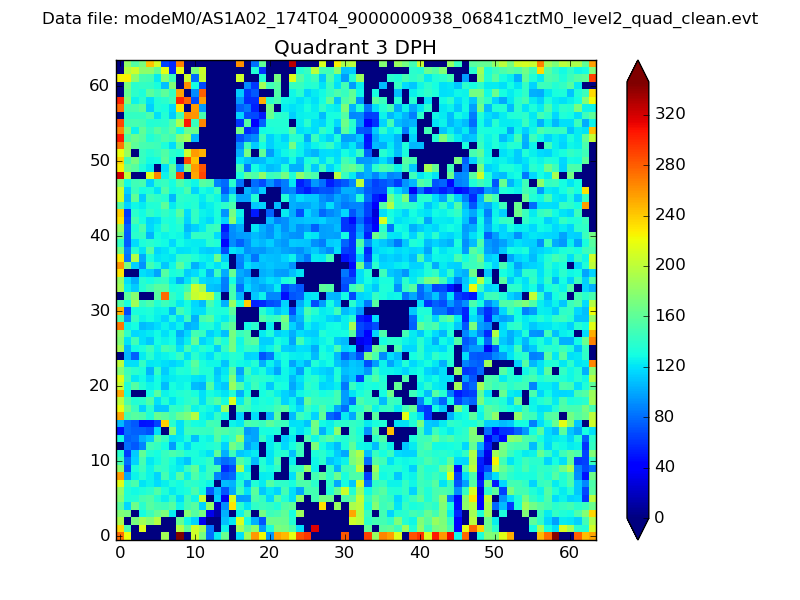 |
 |
Quadrant C |
| Plot type | Count rate plots | Images |
|---|---|---|
| Comparison with Poisson distribution Blue bars denote a histogram of data divided into 1 sec bins. Red curve is a Poisson curve with rate = median count rate of data. |
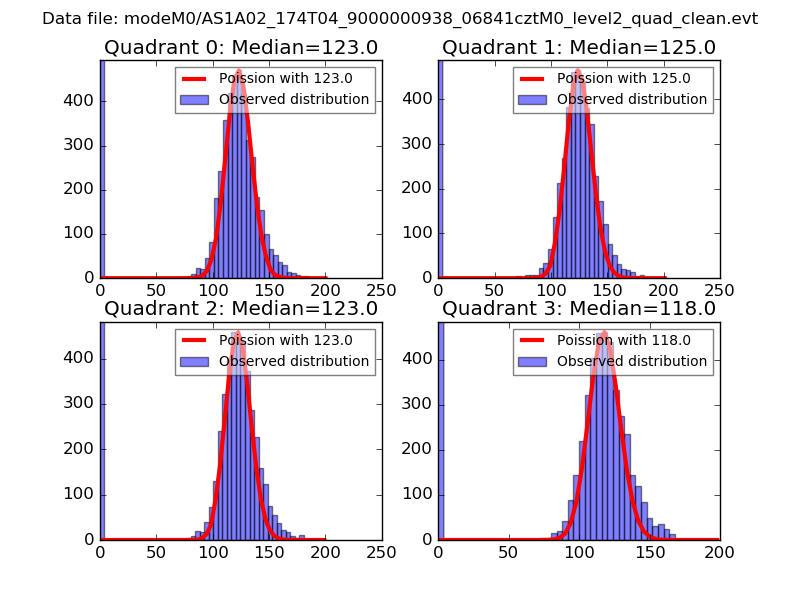 |
 |
| Quadrant-wise count rates Data is divided into 100 sec bins |
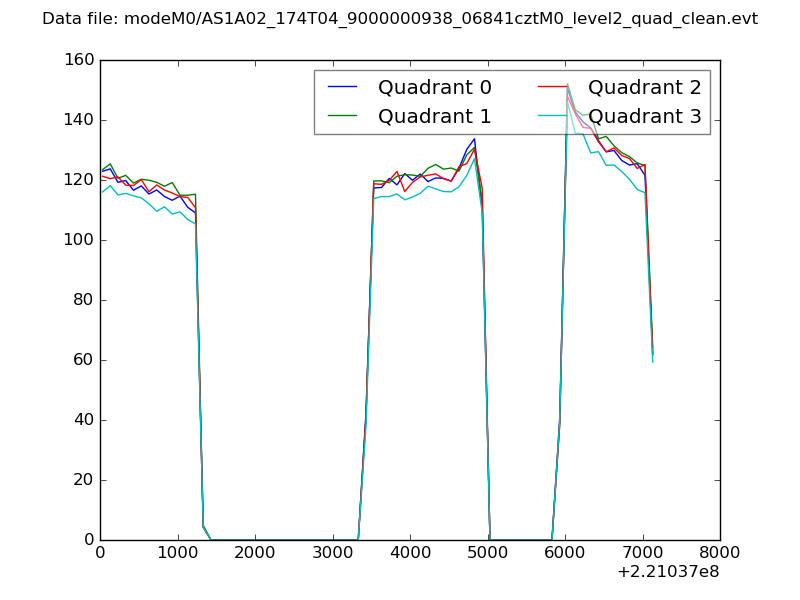 |
|
| Module-wise count rates for Quadrant A Data is divided into 100 sec bins |
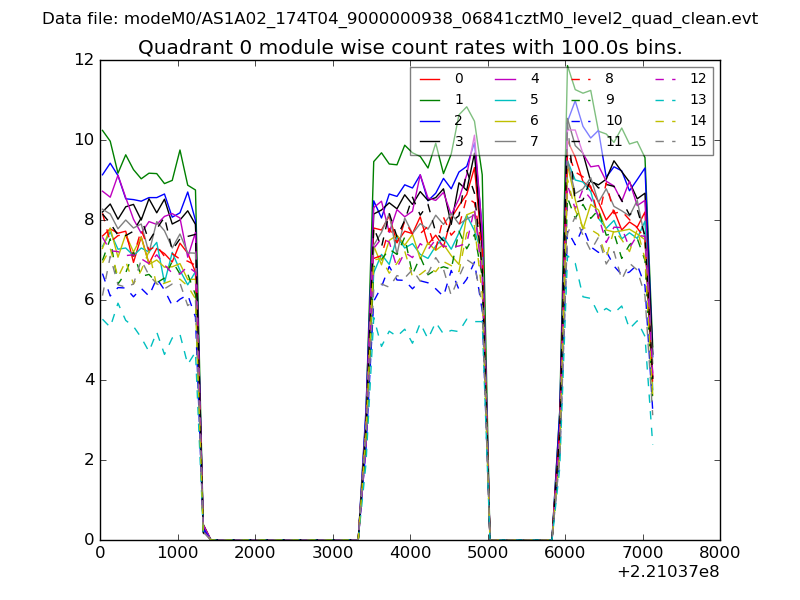 |
 |
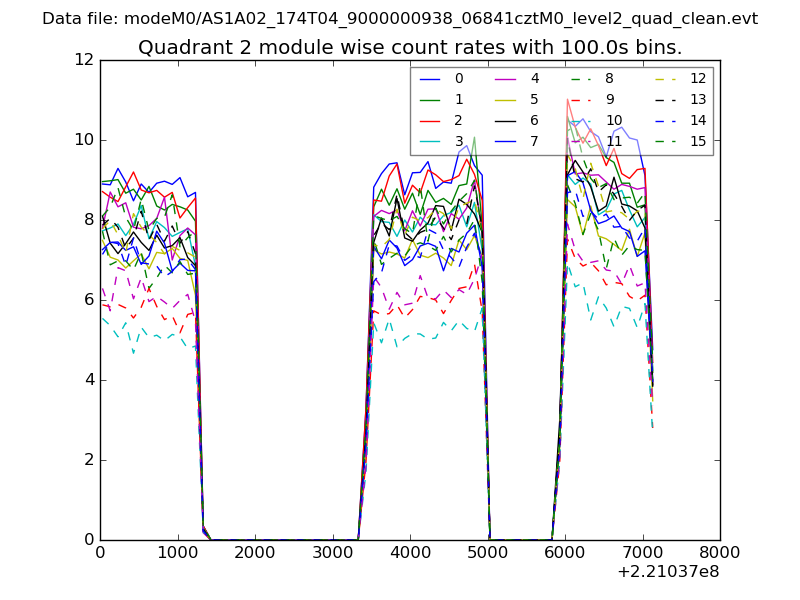
| Module-wise count rates for Quadrant B Data is divided into 100 sec bins |
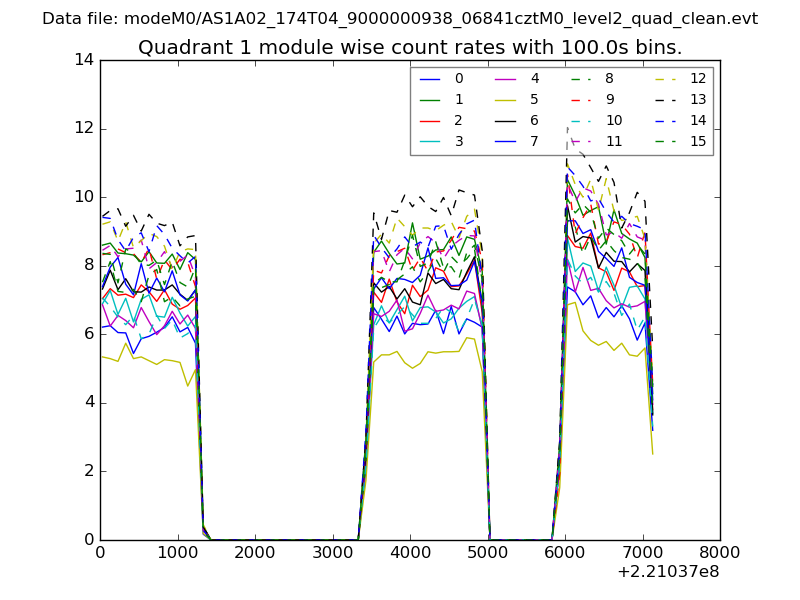 |
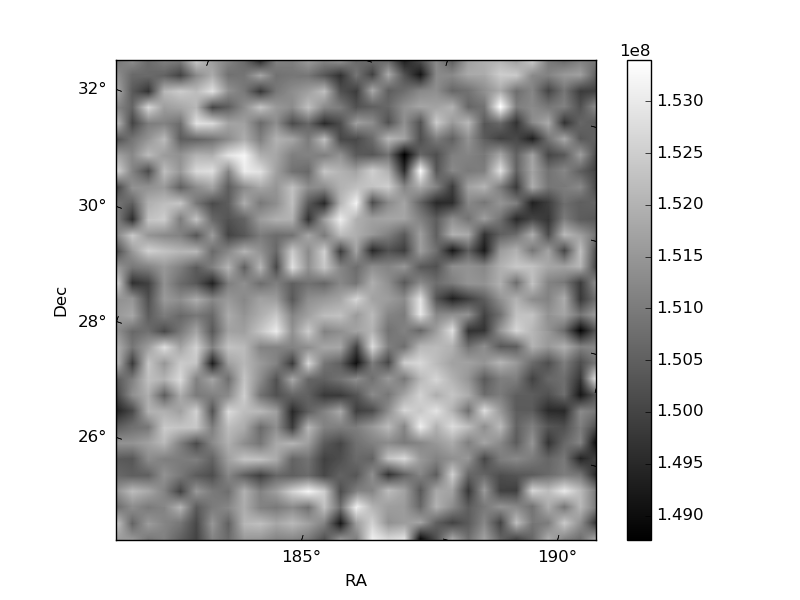 |
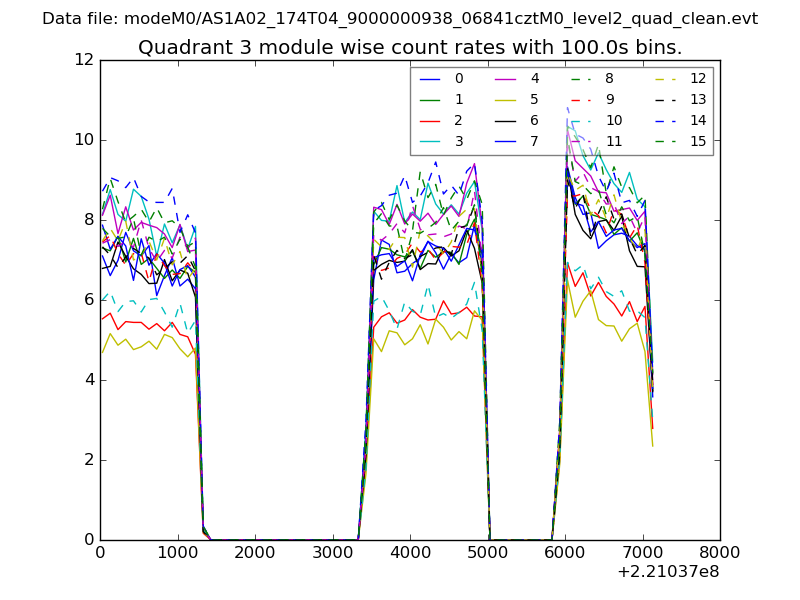
| Module-wise count rates for Quadrant C Data is divided into 100 sec bins |
 |
 |
| Module-wise count rates for Quadrant D Data is divided into 100 sec bins |
 |
 |
| Parameter | Plot |
|---|---|
| CZT HV Monitor |  |
| D_VDD | 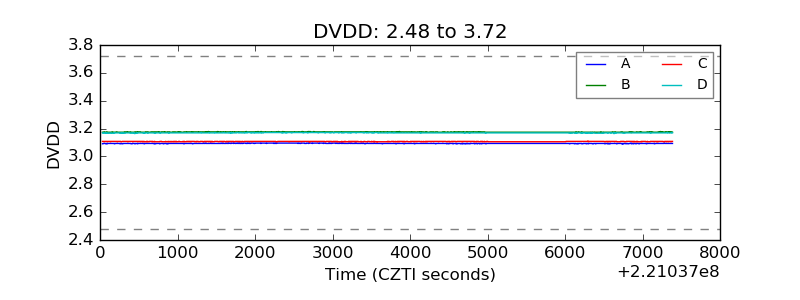 |
| Temperature 1 | 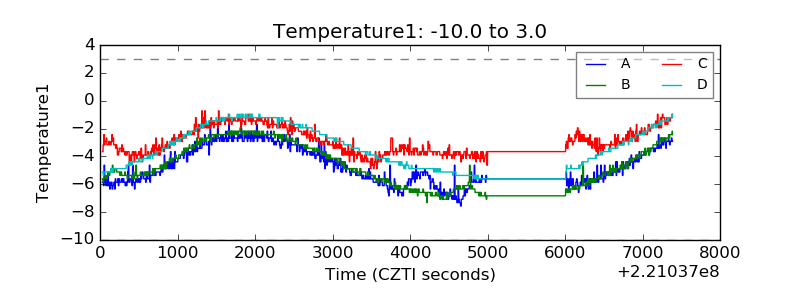 |
| Veto HV Monitor | 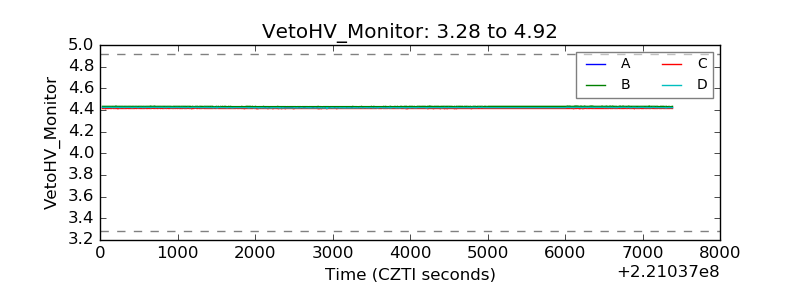 |
| Veto LLD | 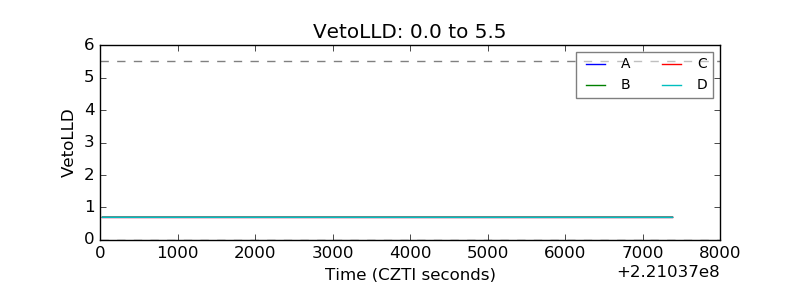 |
| Alpha Counter | 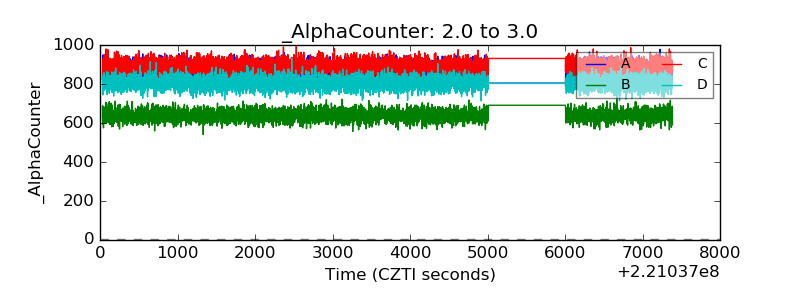 |
| _CPM_Rate | 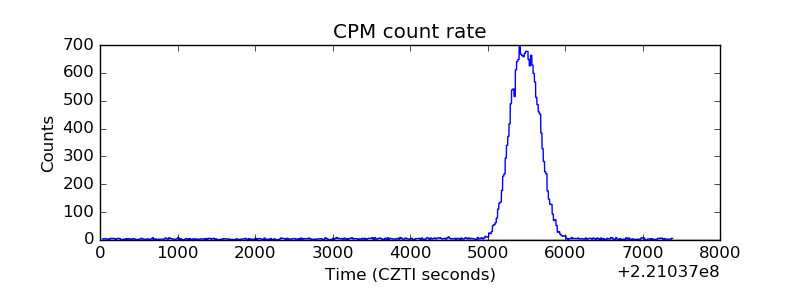 |
| CZT Counter | 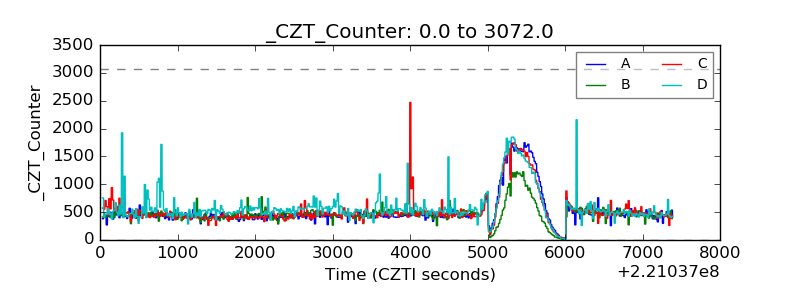 |
| +2.5 Volts monitor |  |
| +5 Volts monitor |  |
| _ROLL_ROT | 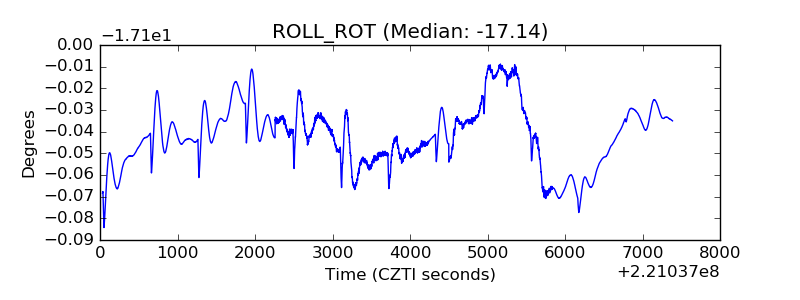 |
| _Roll_DEC | 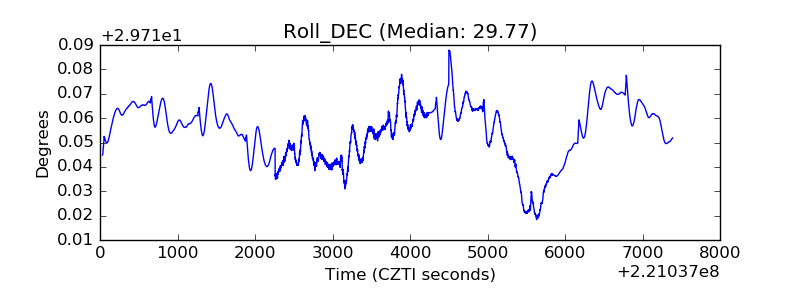 |
| _Roll_RA | 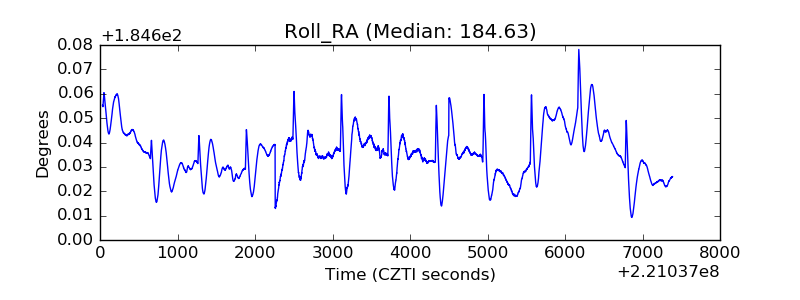 |
| Veto Counter | 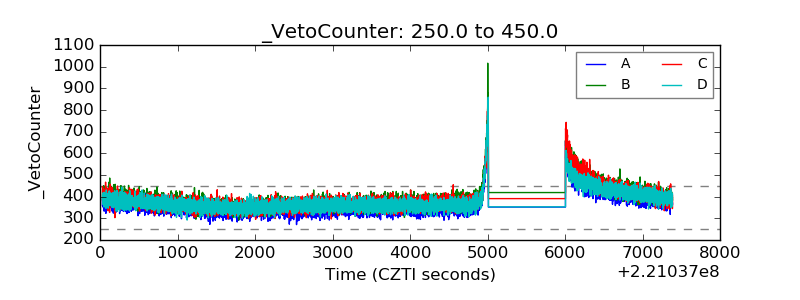 |