| Param | Original file | Final file |
|---|---|---|
| Filename | modeM0/AS1A02_174T04_9000000938_06843cztM0_level2.evt | modeM0/AS1A02_174T04_9000000938_06843cztM0_level2_quad_clean.evt |
| Size (bytes) | 460,782,720 | 76,628,160 |
| Size | 439.4 MB | 73.1 MB |
| Events in quadrant A | 3,019,771 | 479,258 |
| Events in quadrant B | 4,002,145 | 464,232 |
| Events in quadrant C | 3,028,620 | 479,131 |
| Events in quadrant D | 3,478,574 | 460,162 |
| Mode M9 | |||
|---|---|---|---|
| Quadrant | BADHDUFLAG | Total packets | Discarded packets |
| A | 0 | 11 | 0 |
| B | 0 | 11 | 0 |
| C | 0 | 11 | 0 |
| D | 0 | 11 | 0 |
| Mode M0 | |||
|---|---|---|---|
| Quadrant | BADHDUFLAG | Total packets | Discarded packets |
| A | 0 | 13067 | 2 |
| B | 0 | 15773 | 1 |
| C | 0 | 12998 | 1 |
| D | 0 | 14310 | 1 |
| Mode SS | |||
|---|---|---|---|
| Quadrant | BADHDUFLAG | Total packets | Discarded packets |
| A | 0 | 128 | 0 |
| B | 0 | 128 | 0 |
| C | 0 | 128 | 0 |
| D | 0 | 128 | 0 |
| Quadrant | Total seconds | Saturated seconds | Saturation percentage |
|---|---|---|---|
| A | 6263 | 64 | 1.021875% |
| B | 6263 | 443 | 7.073288% |
| C | 6263 | 47 | 0.750439% |
| D | 6263 | 72 | 1.149609% |
Noise dominated data is calculated using 1-second bins in cleaned event files. If a bin has >2000 counts, and if more than 50% of those come from <1% of pixels, then it is considered to be noise-dominated and hence unusable.
| Quadrant | # 1 sec bins | Bins with >0 counts | Bins with >2000 counts | High rate bins dominated by noise | Noise dominated (total time) | Noise dominated (detector-on time) | Marked lightcurve |
|---|---|---|---|---|---|---|---|
| A | 7368 | 6264 | 1 | 1 | 0.01% | 0.02% | 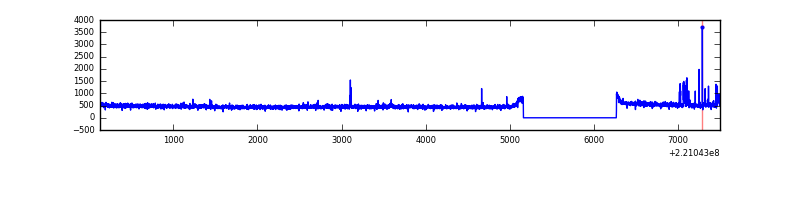 |
| B | 7368 | 6264 | 292 | 292 | 3.96% | 4.66% | 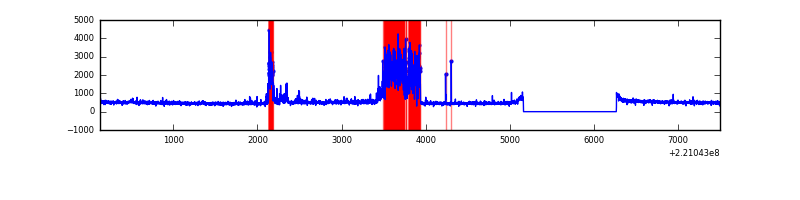 |
| C | 7368 | 6264 | 1 | 1 | 0.01% | 0.02% | 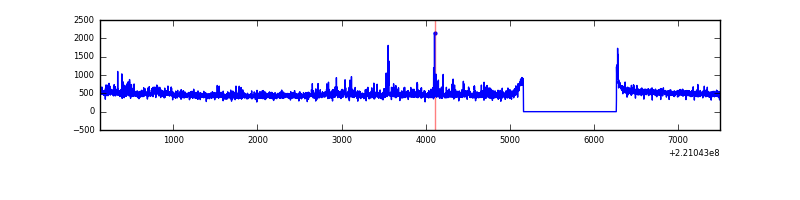 |
| D | 7368 | 6264 | 12 | 12 | 0.16% | 0.19% | 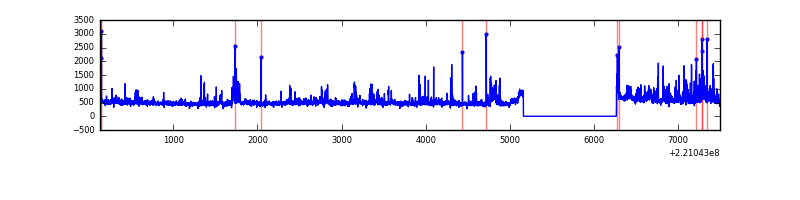 |
Top three noisy pixels from each quadrant. If the there are fewer than three noisy pixels in the level2.evt file, extra rows are filled as -1
| Pixel properties | Quadrant properties | ||||||
|---|---|---|---|---|---|---|---|
| Quadrant | DetID | PixID | Counts | Sigma | Mean | Median | Sigma |
| A | 8 | 15 | 60767 | 385.41 | 762 | 748 | 155.7 |
| A | 13 | 248 | 15276 | 93.29 | 762 | 748 | 155.7 |
| A | 14 | 111 | 9687 | 57.4 | 762 | 748 | 155.7 |
| B | 0 | 228 | 1075981 | 7518.67 | 745 | 728 | 143.0 |
| B | 12 | 111 | 14415 | 95.71 | 745 | 728 | 143.0 |
| B | 0 | 219 | 12932 | 85.34 | 745 | 728 | 143.0 |
| C | 9 | 68 | 105483 | 613.82 | 737 | 741 | 170.6 |
| C | 10 | 22 | 39628 | 227.89 | 737 | 741 | 170.6 |
| C | 13 | 61 | 5556 | 28.22 | 737 | 741 | 170.6 |
| D | 8 | 195 | 237012 | 1295.61 | 742 | 720 | 182.4 |
| D | 2 | 152 | 173179 | 945.6 | 742 | 720 | 182.4 |
| D | 2 | 216 | 107499 | 585.48 | 742 | 720 | 182.4 |
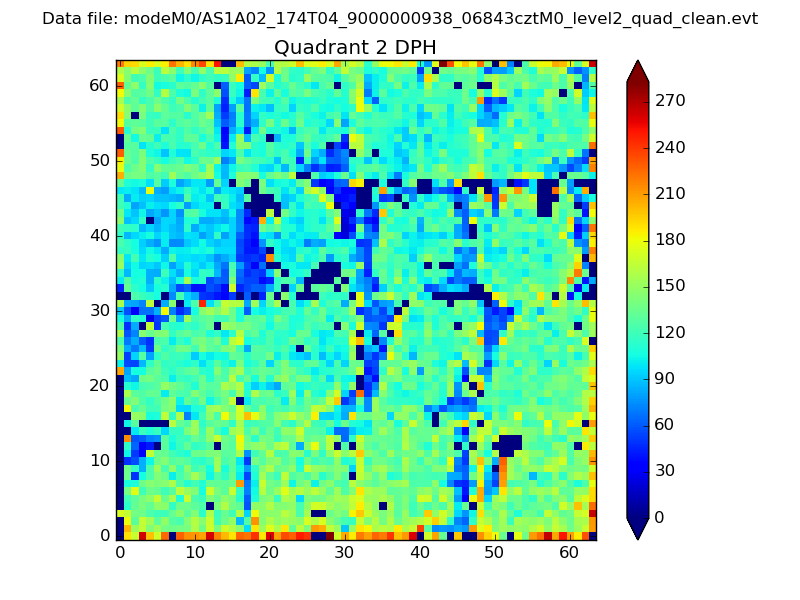
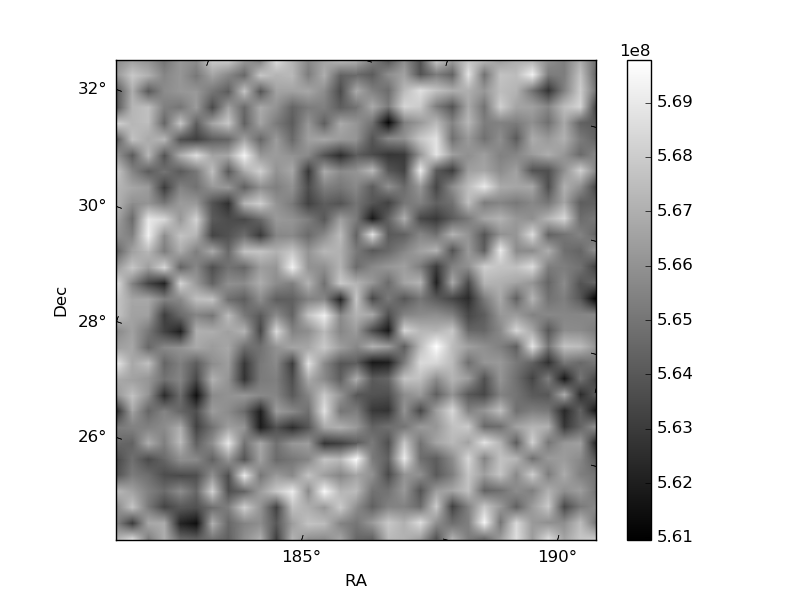
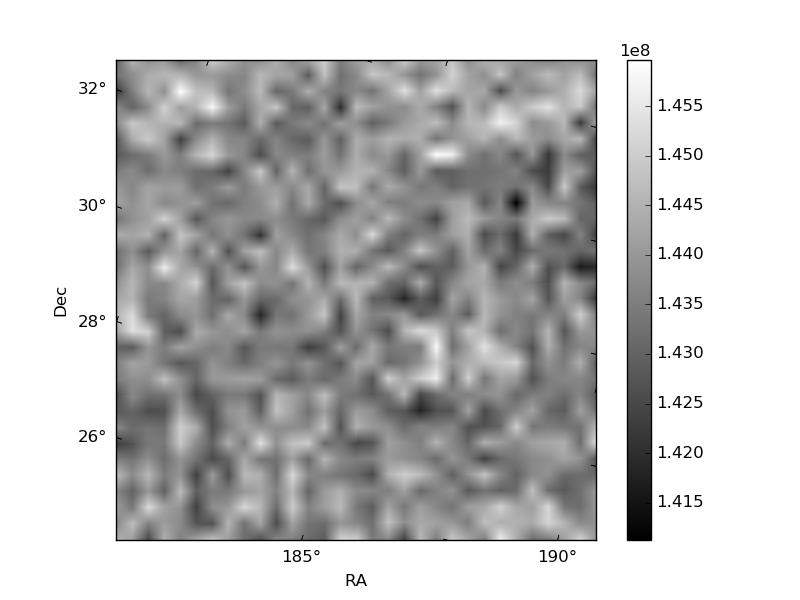
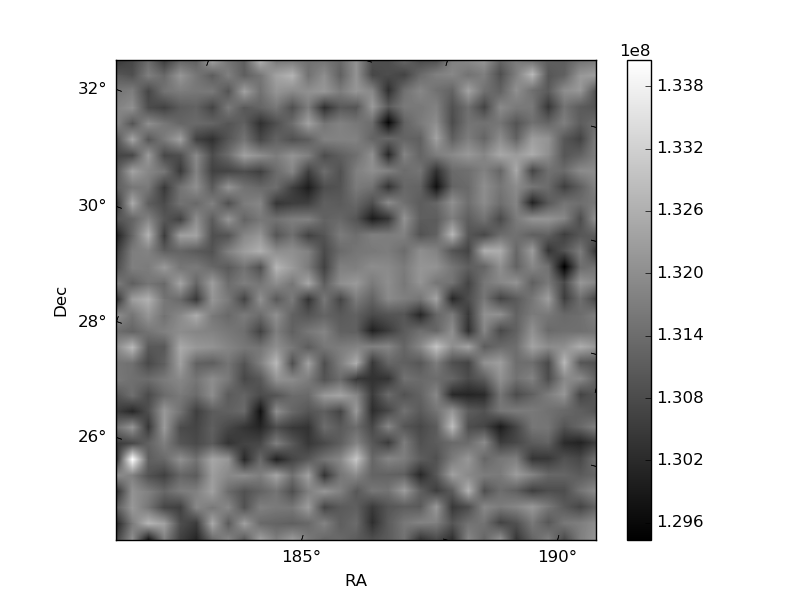
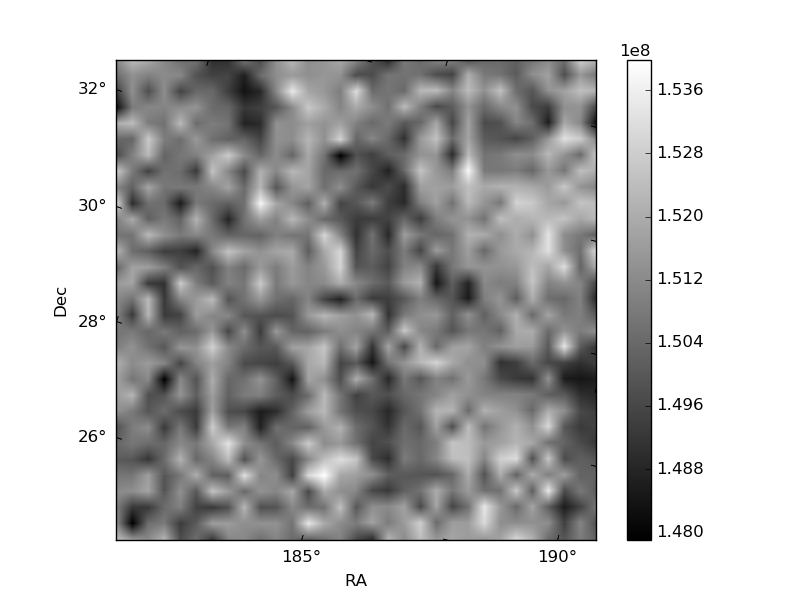
Histogram calculated using DETX and DETY for each event in the final _common_clean file
| Quadrant A | 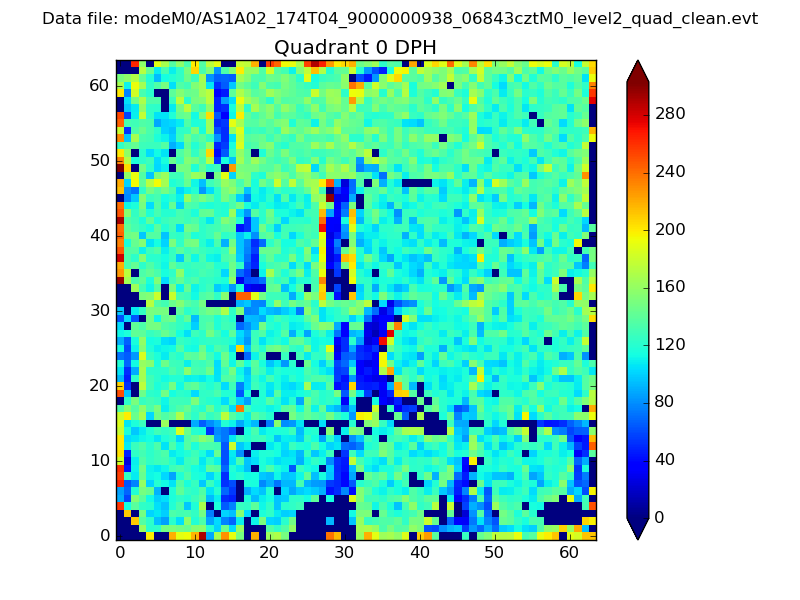 |
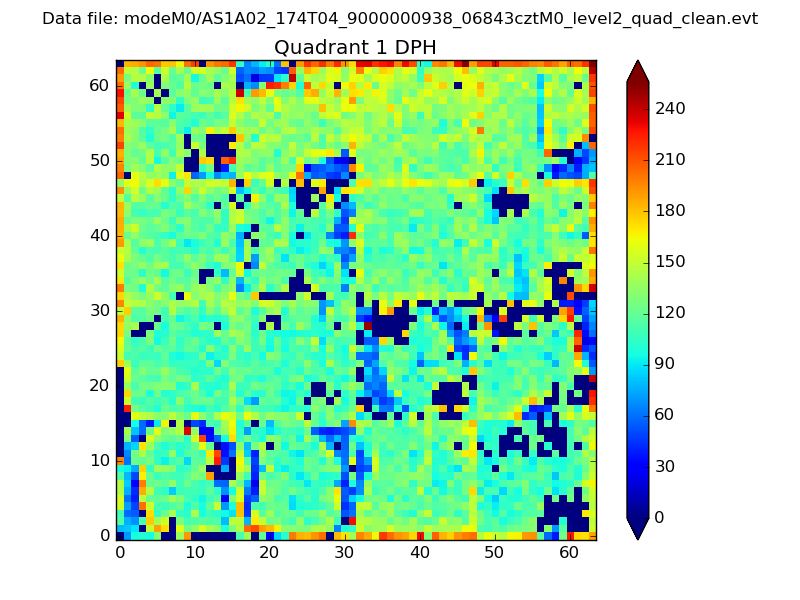 |
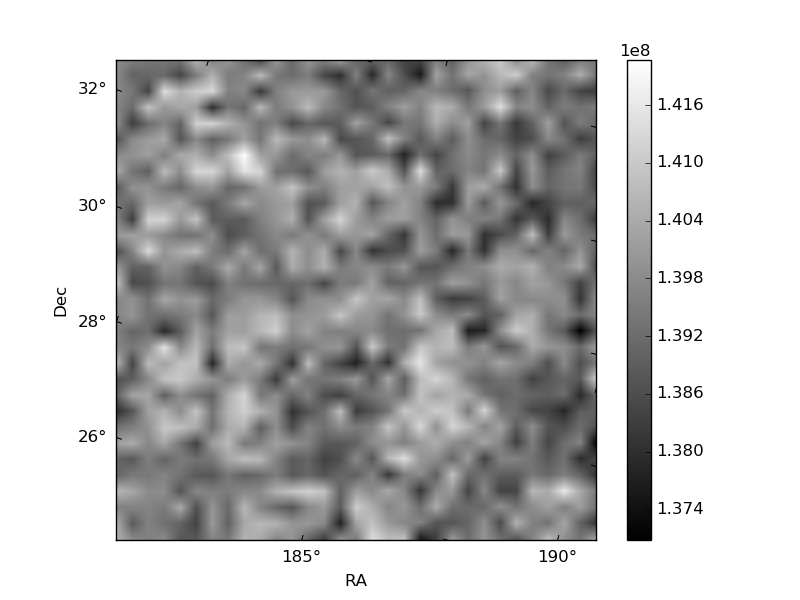
Quadrant B |
|---|---|---|---|
| Quadrant D | 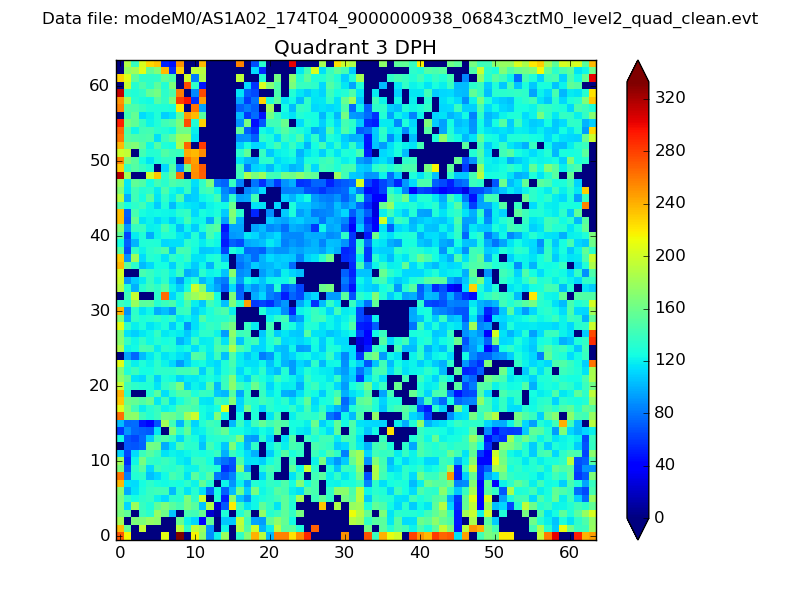 |
 |
Quadrant C |
| Plot type | Count rate plots | Images |
|---|---|---|
| Comparison with Poisson distribution Blue bars denote a histogram of data divided into 1 sec bins. Red curve is a Poisson curve with rate = median count rate of data. |
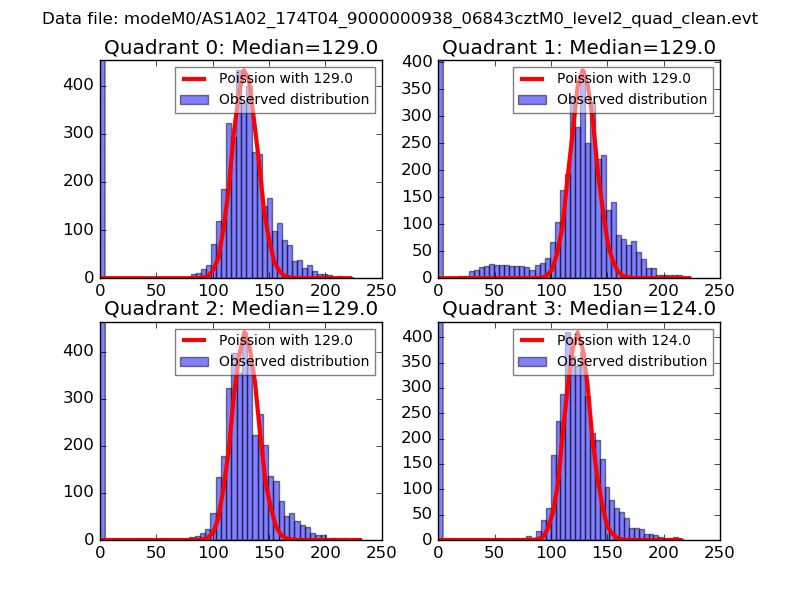 |
 |
| Quadrant-wise count rates Data is divided into 100 sec bins |
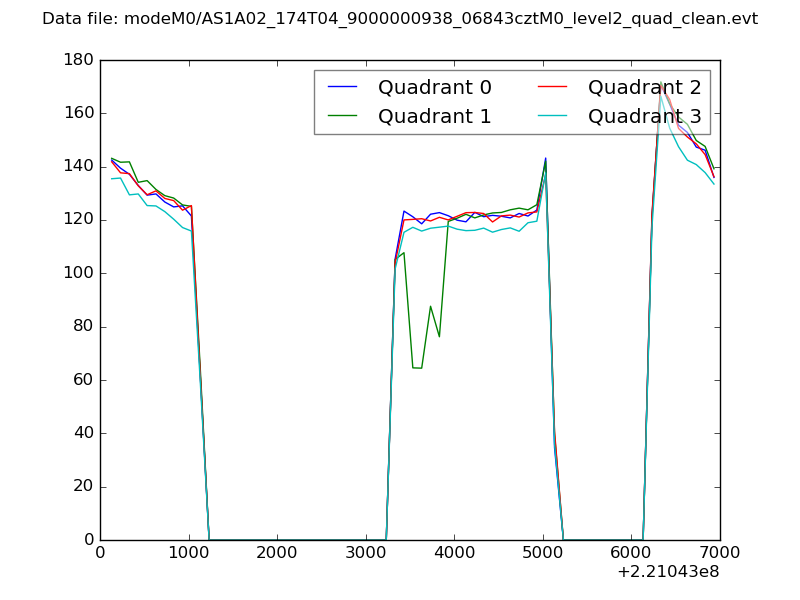 |
|
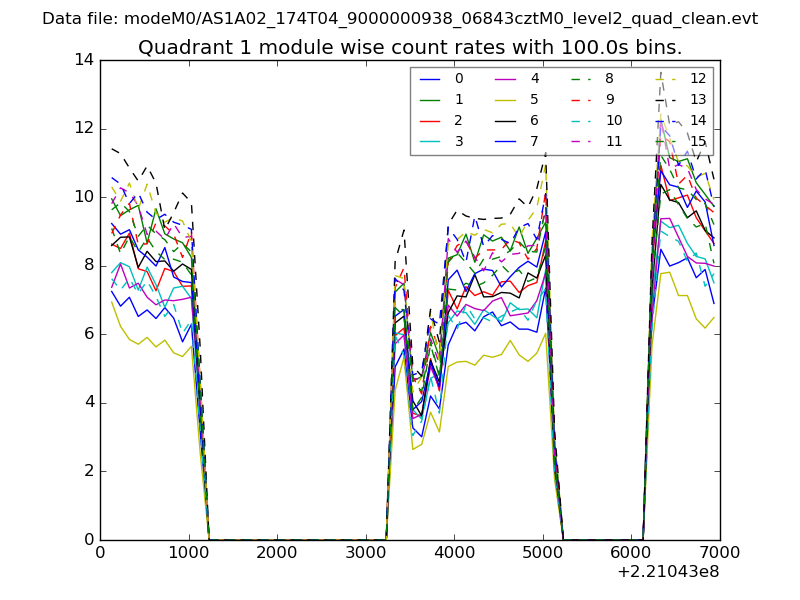
| Module-wise count rates for Quadrant A Data is divided into 100 sec bins |
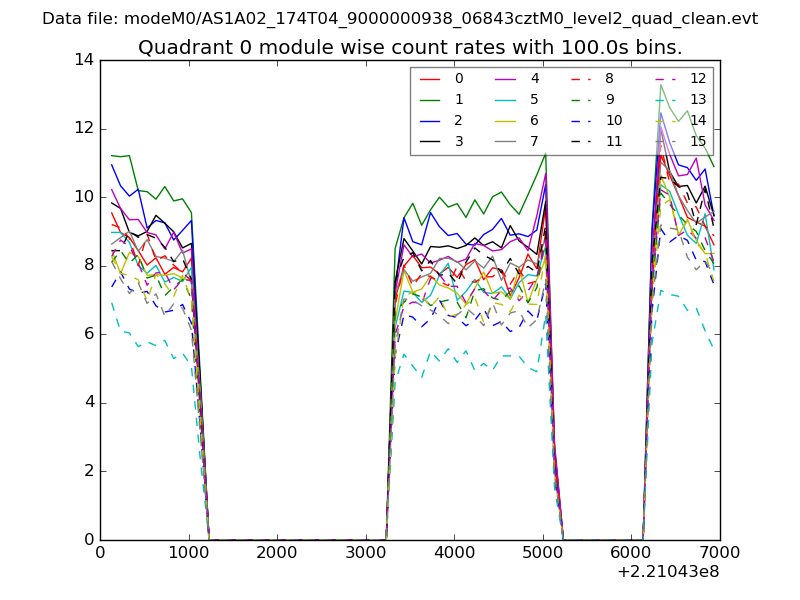 |
 |
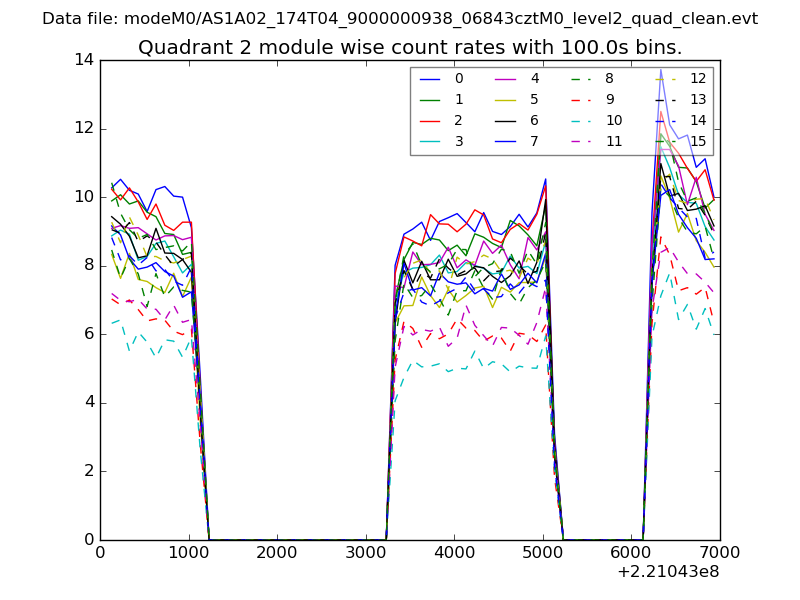
| Module-wise count rates for Quadrant B Data is divided into 100 sec bins |
 |
 |
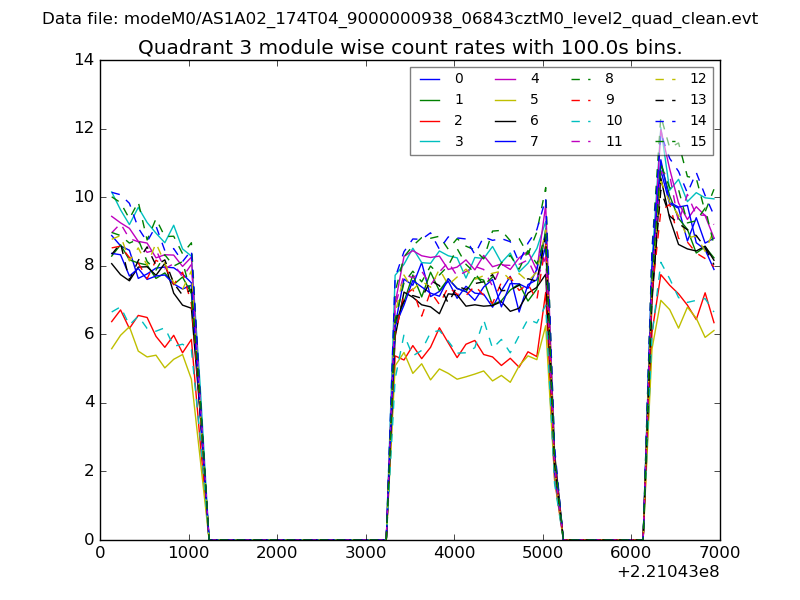
| Module-wise count rates for Quadrant C Data is divided into 100 sec bins |
 |
 |
| Module-wise count rates for Quadrant D Data is divided into 100 sec bins |
 |
 |
| Parameter | Plot |
|---|---|
| CZT HV Monitor | 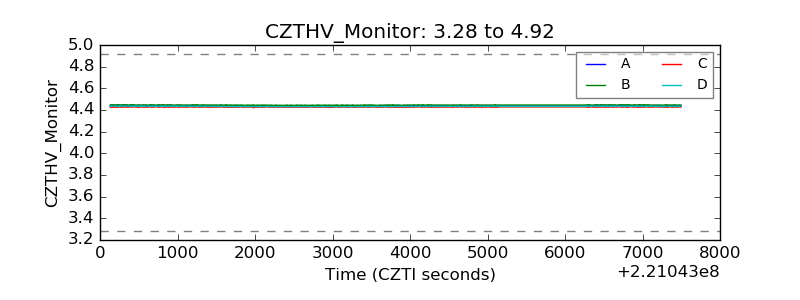 |
| D_VDD | 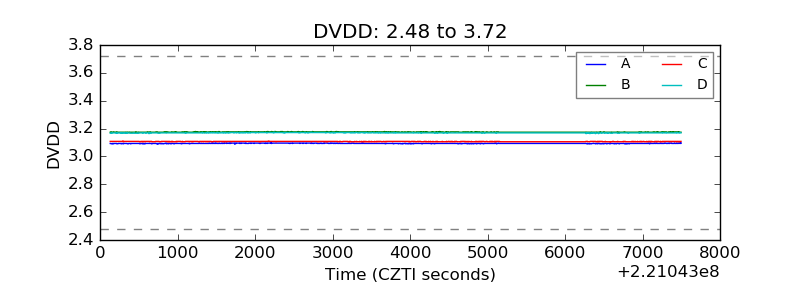 |
| Temperature 1 | 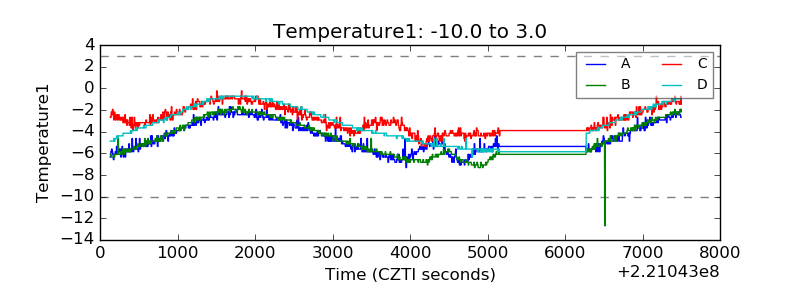 |
| Veto HV Monitor | 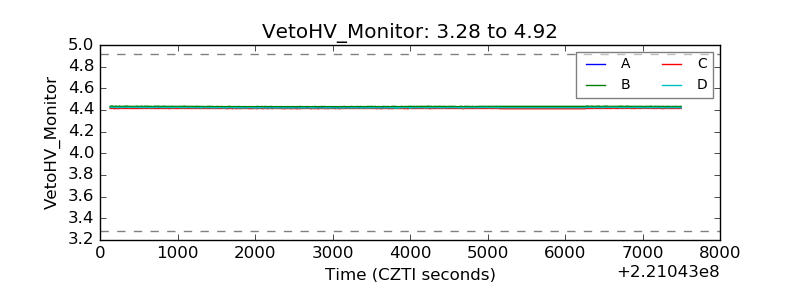 |
| Veto LLD | 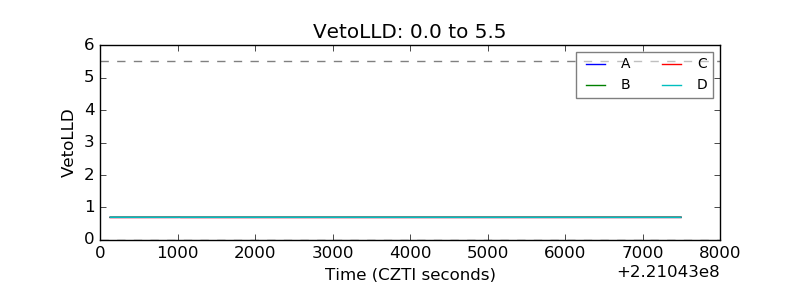 |
| Alpha Counter | 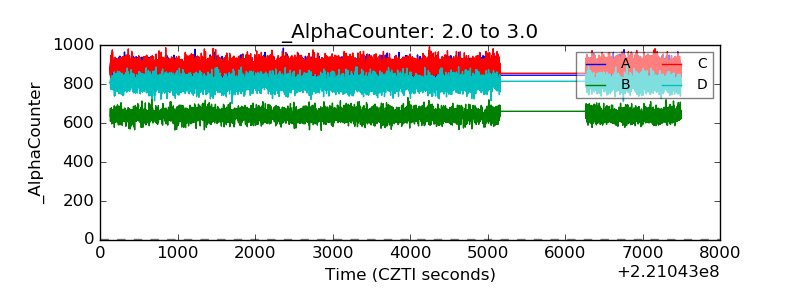 |
| _CPM_Rate | 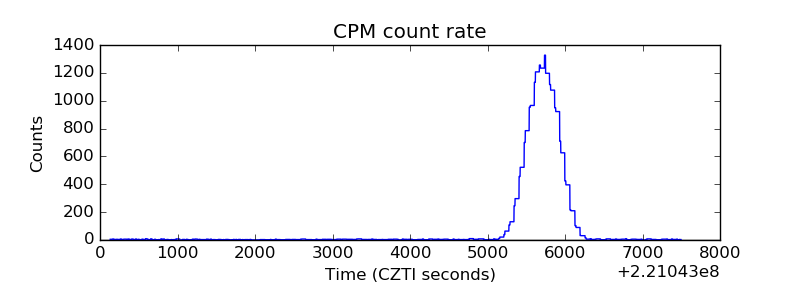 |
| CZT Counter | 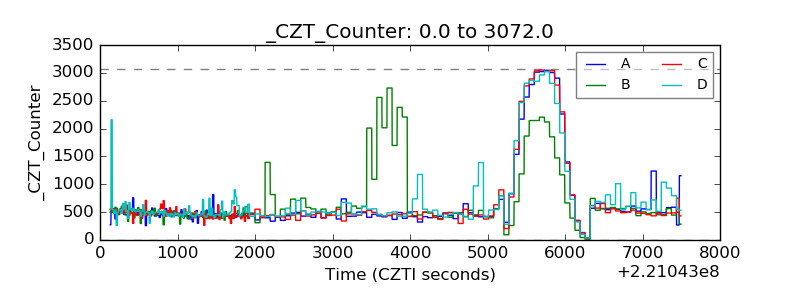 |
| +2.5 Volts monitor | 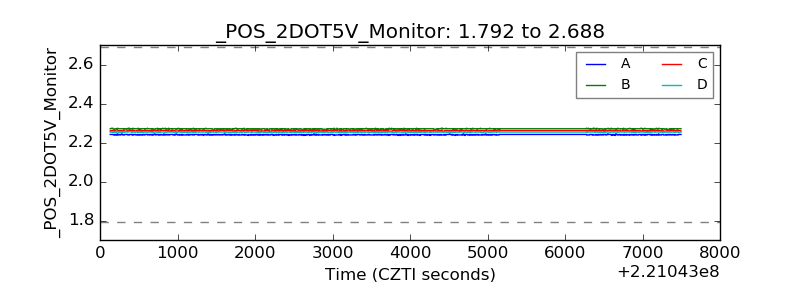 |
| +5 Volts monitor | 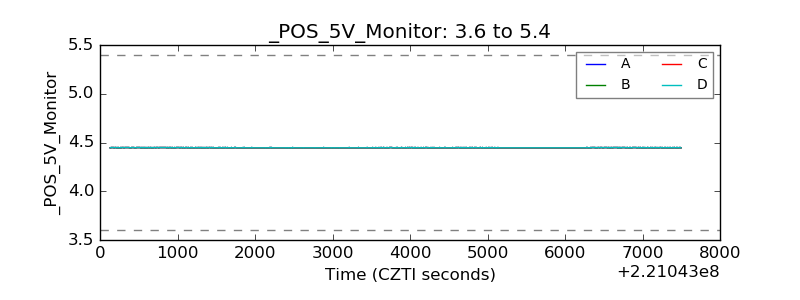 |
| _ROLL_ROT | 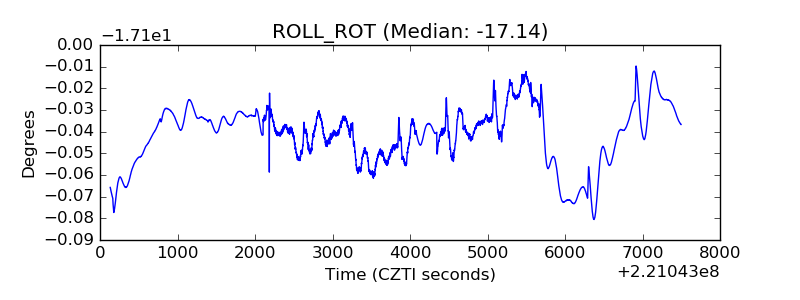 |
| _Roll_DEC | 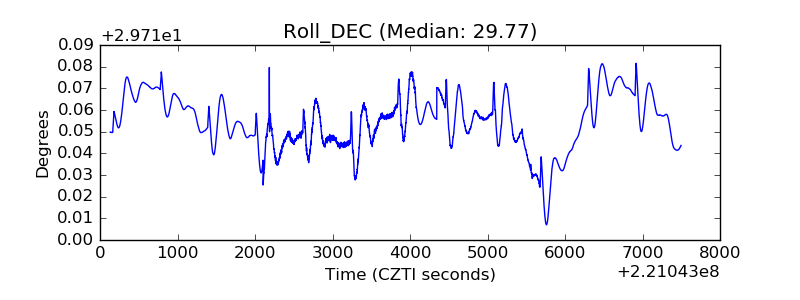 |
| _Roll_RA | 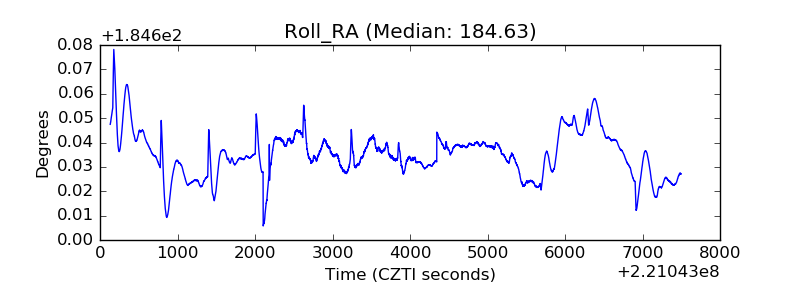 |
| Veto Counter | 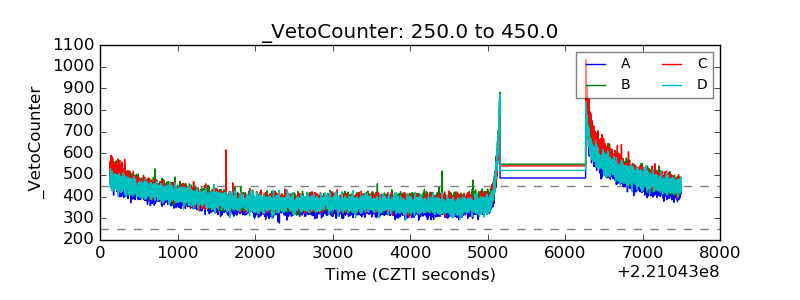 |