| Param | Original file | Final file |
|---|---|---|
| Filename | modeM0/AS1A02_174T04_9000000938_06844cztM0_level2.evt | modeM0/AS1A02_174T04_9000000938_06844cztM0_level2_quad_clean.evt |
| Size (bytes) | 358,799,040 | 32,803,200 |
| Size | 342.2 MB | 31.3 MB |
| Events in quadrant A | 2,611,577 | 170,701 |
| Events in quadrant B | 2,290,563 | 174,671 |
| Events in quadrant C | 2,303,408 | 171,805 |
| Events in quadrant D | 3,358,911 | 163,485 |
| Mode M0 | |||
|---|---|---|---|
| Quadrant | BADHDUFLAG | Total packets | Discarded packets |
| A | 0 | 10730 | 155 |
| B | 0 | 9548 | 118 |
| C | 0 | 9679 | 120 |
| D | 0 | 13377 | 161 |
| Mode SS | |||
|---|---|---|---|
| Quadrant | BADHDUFLAG | Total packets | Discarded packets |
| A | 0 | 88 | 0 |
| B | 0 | 88 | 0 |
| C | 0 | 88 | 0 |
| D | 0 | 88 | 0 |
| Quadrant | Total seconds | Saturated seconds | Saturation percentage |
|---|---|---|---|
| A | 4433 | 28 | 0.631626% |
| B | 4437 | 2 | 0.045076% |
| C | 4439 | 10 | 0.225276% |
| D | 4437 | 190 | 4.282173% |
Noise dominated data is calculated using 1-second bins in cleaned event files. If a bin has >2000 counts, and if more than 50% of those come from <1% of pixels, then it is considered to be noise-dominated and hence unusable.
| Quadrant | # 1 sec bins | Bins with >0 counts | Bins with >2000 counts | High rate bins dominated by noise | Noise dominated (total time) | Noise dominated (detector-on time) | Marked lightcurve |
|---|---|---|---|---|---|---|---|
| A | 7773 | 4443 | 4 | 4 | 0.05% | 0.09% | 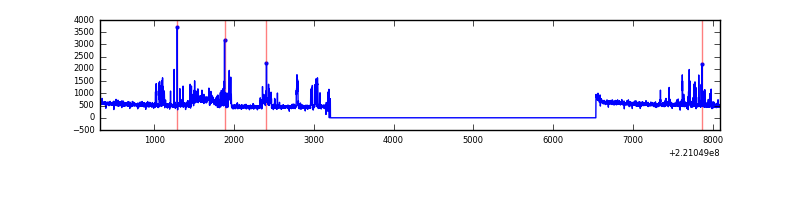 |
| B | 7773 | 4443 | 0 | 0 | 0.00% | 0.00% | 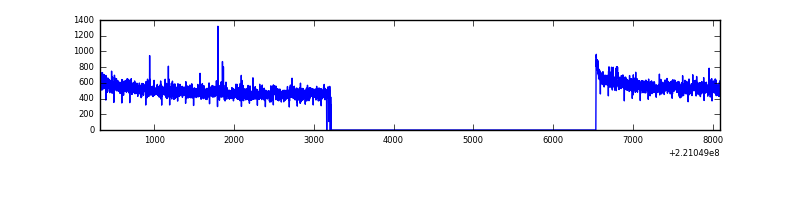 |
| C | 7773 | 4448 | 5 | 5 | 0.06% | 0.11% |  |
| D | 7773 | 4443 | 136 | 136 | 1.75% | 3.06% | 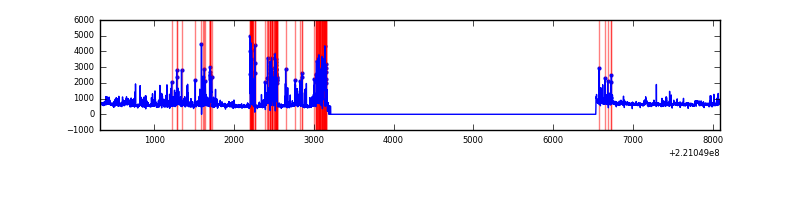 |
Top three noisy pixels from each quadrant. If the there are fewer than three noisy pixels in the level2.evt file, extra rows are filled as -1
| Pixel properties | Quadrant properties | ||||||
|---|---|---|---|---|---|---|---|
| Quadrant | DetID | PixID | Counts | Sigma | Mean | Median | Sigma |
| A | 8 | 15 | 351937 | 2978.17 | 583 | 570 | 118.0 |
| A | 14 | 111 | 9268 | 73.72 | 583 | 570 | 118.0 |
| A | 12 | 194 | 5870 | 44.92 | 583 | 570 | 118.0 |
| B | 0 | 219 | 18031 | 159.46 | 578 | 567 | 109.5 |
| B | 12 | 111 | 10398 | 89.76 | 578 | 567 | 109.5 |
| B | 0 | 228 | 9671 | 83.12 | 578 | 567 | 109.5 |
| C | 10 | 22 | 69977 | 535.56 | 562 | 566 | 129.6 |
| C | 9 | 68 | 29887 | 226.23 | 562 | 566 | 129.6 |
| C | 9 | 247 | 6381 | 44.87 | 562 | 566 | 129.6 |
| D | 2 | 33 | 405215 | 2962.49 | 560 | 543 | 136.6 |
| D | 8 | 195 | 321955 | 2352.96 | 560 | 543 | 136.6 |
| D | 14 | 34 | 255325 | 1865.18 | 560 | 543 | 136.6 |
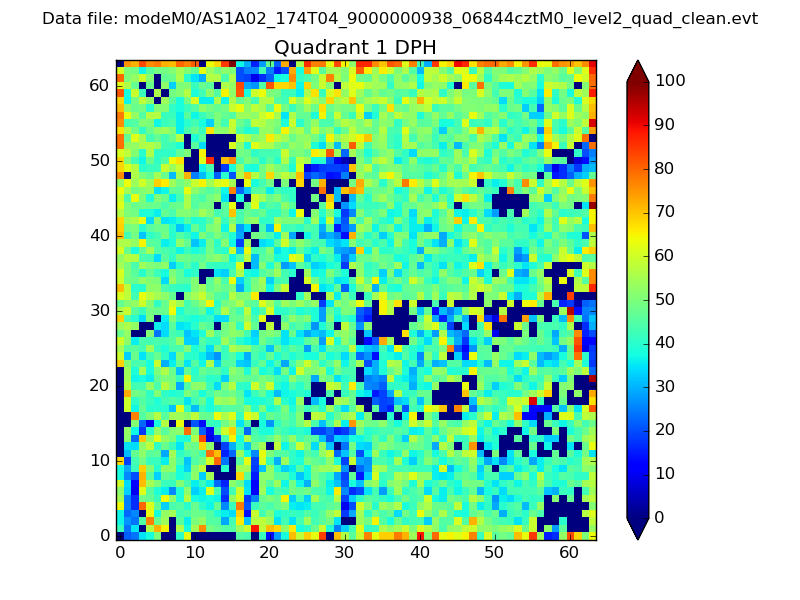
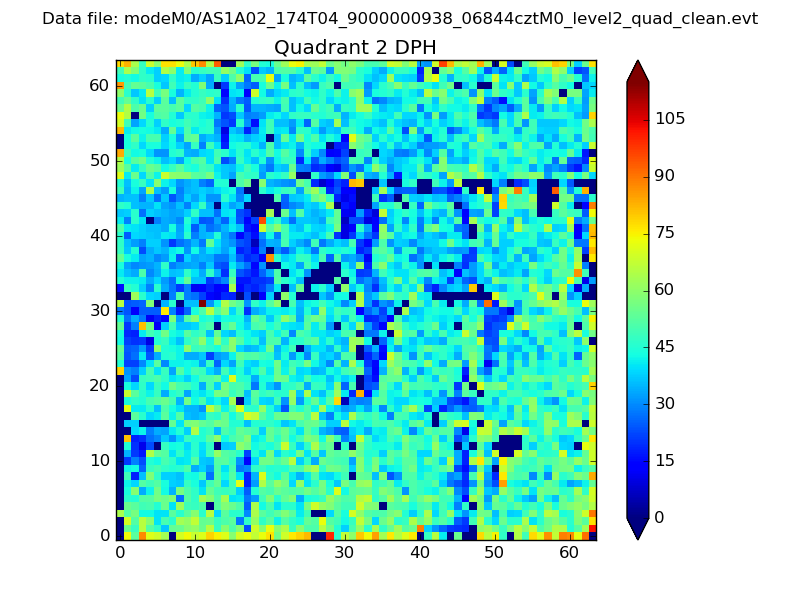
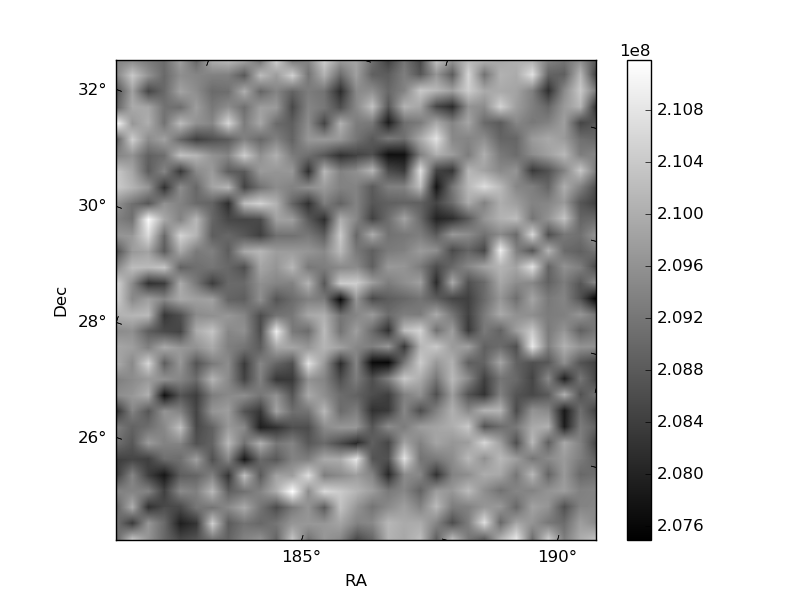
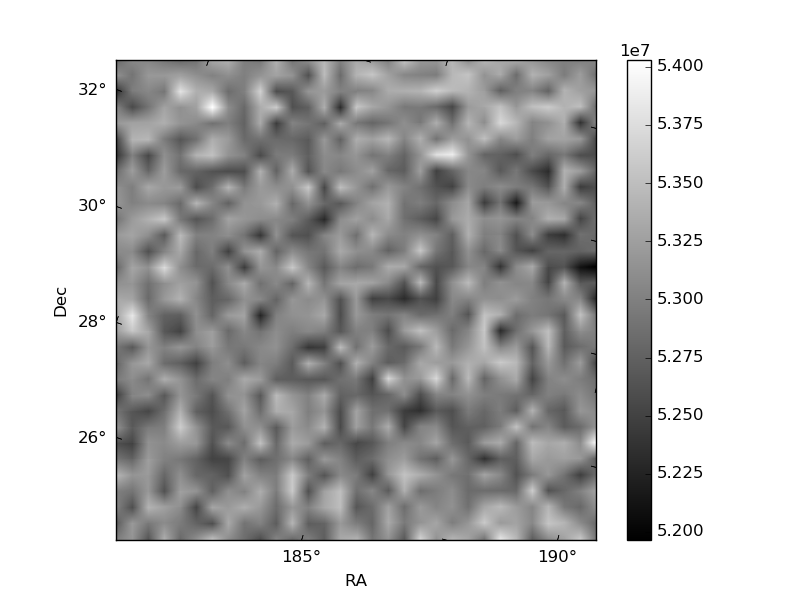
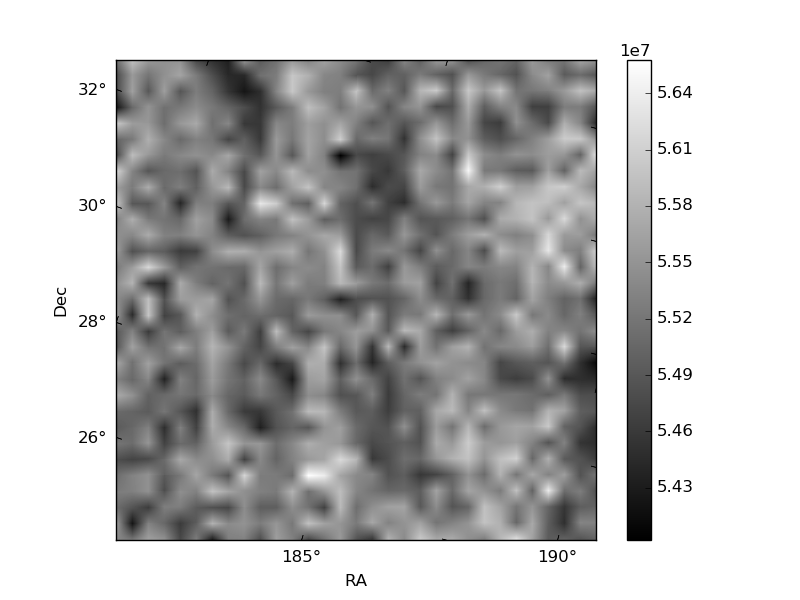
Histogram calculated using DETX and DETY for each event in the final _common_clean file
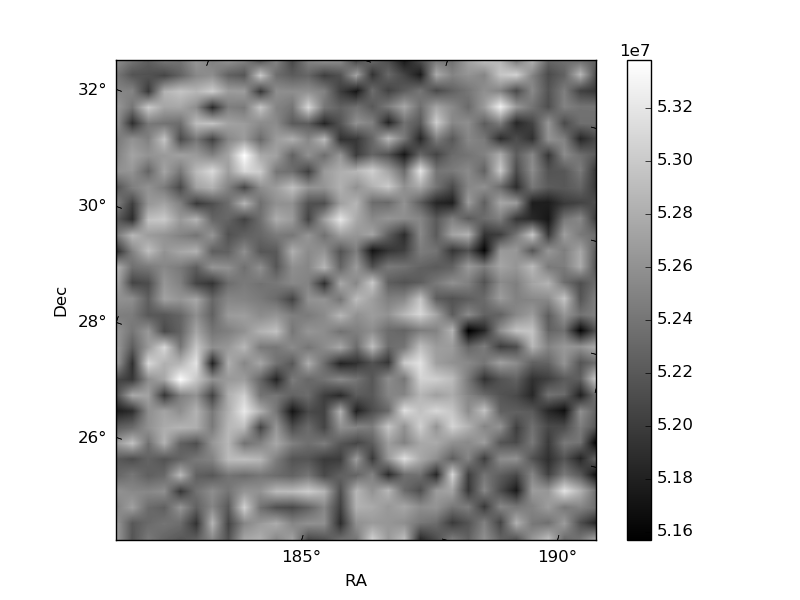
| Quadrant A | 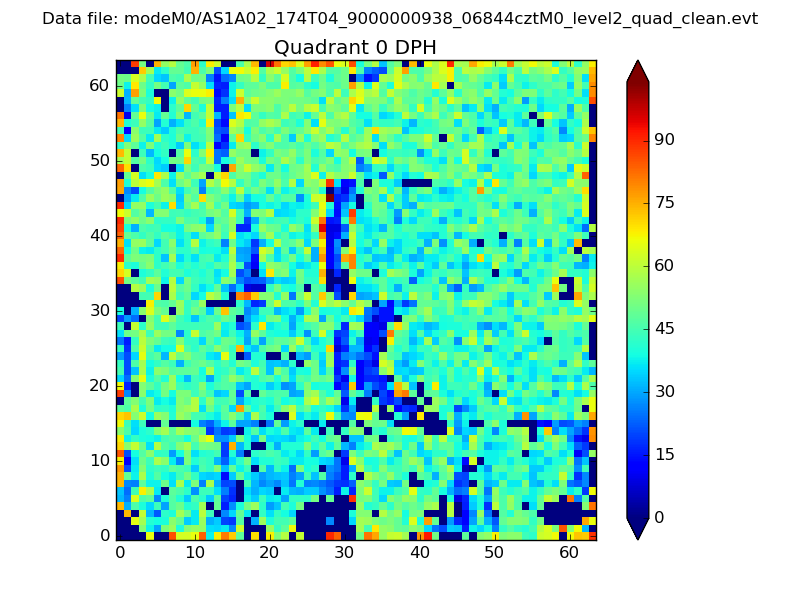 |
 |
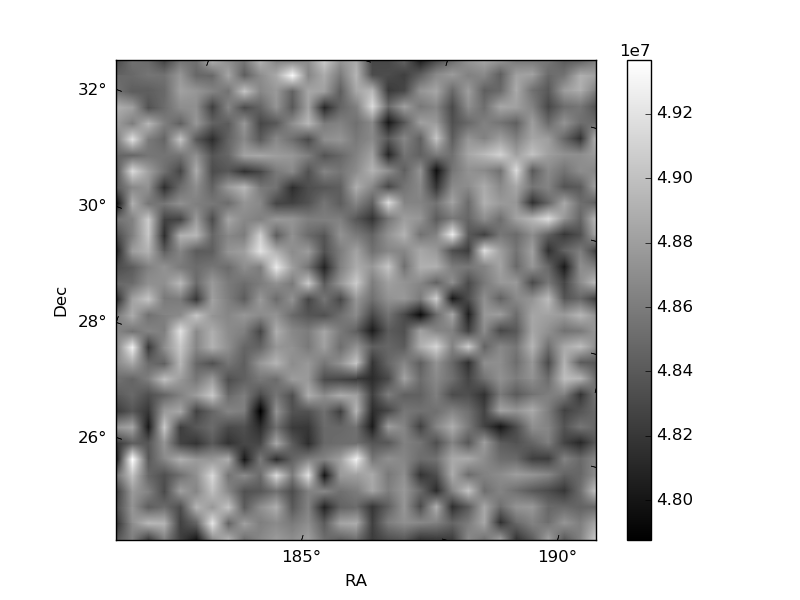
Quadrant B |
|---|---|---|---|
| Quadrant D | 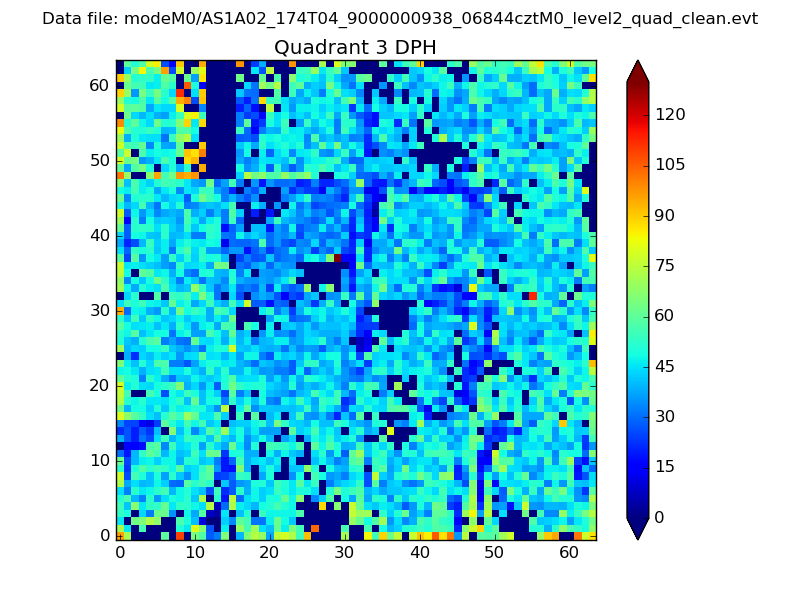 |
 |
Quadrant C |
| Plot type | Count rate plots | Images |
|---|---|---|
| Comparison with Poisson distribution Blue bars denote a histogram of data divided into 1 sec bins. Red curve is a Poisson curve with rate = median count rate of data. |
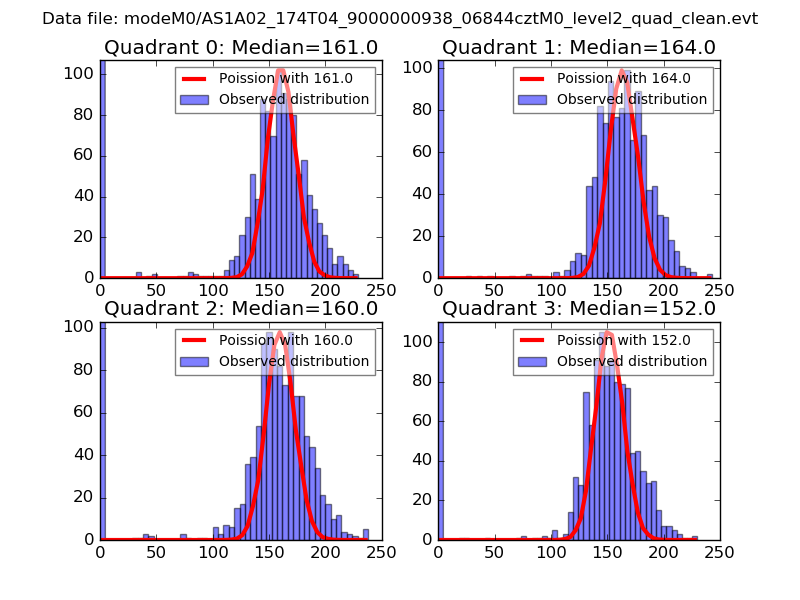 |
 |
| Quadrant-wise count rates Data is divided into 100 sec bins |
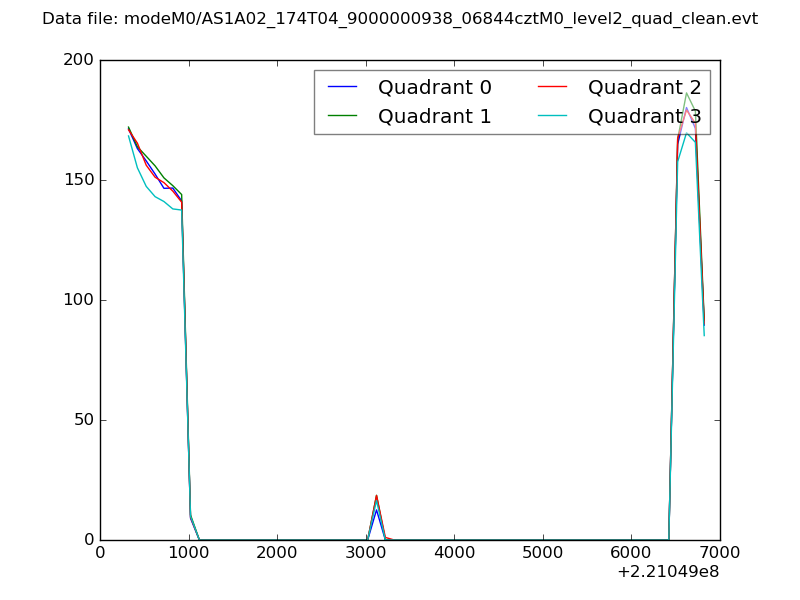 |
|
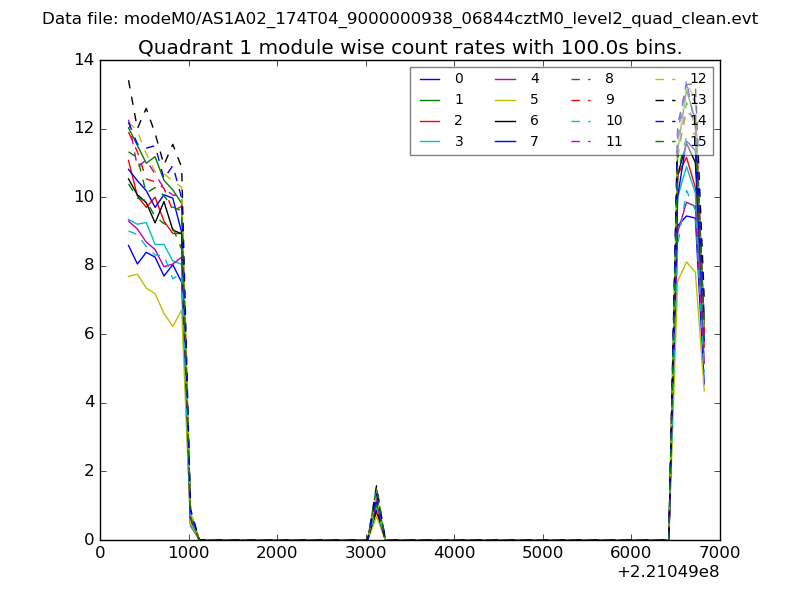
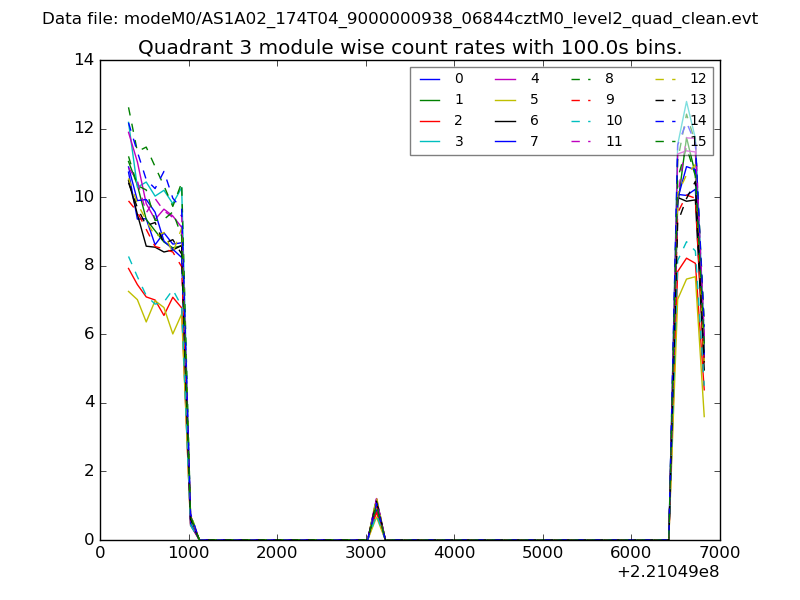
| Module-wise count rates for Quadrant A Data is divided into 100 sec bins |
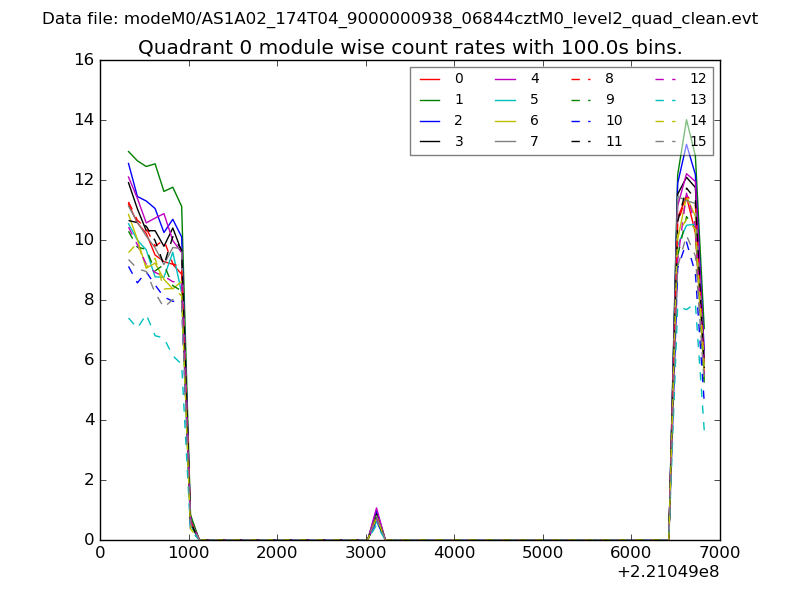 |
 |
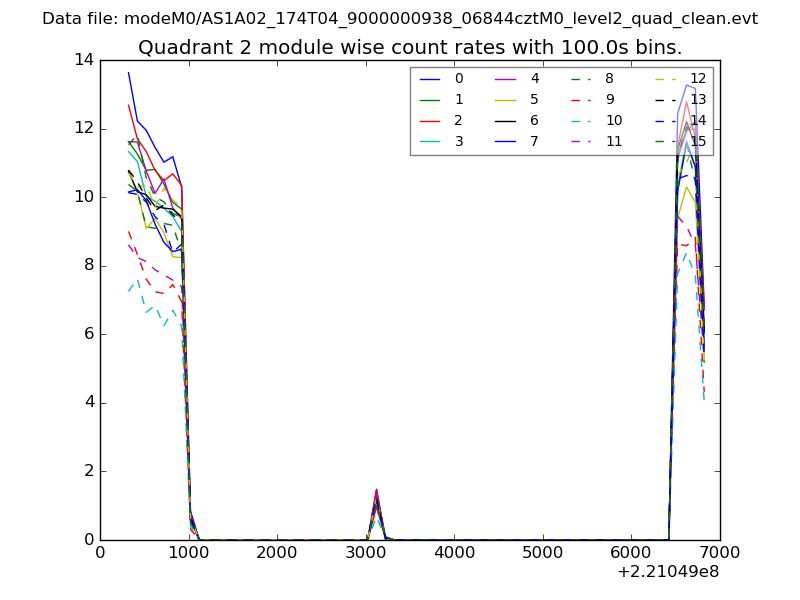
| Module-wise count rates for Quadrant B Data is divided into 100 sec bins |
 |
 |
| Module-wise count rates for Quadrant C Data is divided into 100 sec bins |
 |
 |
| Module-wise count rates for Quadrant D Data is divided into 100 sec bins |
 |
 |
| Parameter | Plot |
|---|---|
| CZT HV Monitor | 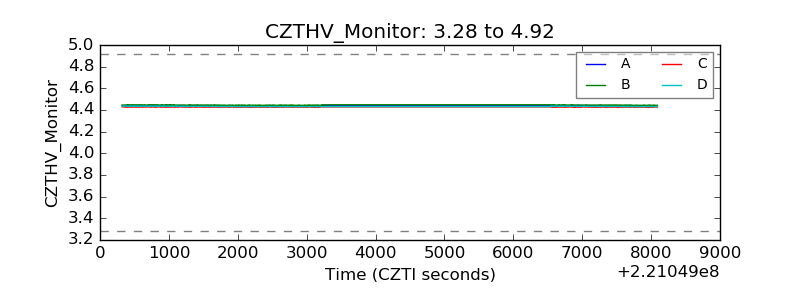 |
| D_VDD | 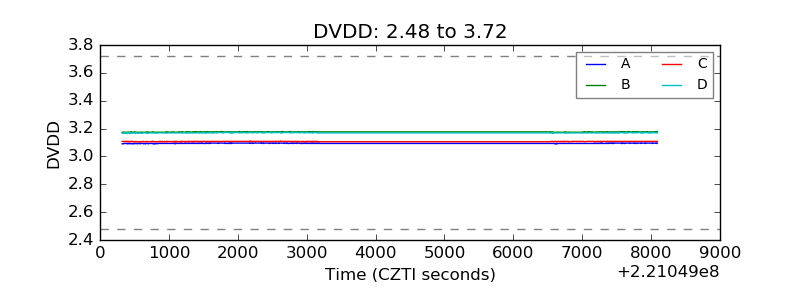 |
| Temperature 1 | 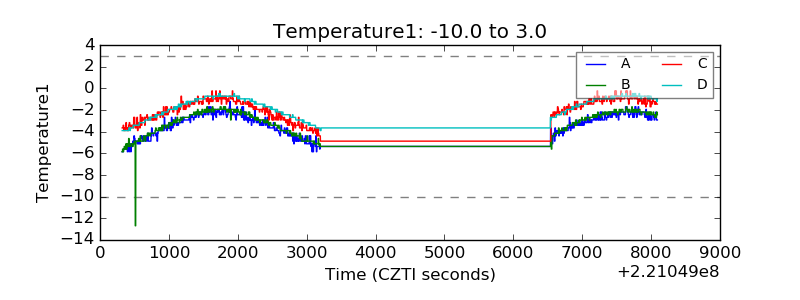 |
| Veto HV Monitor |  |
| Veto LLD | 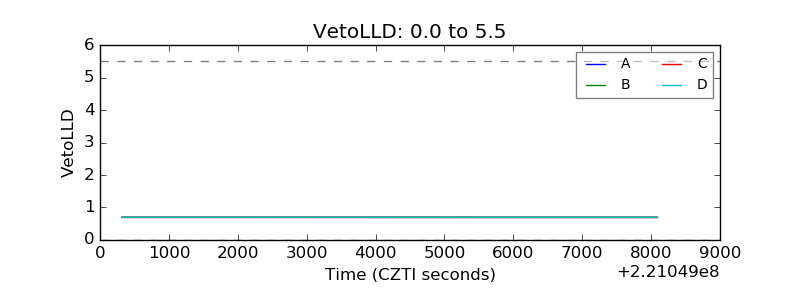 |
| Alpha Counter | 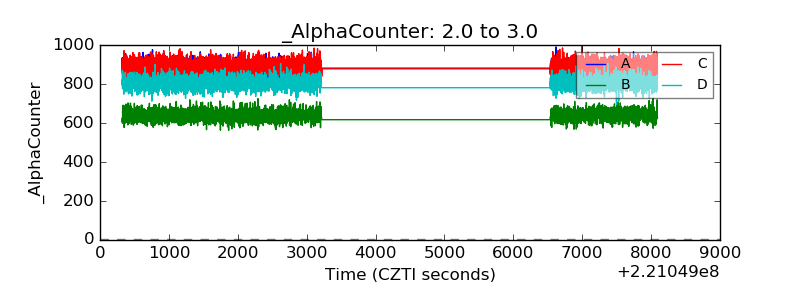 |
| _CPM_Rate | 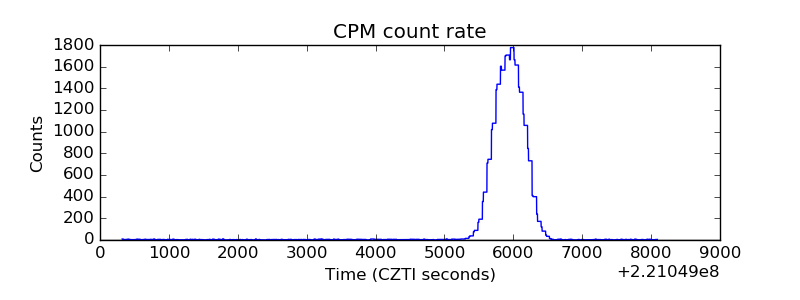 |
| CZT Counter | 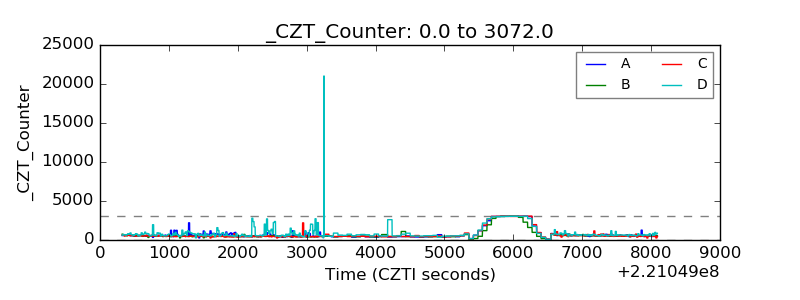 |
| +2.5 Volts monitor | 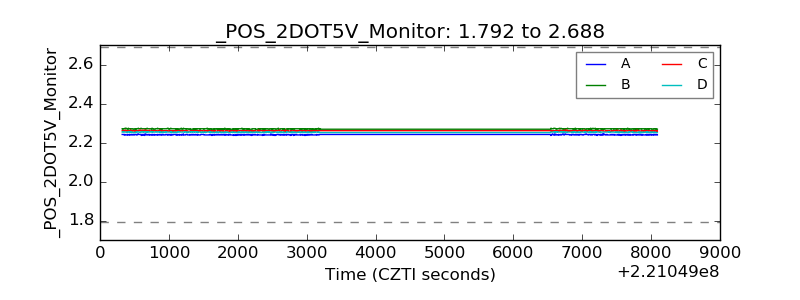 |
| +5 Volts monitor |  |
| _ROLL_ROT | 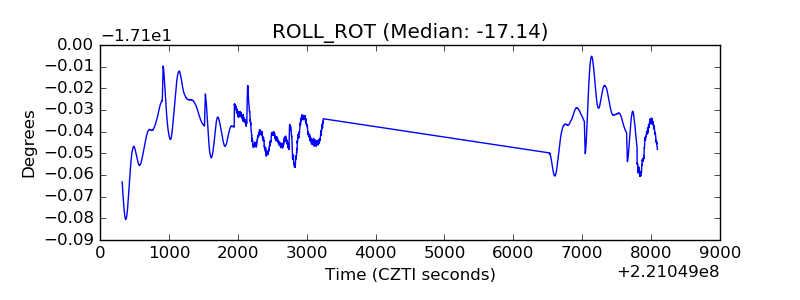 |
| _Roll_DEC | 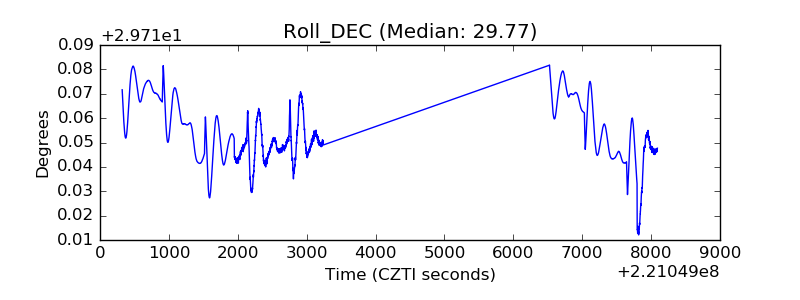 |
| _Roll_RA | 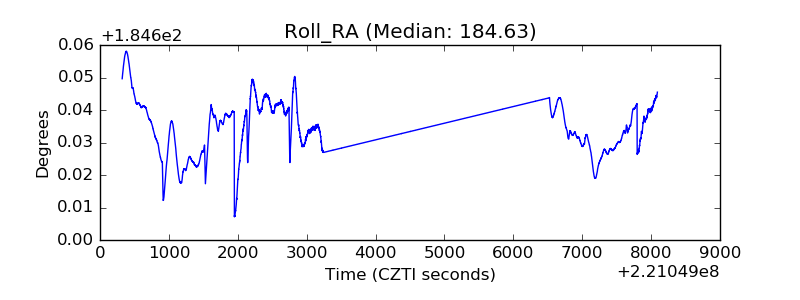 |
| Veto Counter | 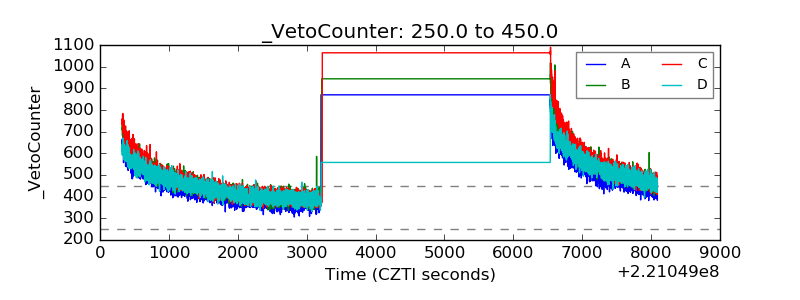 |