| Param | Original file | Final file |
|---|---|---|
| Filename | modeM0/AS1A02_174T04_9000000938_06845cztM0_level2.evt | modeM0/AS1A02_174T04_9000000938_06845cztM0_level2_quad_clean.evt |
| Size (bytes) | 829,981,440 | 109,140,480 |
| Size | 791.5 MB | 104.1 MB |
| Events in quadrant A | 5,730,439 | 639,981 |
| Events in quadrant B | 5,463,032 | 650,896 |
| Events in quadrant C | 5,514,308 | 646,713 |
| Events in quadrant D | 7,695,961 | 617,494 |
| Mode M9 | |||
|---|---|---|---|
| Quadrant | BADHDUFLAG | Total packets | Discarded packets |
| A | 0 | 24 | 0 |
| B | 0 | 24 | 0 |
| C | 0 | 24 | 0 |
| D | 0 | 24 | 0 |
| Mode M0 | |||
|---|---|---|---|
| Quadrant | BADHDUFLAG | Total packets | Discarded packets |
| A | 0 | 24038 | 3 |
| B | 0 | 22990 | 2 |
| C | 0 | 23287 | 2 |
| D | 0 | 30383 | 2 |
| Mode SS | |||
|---|---|---|---|
| Quadrant | BADHDUFLAG | Total packets | Discarded packets |
| A | 0 | 224 | 0 |
| B | 0 | 224 | 0 |
| C | 0 | 224 | 0 |
| D | 0 | 224 | 0 |
| Quadrant | Total seconds | Saturated seconds | Saturation percentage |
|---|---|---|---|
| A | 10815 | 164 | 1.516412% |
| B | 10815 | 115 | 1.063338% |
| C | 10815 | 131 | 1.211281% |
| D | 10815 | 397 | 3.670828% |
Noise dominated data is calculated using 1-second bins in cleaned event files. If a bin has >2000 counts, and if more than 50% of those come from <1% of pixels, then it is considered to be noise-dominated and hence unusable.
| Quadrant | # 1 sec bins | Bins with >0 counts | Bins with >2000 counts | High rate bins dominated by noise | Noise dominated (total time) | Noise dominated (detector-on time) | Marked lightcurve |
|---|---|---|---|---|---|---|---|
| A | 13320 | 10817 | 7 | 7 | 0.05% | 0.06% | 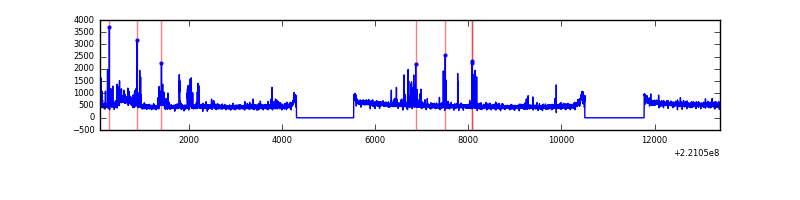 |
| B | 13320 | 10817 | 0 | 0 | 0.00% | 0.00% | 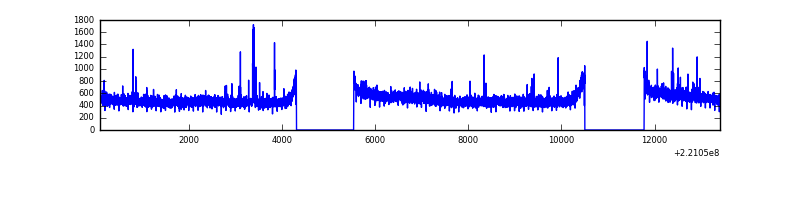 |
| C | 13320 | 10817 | 9 | 9 | 0.07% | 0.08% |  |
| D | 13320 | 10816 | 222 | 222 | 1.67% | 2.05% | 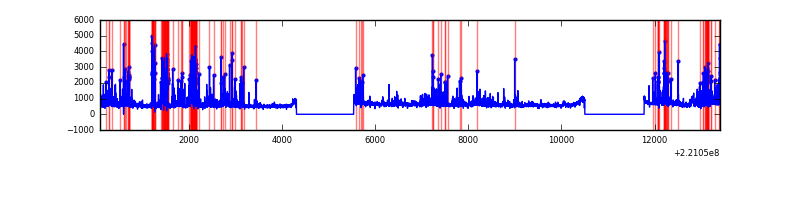 |
Top three noisy pixels from each quadrant. If the there are fewer than three noisy pixels in the level2.evt file, extra rows are filled as -1
| Pixel properties | Quadrant properties | ||||||
|---|---|---|---|---|---|---|---|
| Quadrant | DetID | PixID | Counts | Sigma | Mean | Median | Sigma |
| A | 8 | 15 | 423300 | 1525.4 | 1369 | 1341 | 276.6 |
| A | 15 | 239 | 25004 | 85.54 | 1369 | 1341 | 276.6 |
| A | 13 | 248 | 15850 | 52.45 | 1369 | 1341 | 276.6 |
| B | 0 | 219 | 38864 | 146.57 | 1373 | 1345 | 256.0 |
| B | 15 | 255 | 32418 | 121.39 | 1373 | 1345 | 256.0 |
| B | 12 | 111 | 25233 | 93.32 | 1373 | 1345 | 256.0 |
| C | 9 | 68 | 115262 | 371.56 | 1338 | 1345 | 306.6 |
| C | 10 | 22 | 106925 | 344.37 | 1338 | 1345 | 306.6 |
| C | 9 | 247 | 52510 | 166.88 | 1338 | 1345 | 306.6 |
| D | 8 | 195 | 1193540 | 3715.4 | 1325 | 1284 | 320.9 |
| D | 14 | 34 | 783630 | 2438.01 | 1325 | 1284 | 320.9 |
| D | 2 | 33 | 498795 | 1550.38 | 1325 | 1284 | 320.9 |
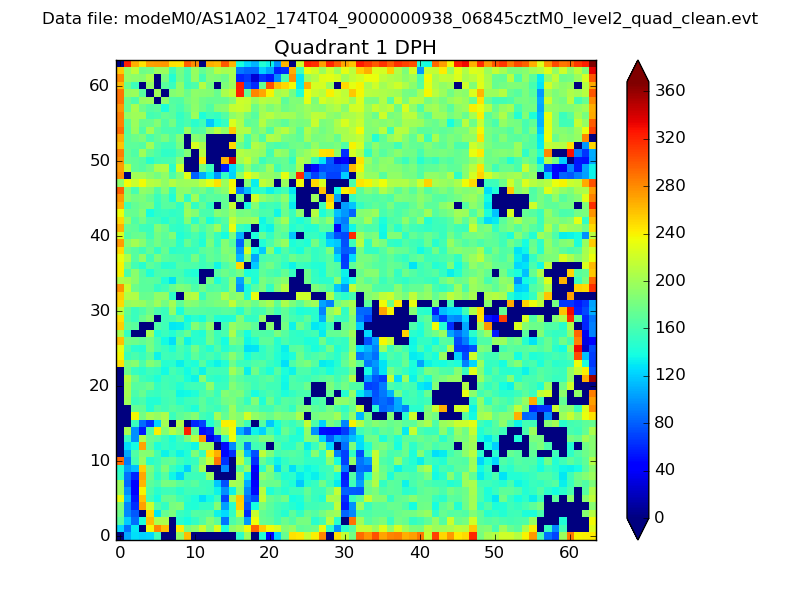
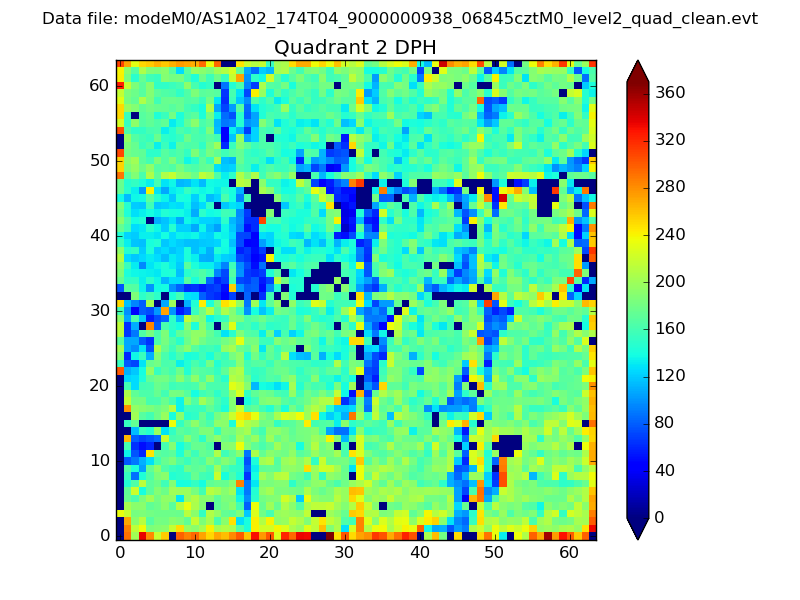
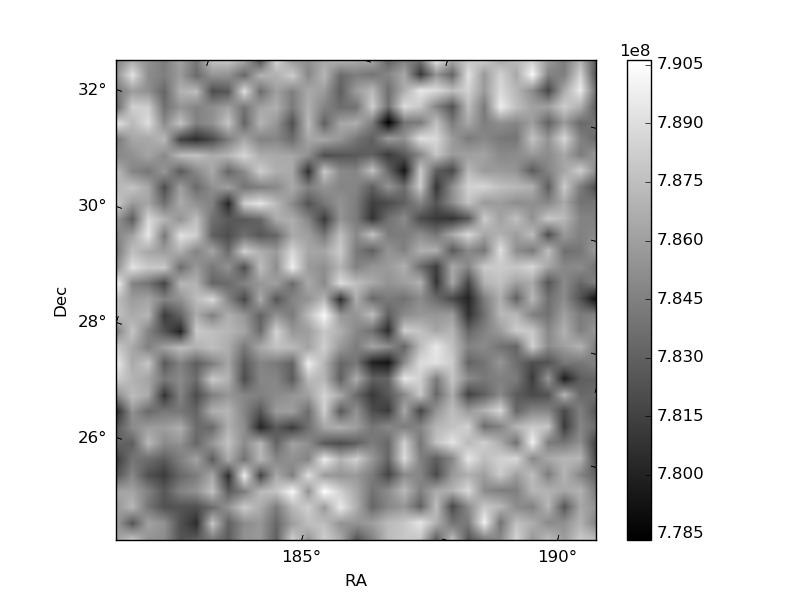
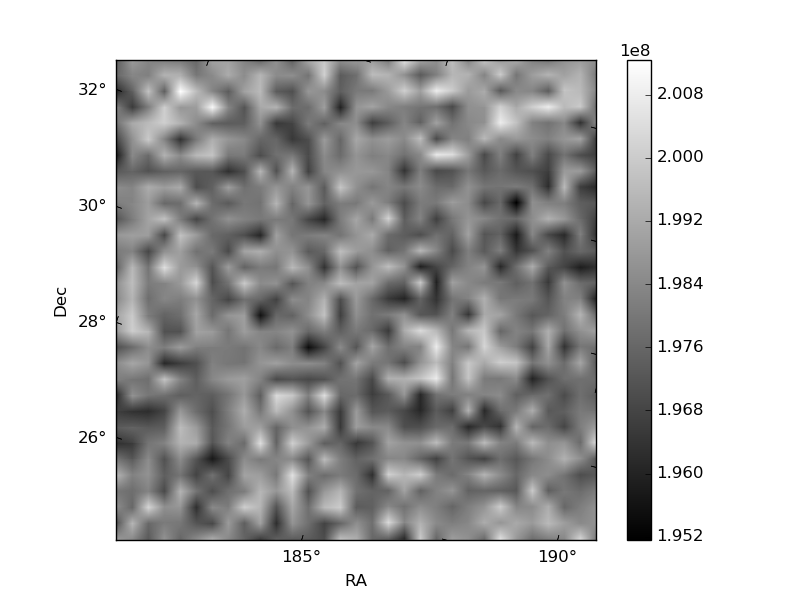
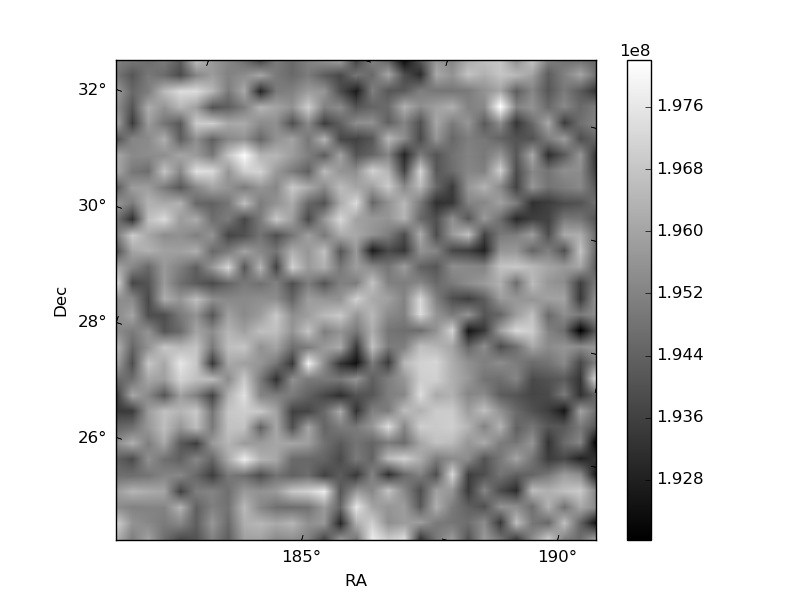
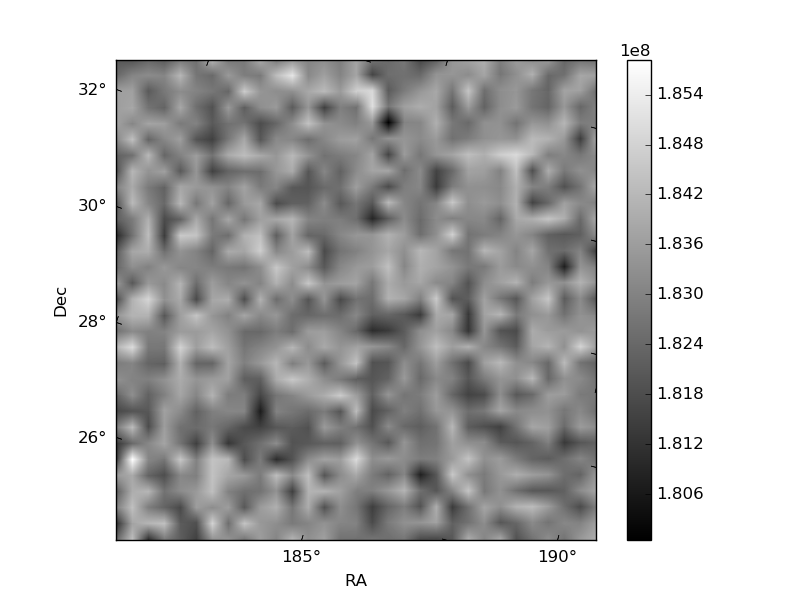
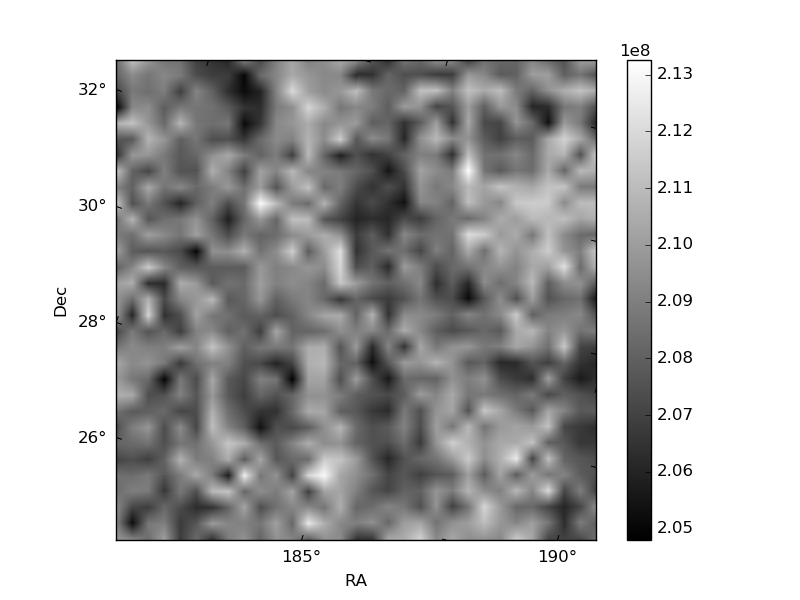
Histogram calculated using DETX and DETY for each event in the final _common_clean file
| Quadrant A | 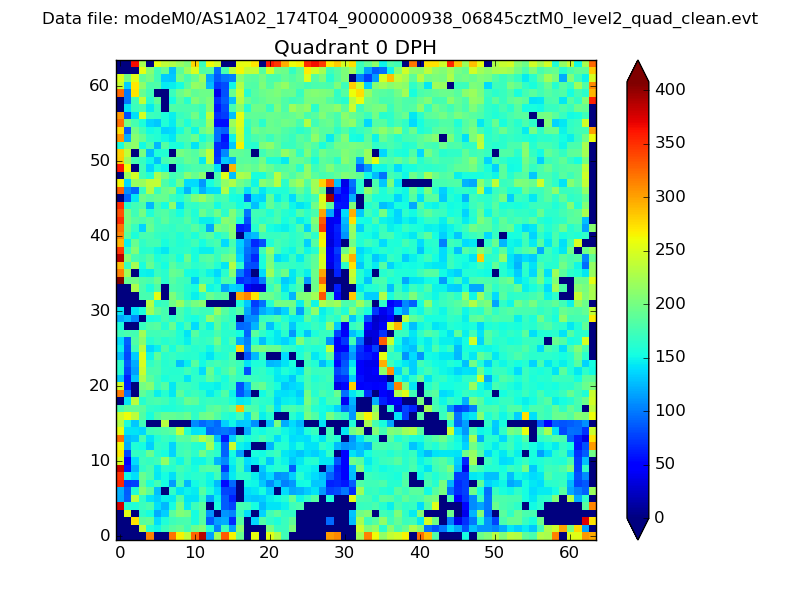 |
 |
Quadrant B |
|---|---|---|---|
| Quadrant D | 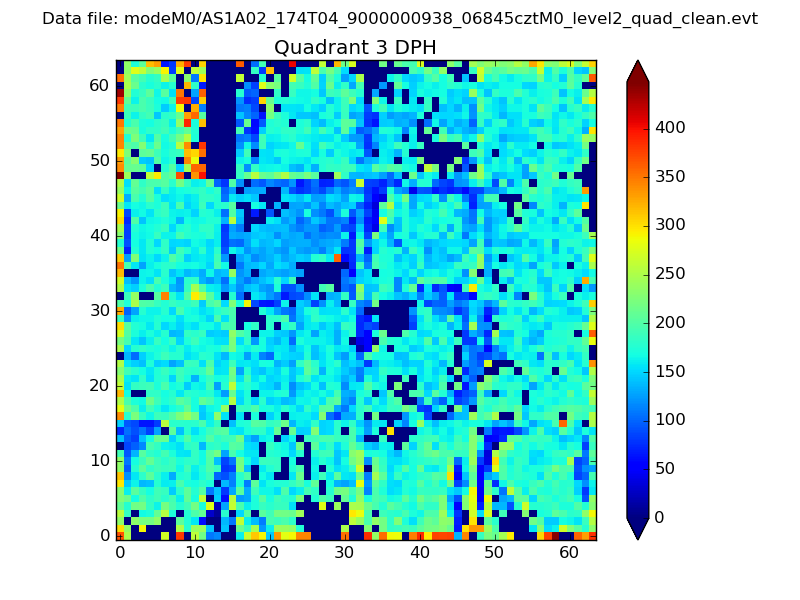 |
 |
Quadrant C |
| Plot type | Count rate plots | Images |
|---|---|---|
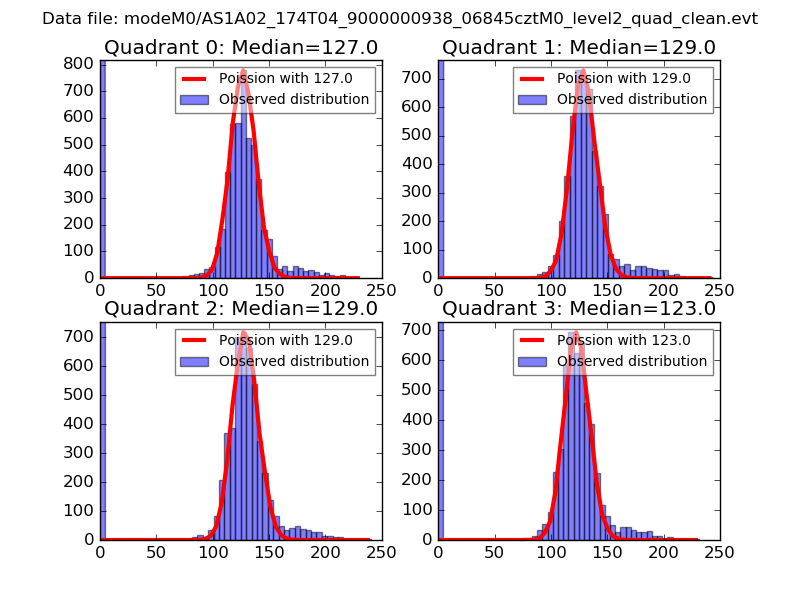
| Comparison with Poisson distribution Blue bars denote a histogram of data divided into 1 sec bins. Red curve is a Poisson curve with rate = median count rate of data. |
 |
 |
| Quadrant-wise count rates Data is divided into 100 sec bins |
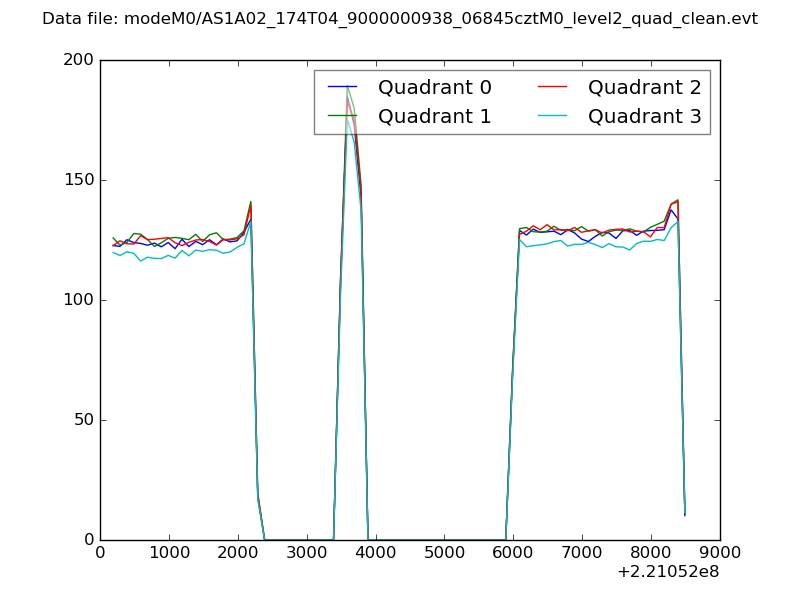 |
|
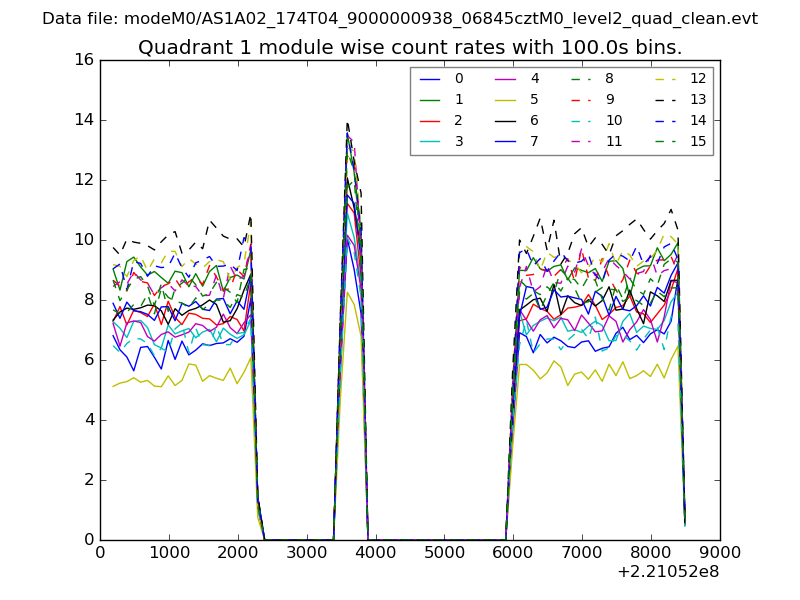
| Module-wise count rates for Quadrant A Data is divided into 100 sec bins |
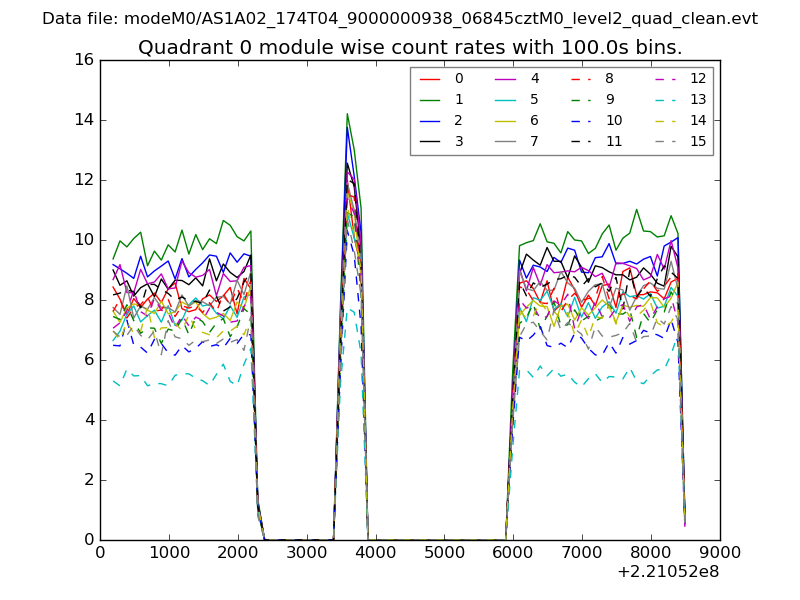 |
 |
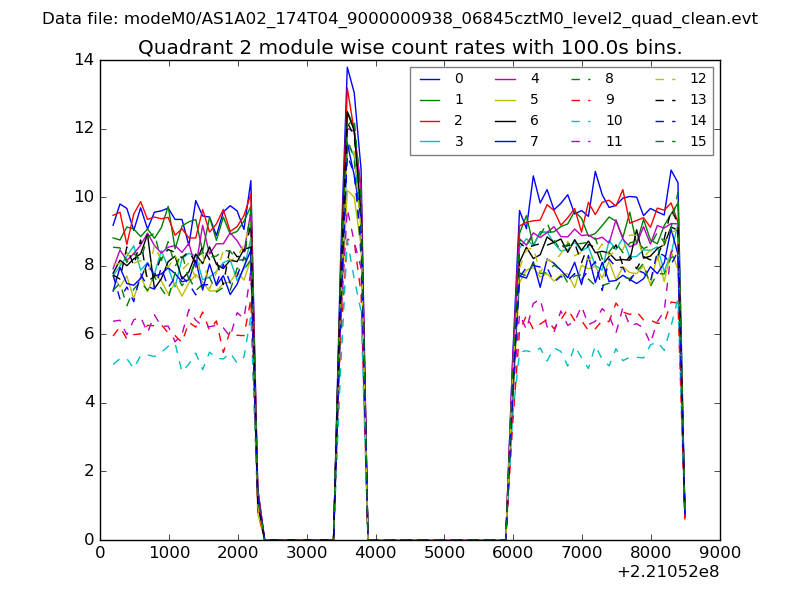
| Module-wise count rates for Quadrant B Data is divided into 100 sec bins |
 |
 |
| Module-wise count rates for Quadrant C Data is divided into 100 sec bins |
 |
 |
| Module-wise count rates for Quadrant D Data is divided into 100 sec bins |
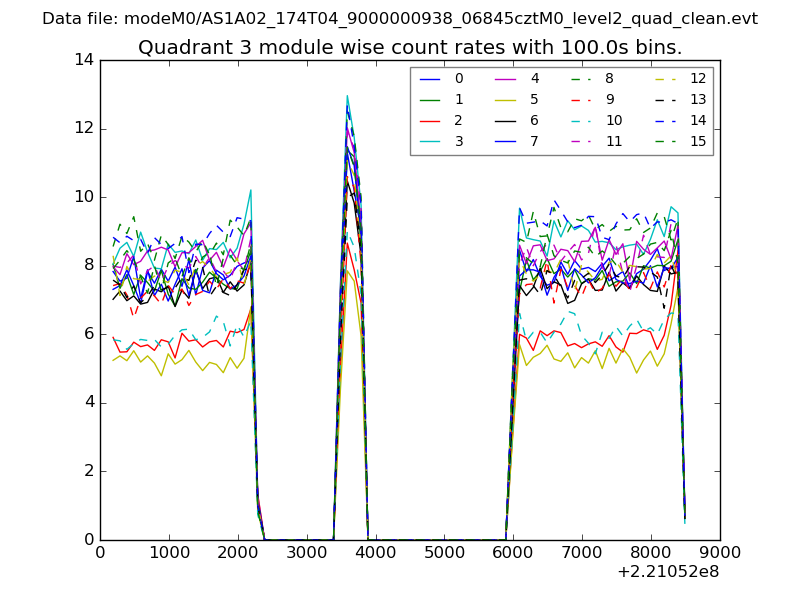 |
 |
| Parameter | Plot |
|---|---|
| CZT HV Monitor | 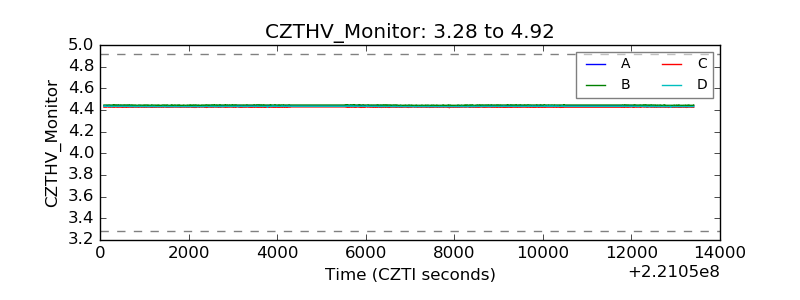 |
| D_VDD | 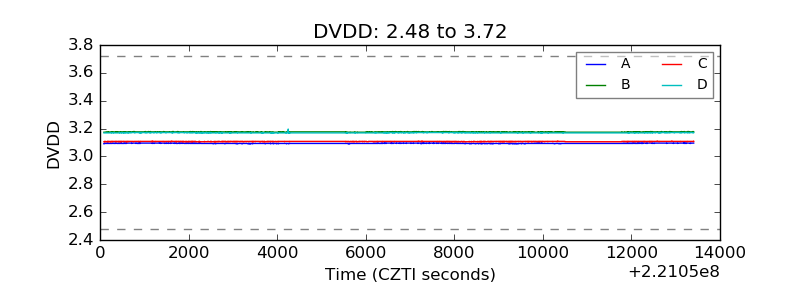 |
| Temperature 1 | 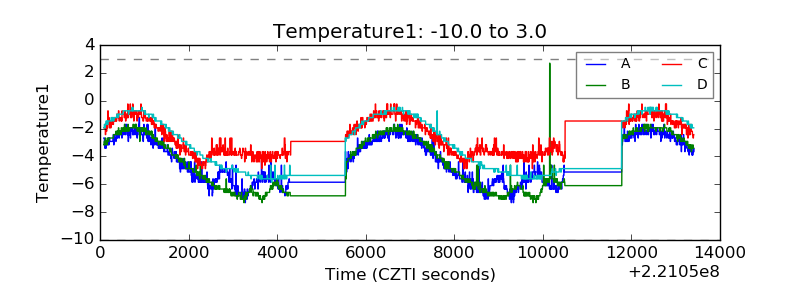 |
| Veto HV Monitor |  |
| Veto LLD | 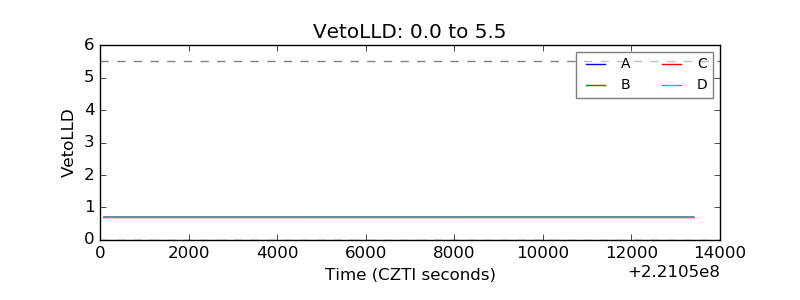 |
| Alpha Counter | 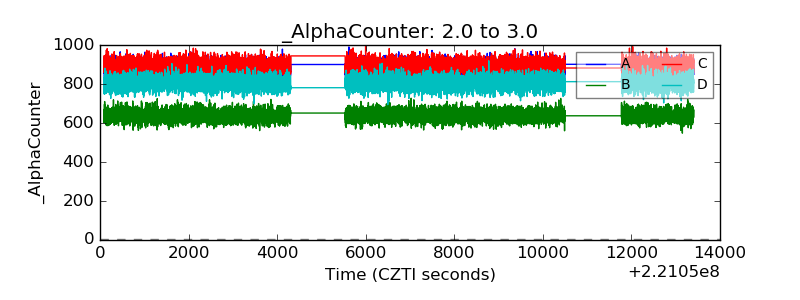 |
| _CPM_Rate | 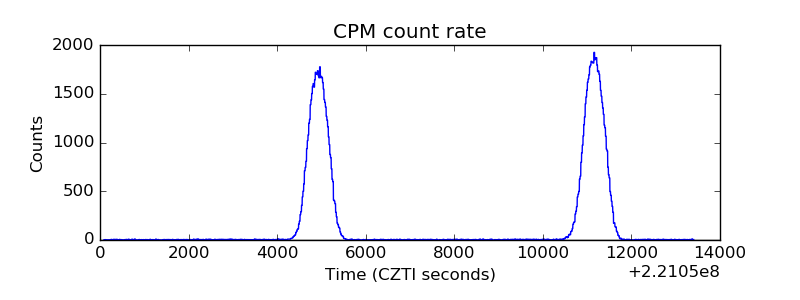 |
| CZT Counter | 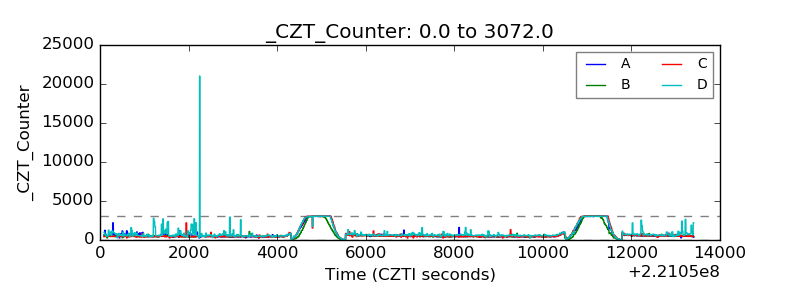 |
| +2.5 Volts monitor | 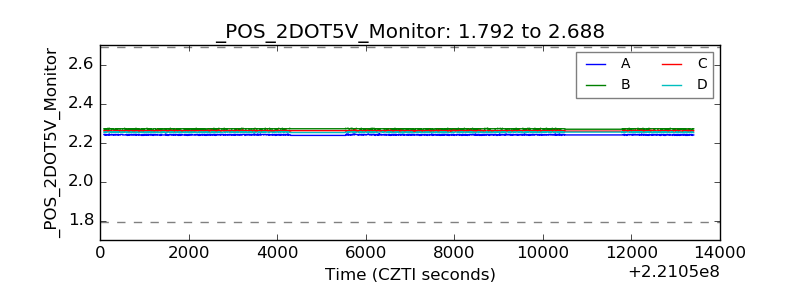 |
| +5 Volts monitor |  |
| _ROLL_ROT | 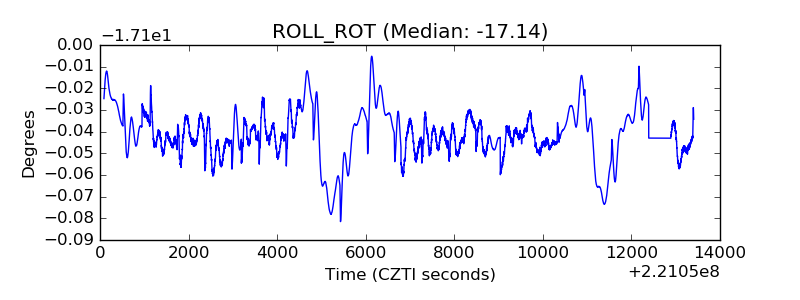 |
| _Roll_DEC | 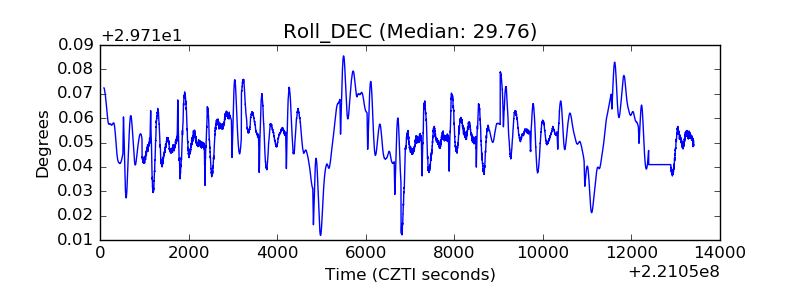 |
| _Roll_RA | 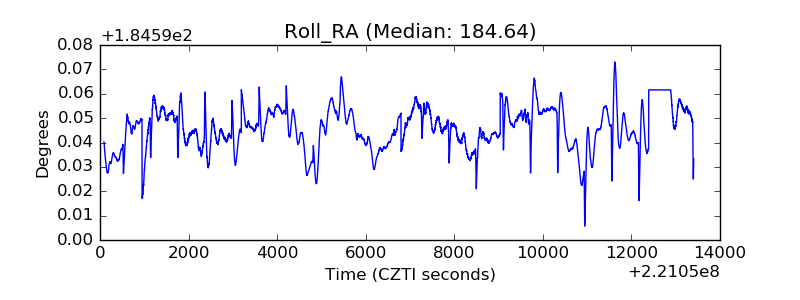 |
| Veto Counter | 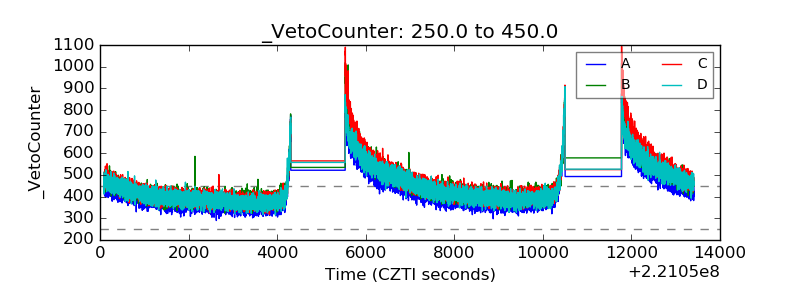 |