| Param | Original file | Final file |
|---|---|---|
| Filename | modeM0/AS1A02_174T04_9000000938_06846cztM0_level2.evt | modeM0/AS1A02_174T04_9000000938_06846cztM0_level2_quad_clean.evt |
| Size (bytes) | 271,903,680 | 32,855,040 |
| Size | 259.3 MB | 31.3 MB |
| Events in quadrant A | 1,761,214 | 187,773 |
| Events in quadrant B | 1,788,624 | 189,854 |
| Events in quadrant C | 1,787,287 | 188,318 |
| Events in quadrant D | 2,658,239 | 180,240 |
| Mode M0 | |||
|---|---|---|---|
| Quadrant | BADHDUFLAG | Total packets | Discarded packets |
| A | 0 | 7434 | 0 |
| B | 0 | 7527 | 0 |
| C | 0 | 7522 | 0 |
| D | 0 | 10403 | 0 |
| Mode SS | |||
|---|---|---|---|
| Quadrant | BADHDUFLAG | Total packets | Discarded packets |
| A | 0 | 70 | 0 |
| B | 0 | 70 | 0 |
| C | 0 | 70 | 0 |
| D | 0 | 70 | 0 |
| Quadrant | Total seconds | Saturated seconds | Saturation percentage |
|---|---|---|---|
| A | 3501 | 3 | 0.085690% |
| B | 3501 | 2 | 0.057127% |
| C | 3501 | 3 | 0.085690% |
| D | 3501 | 149 | 4.255927% |
Noise dominated data is calculated using 1-second bins in cleaned event files. If a bin has >2000 counts, and if more than 50% of those come from <1% of pixels, then it is considered to be noise-dominated and hence unusable.
| Quadrant | # 1 sec bins | Bins with >0 counts | Bins with >2000 counts | High rate bins dominated by noise | Noise dominated (total time) | Noise dominated (detector-on time) | Marked lightcurve |
|---|---|---|---|---|---|---|---|
| A | 3501 | 3501 | 0 | 0 | 0.00% | 0.00% | 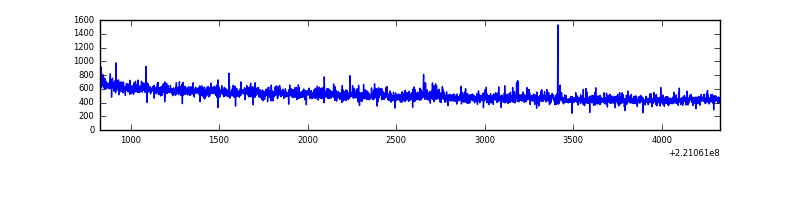 |
| B | 3501 | 3501 | 0 | 0 | 0.00% | 0.00% | 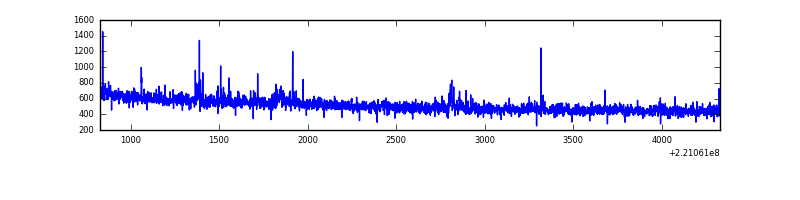 |
| C | 3501 | 3501 | 0 | 0 | 0.00% | 0.00% | 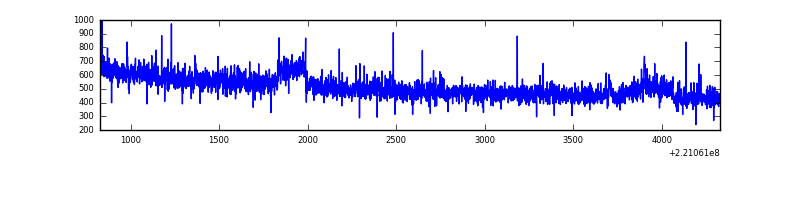 |
| D | 3501 | 3501 | 121 | 121 | 3.46% | 3.46% | 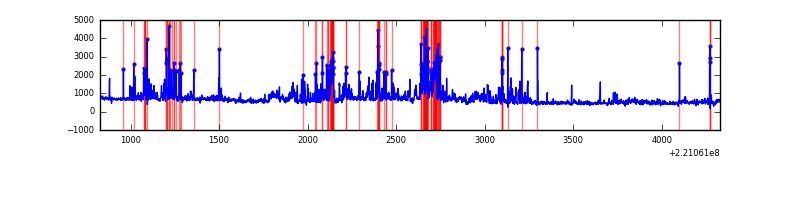 |
Top three noisy pixels from each quadrant. If the there are fewer than three noisy pixels in the level2.evt file, extra rows are filled as -1
| Pixel properties | Quadrant properties | ||||||
|---|---|---|---|---|---|---|---|
| Quadrant | DetID | PixID | Counts | Sigma | Mean | Median | Sigma |
| A | 8 | 15 | 27229 | 296.49 | 446 | 437 | 90.4 |
| A | 3 | 1 | 7326 | 76.24 | 446 | 437 | 90.4 |
| A | 15 | 239 | 6435 | 66.38 | 446 | 437 | 90.4 |
| B | 0 | 219 | 12889 | 147.62 | 449 | 439 | 84.3 |
| B | 4 | 48 | 11290 | 128.66 | 449 | 439 | 84.3 |
| B | 15 | 204 | 7530 | 84.08 | 449 | 439 | 84.3 |
| C | 3 | 9 | 38173 | 370.98 | 438 | 441 | 101.7 |
| C | 9 | 68 | 20983 | 201.97 | 438 | 441 | 101.7 |
| C | 9 | 247 | 14912 | 142.28 | 438 | 441 | 101.7 |
| D | 8 | 195 | 317537 | 3000.28 | 432 | 419 | 105.7 |
| D | 14 | 34 | 284407 | 2686.83 | 432 | 419 | 105.7 |
| D | 2 | 33 | 203537 | 1921.71 | 432 | 419 | 105.7 |
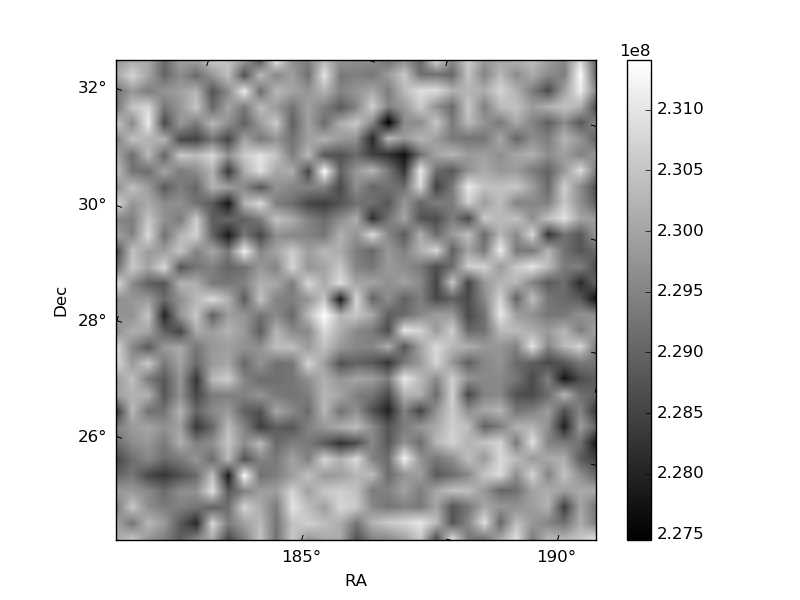
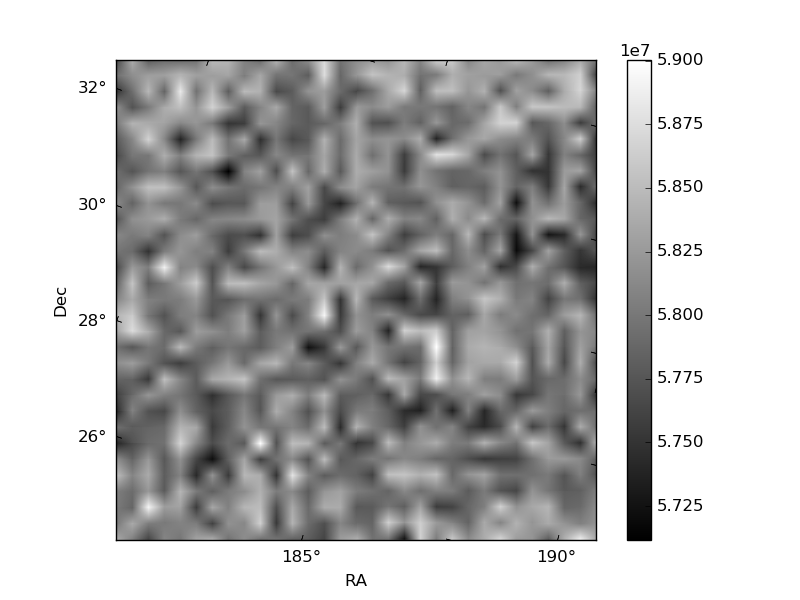
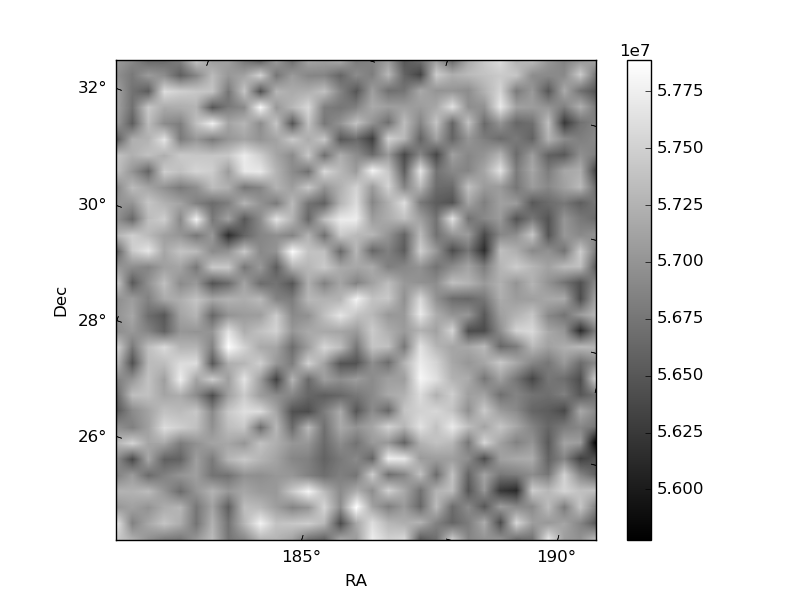
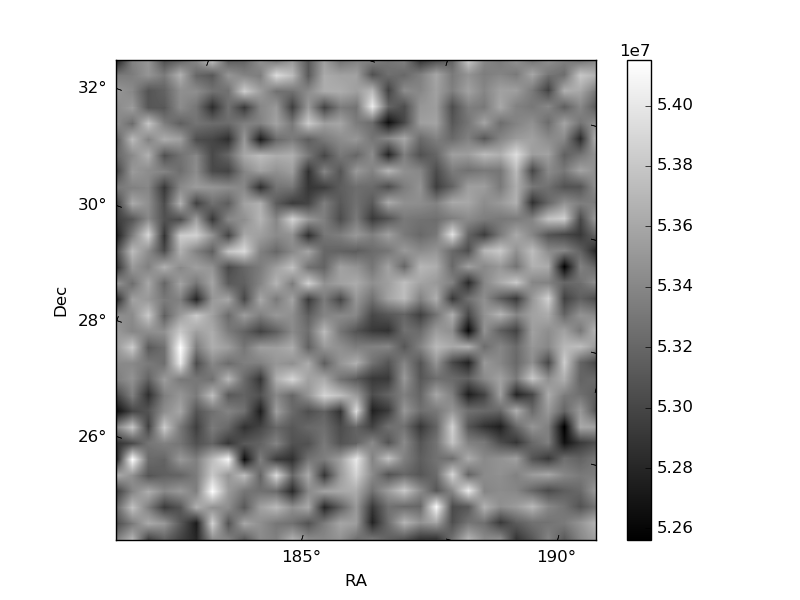
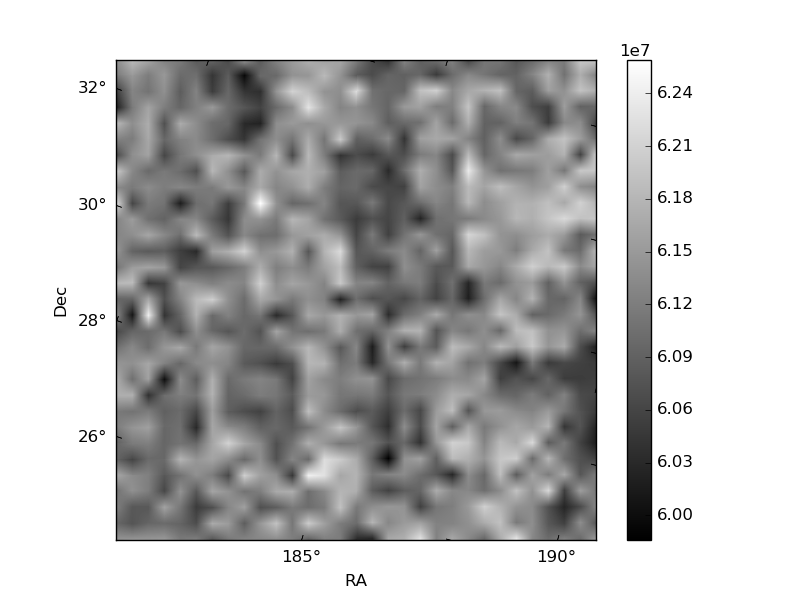
Histogram calculated using DETX and DETY for each event in the final _common_clean file
| Quadrant A | 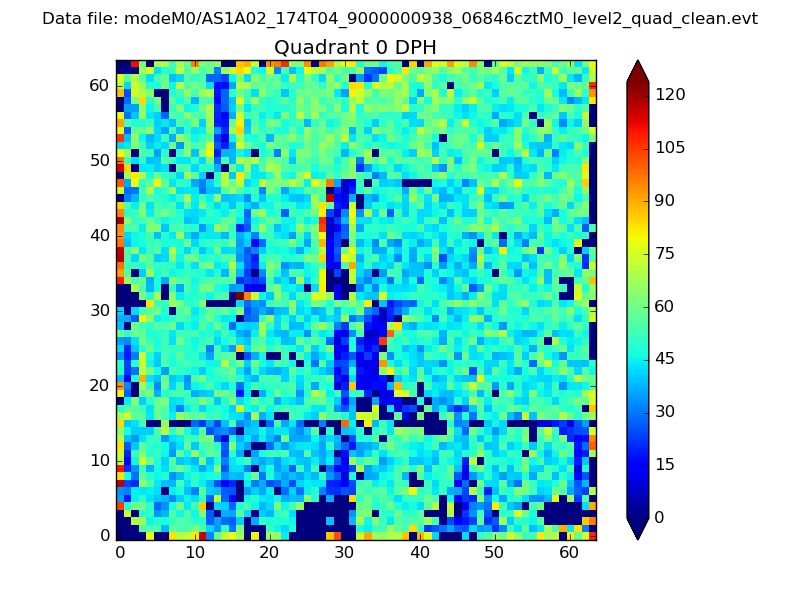 |
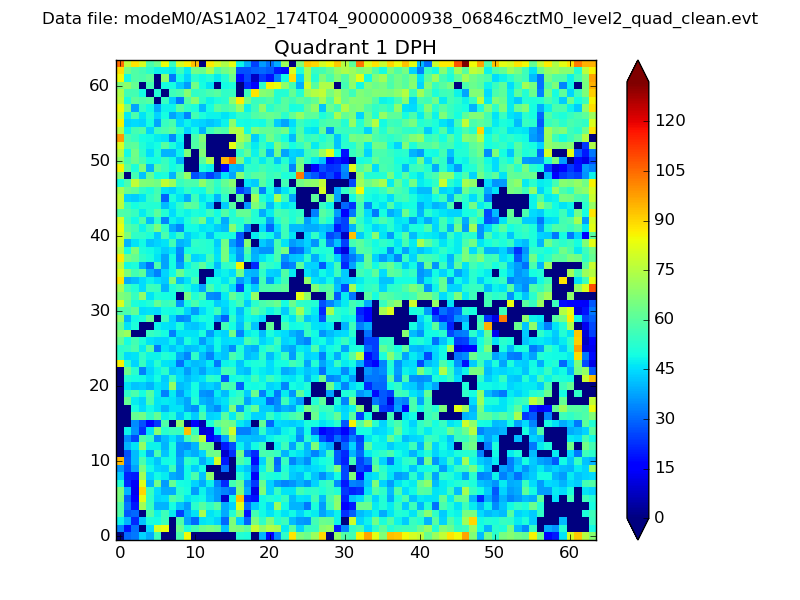 |
Quadrant B |
|---|---|---|---|
| Quadrant D | 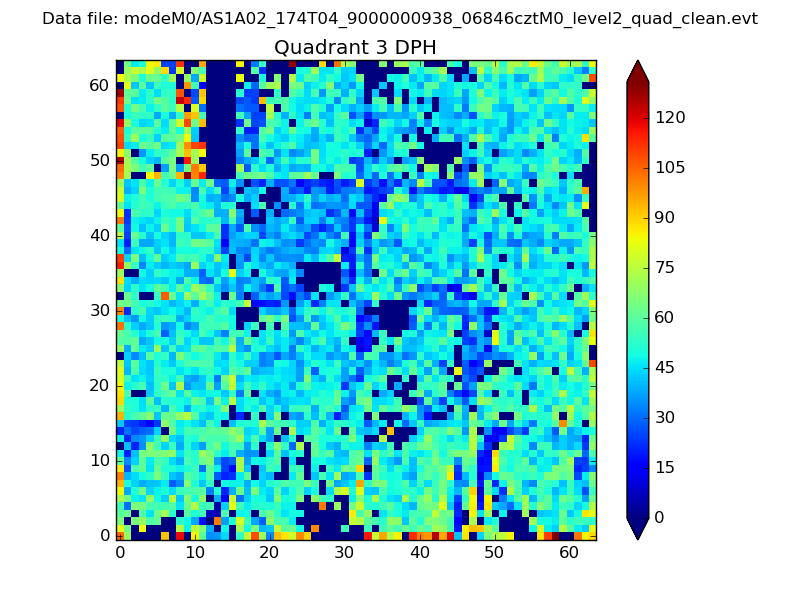 |
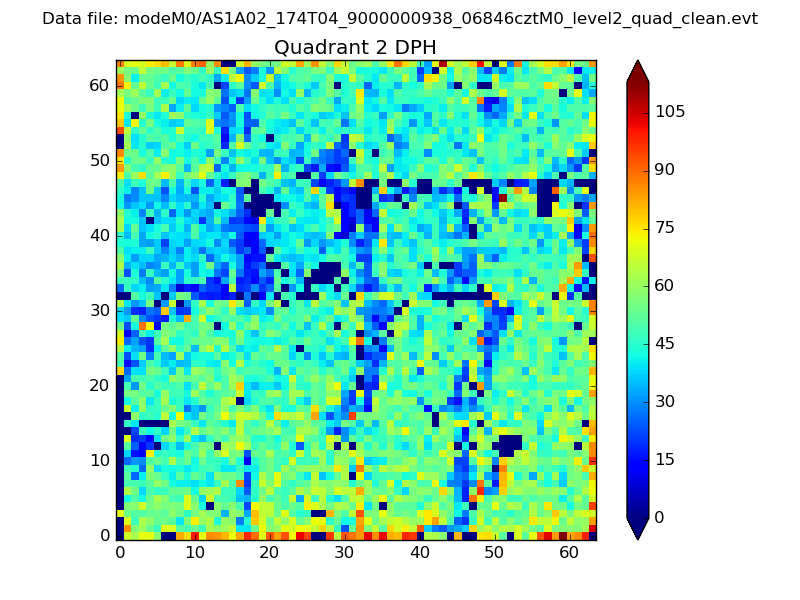 |
Quadrant C |
| Plot type | Count rate plots | Images |
|---|---|---|
| Comparison with Poisson distribution Blue bars denote a histogram of data divided into 1 sec bins. Red curve is a Poisson curve with rate = median count rate of data. |
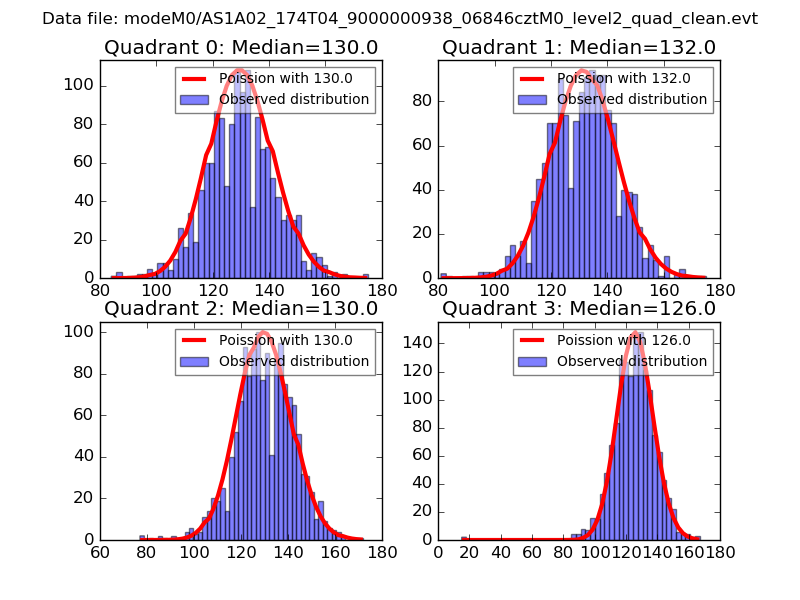 |
 |
| Quadrant-wise count rates Data is divided into 100 sec bins |
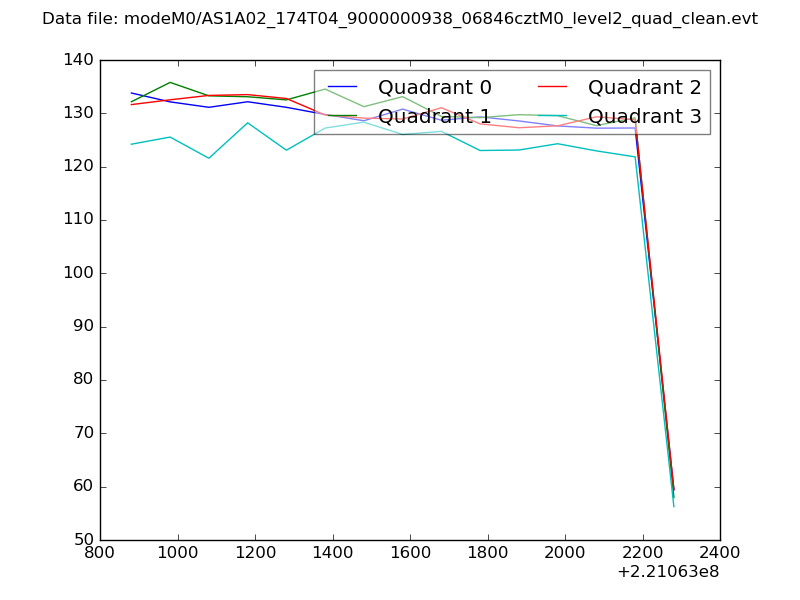 |
|
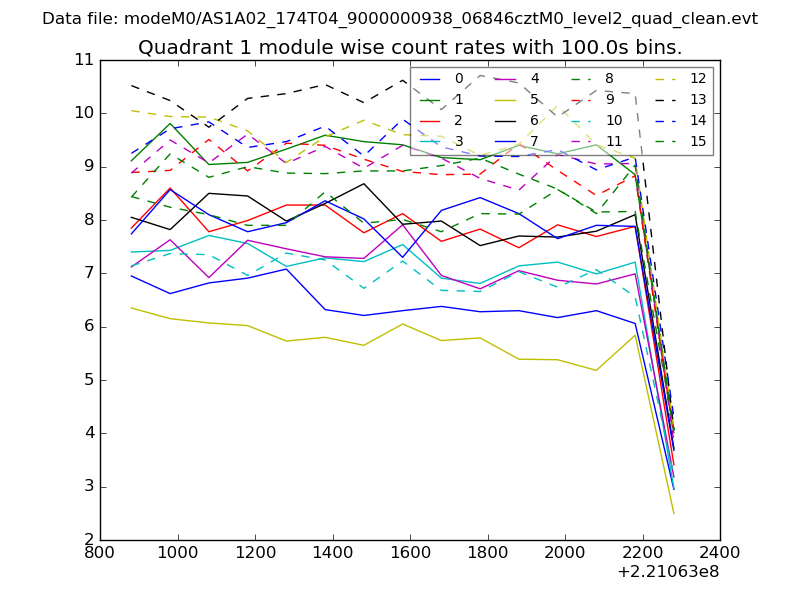
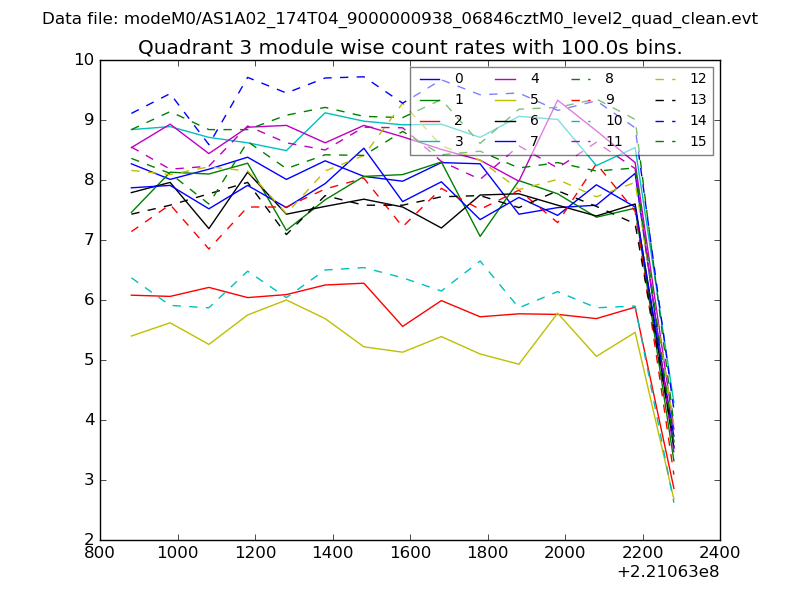
| Module-wise count rates for Quadrant A Data is divided into 100 sec bins |
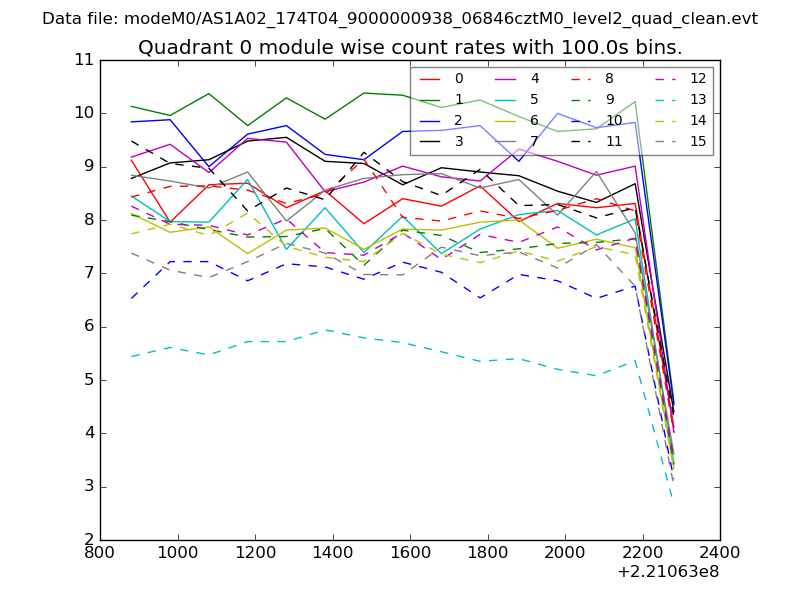 |
 |
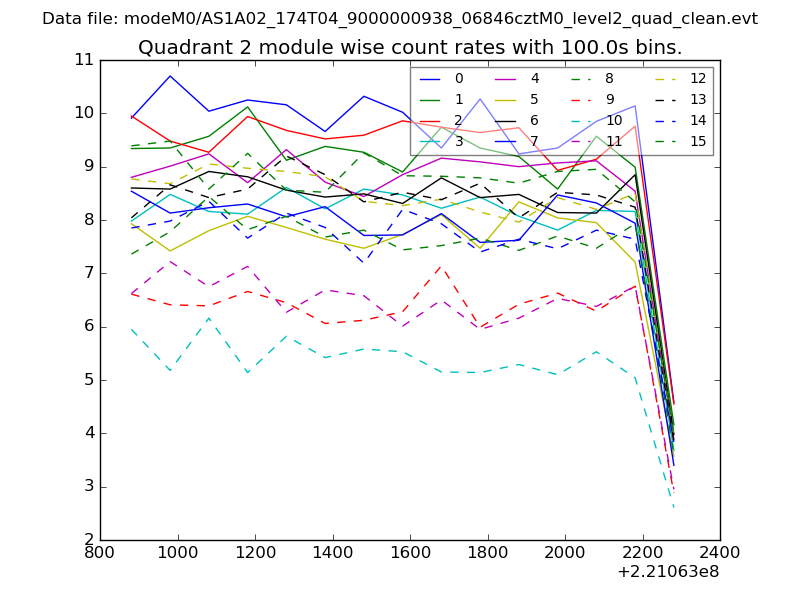
| Module-wise count rates for Quadrant B Data is divided into 100 sec bins |
 |
 |
| Module-wise count rates for Quadrant C Data is divided into 100 sec bins |
 |
 |
| Module-wise count rates for Quadrant D Data is divided into 100 sec bins |
 |
 |
| Parameter | Plot |
|---|---|
| CZT HV Monitor | 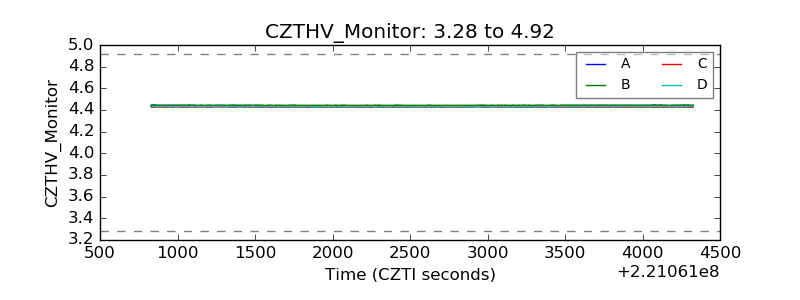 |
| D_VDD | 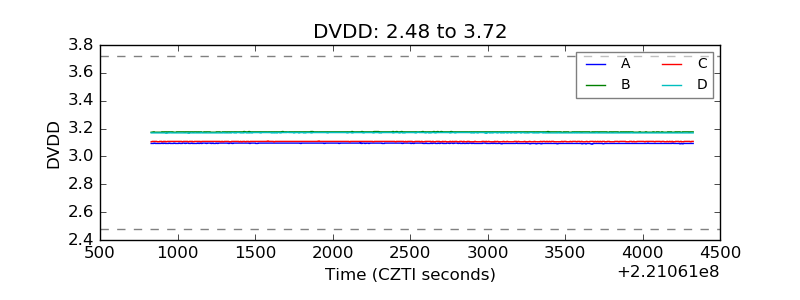 |
| Temperature 1 | 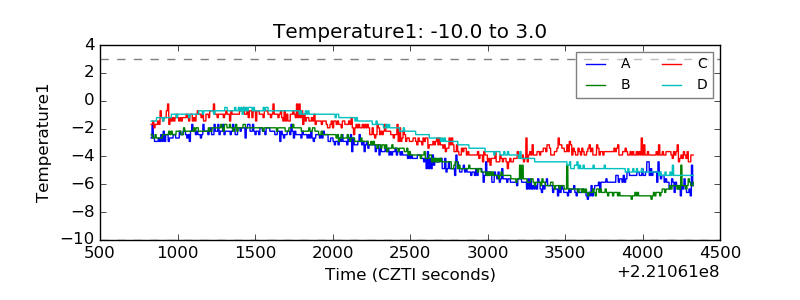 |
| Veto HV Monitor |  |
| Veto LLD |  |
| Alpha Counter | 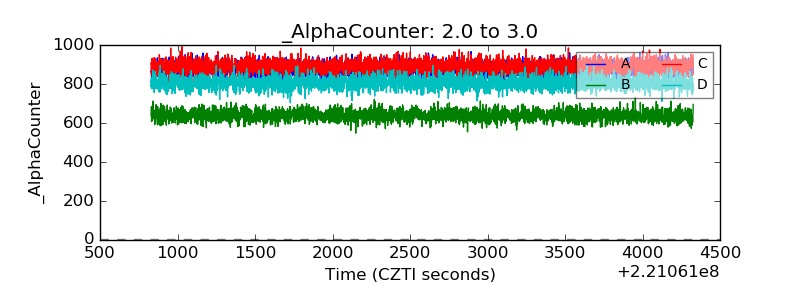 |
| _CPM_Rate | 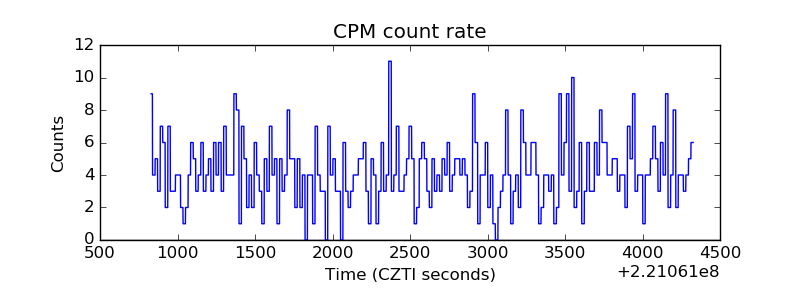 |
| CZT Counter | 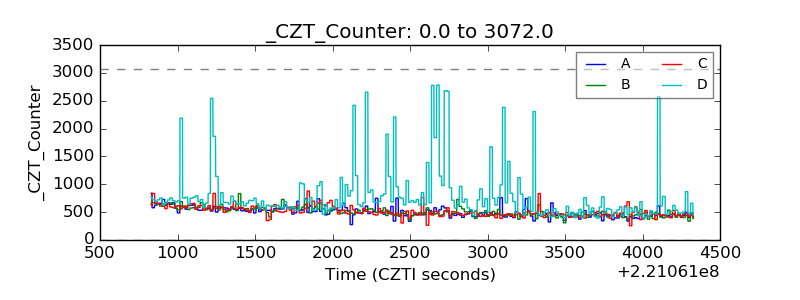 |
| +2.5 Volts monitor | 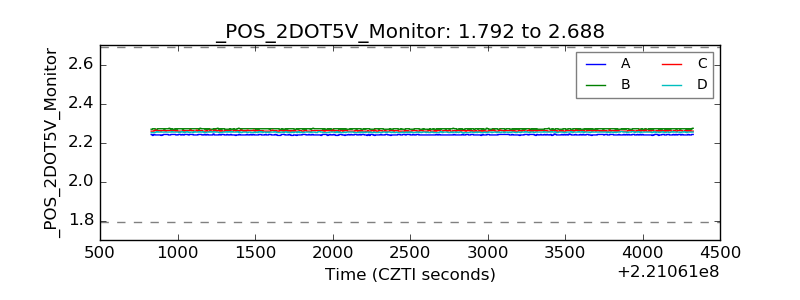 |
| +5 Volts monitor |  |
| _ROLL_ROT | 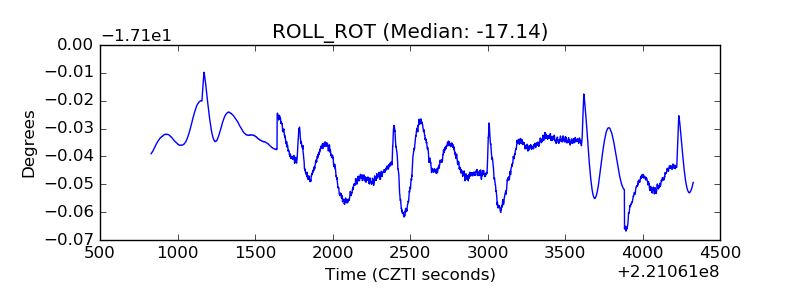 |
| _Roll_DEC | 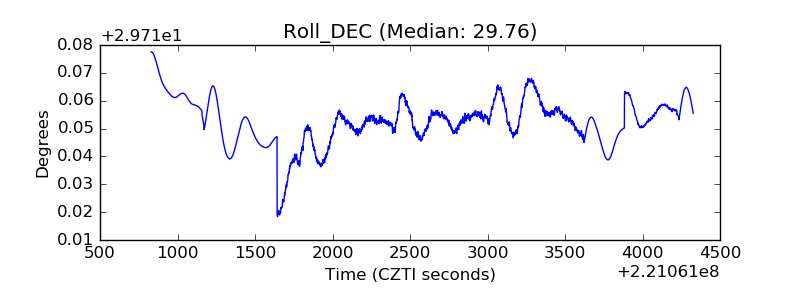 |
| _Roll_RA | 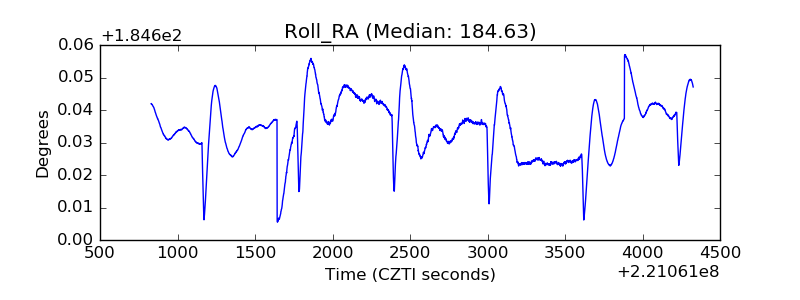 |
| Veto Counter | 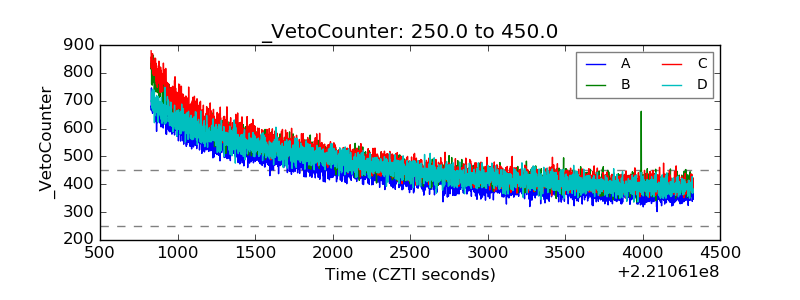 |