| Param | Original file | Final file |
|---|---|---|
| Filename | modeM0/AS1A02_075T02_9000000940cztM0_level2.fits | modeM0/AS1A02_075T02_9000000940cztM0_level2_quad_clean.evt |
| Size (bytes) | 74,139,840 | 61,156,800 |
| Size | 70.7 MB | 58.3 MB |
| Events in quadrant A | 448,102 | 345,668 |
| Events in quadrant B | 439,726 | 350,841 |
| Events in quadrant C | 458,134 | 332,683 |
| Events in quadrant D | 391,060 | 313,785 |
| Mode M0 | |||
|---|---|---|---|
| Quadrant | BADHDUFLAG | Total packets | Discarded packets |
| A | 0 | 19442 | 0 |
| B | 0 | 16873 | 0 |
| C | 0 | 16178 | 0 |
| D | 0 | 17367 | 0 |
| Mode M9 | |||
|---|---|---|---|
| Quadrant | BADHDUFLAG | Total packets | Discarded packets |
| A | 0 | 26 | 0 |
| B | 0 | 26 | 0 |
| C | 0 | 26 | 0 |
| D | 0 | 26 | 0 |
| Mode SS | |||
|---|---|---|---|
| Quadrant | BADHDUFLAG | Total packets | Discarded packets |
| A | 0 | 150 | 0 |
| B | 0 | 150 | 0 |
| C | 0 | 150 | 0 |
| D | 0 | 150 | 0 |
| Quadrant | Total seconds | Saturated seconds | Saturation percentage |
|---|---|---|---|
| A | 7301 | 385 | 5.273250% |
| B | 7301 | 248 | 3.396795% |
| C | 7301 | 198 | 2.711957% |
| D | 7301 | 352 | 4.821257% |
Noise dominated data is calculated using 1-second bins in cleaned event files. If a bin has >2000 counts, and if more than 50% of those come from <1% of pixels, then it is considered to be noise-dominated and hence unusable.
| Quadrant | # 1 sec bins | Bins with >0 counts | Bins with >2000 counts | High rate bins dominated by noise | Noise dominated (total time) | Noise dominated (detector-on time) | Marked lightcurve |
|---|---|---|---|---|---|---|---|
| A | 9891 | 7301 | 0 | 0 | 0.00% | 0.00% | 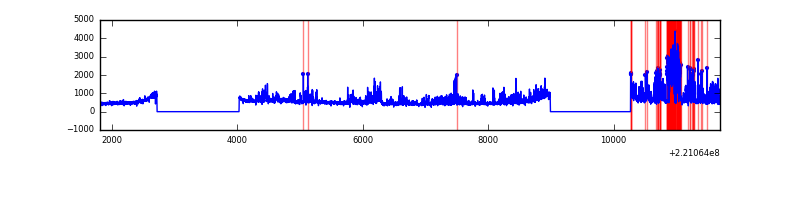 |
| B | 9891 | 7301 | 0 | 0 | 0.00% | 0.00% |  |
| C | 9891 | 7301 | 0 | 0 | 0.00% | 0.00% | 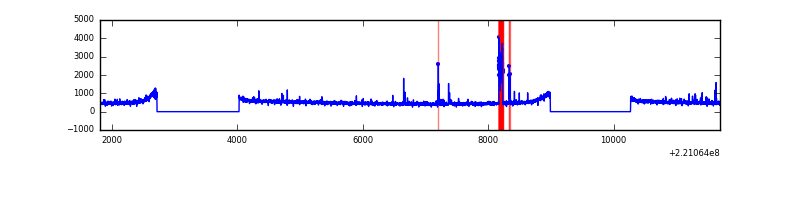 |
| D | 9891 | 7301 | 0 | 0 | 0.00% | 0.00% |  |
Top three noisy pixels from each quadrant. If the there are fewer than three noisy pixels in the level2.evt file, extra rows are filled as -1
| Pixel properties | Quadrant properties | ||||||
|---|---|---|---|---|---|---|---|
| Quadrant | DetID | PixID | Counts | Sigma | Mean | Median | Sigma |
| A | 0 | 29 | 415 | 9.7 | 116 | 109 | 31.5 |
| A | 7 | 110 | 346 | 7.52 | 116 | 109 | 31.5 |
| A | 15 | 236 | 327 | 6.91 | 116 | 109 | 31.5 |
| B | 2 | 9 | 360 | 9.71 | 116 | 111 | 25.6 |
| B | 3 | 17 | 311 | 7.8 | 116 | 111 | 25.6 |
| B | 3 | 80 | 302 | 7.45 | 116 | 111 | 25.6 |
| C | 3 | 126 | 328 | 6.56 | 120 | 112 | 32.9 |
| C | 1 | 80 | 313 | 6.1 | 120 | 112 | 32.9 |
| C | 12 | 249 | 312 | 6.07 | 120 | 112 | 32.9 |
| D | 11 | 82 | 295 | 6.32 | 111 | 102 | 30.5 |
| D | 6 | 232 | 292 | 6.22 | 111 | 102 | 30.5 |
| D | 10 | 113 | 291 | 6.19 | 111 | 102 | 30.5 |
Histogram calculated using DETX and DETY for each event in the final _common_clean file
| Quadrant A | 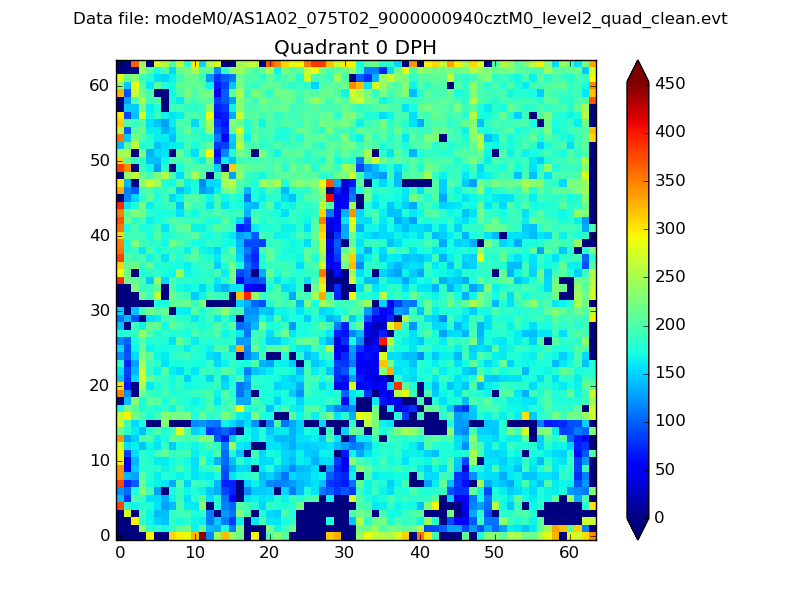 |
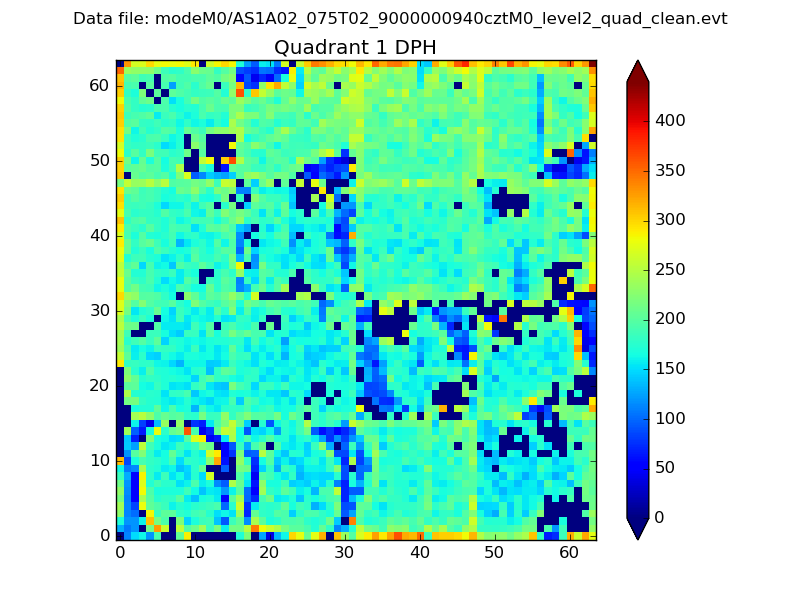 |
Quadrant B |
|---|---|---|---|
| Quadrant D |  |
 |
Quadrant C |
| Plot type | Count rate plots | Images |
|---|---|---|
| Comparison with Poisson distribution Blue bars denote a histogram of data divided into 1 sec bins. Red curve is a Poisson curve with rate = median count rate of data. |
 |
 |
| Quadrant-wise count rates Data is divided into 100 sec bins |
 |
|
| Module-wise count rates for Quadrant A Data is divided into 100 sec bins |
 |
 |
| Module-wise count rates for Quadrant B Data is divided into 100 sec bins |
 |
 |
| Module-wise count rates for Quadrant C Data is divided into 100 sec bins |
 |
 |
| Module-wise count rates for Quadrant D Data is divided into 100 sec bins |
 |
 |
| Parameter | Plot |
|---|---|
| CZT HV Monitor |  |
| D_VDD |  |
| Temperature 1 |  |
| Veto HV Monitor |  |
| Veto LLD | 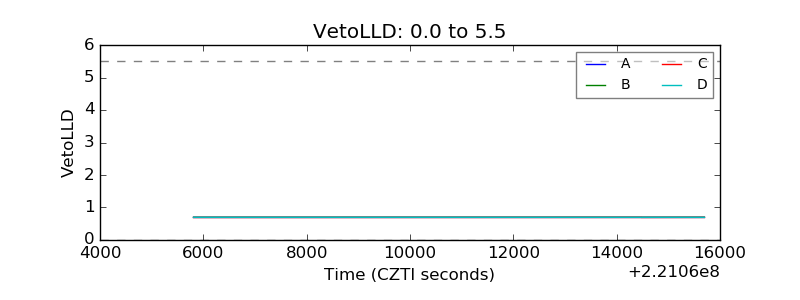 |
| Alpha Counter | 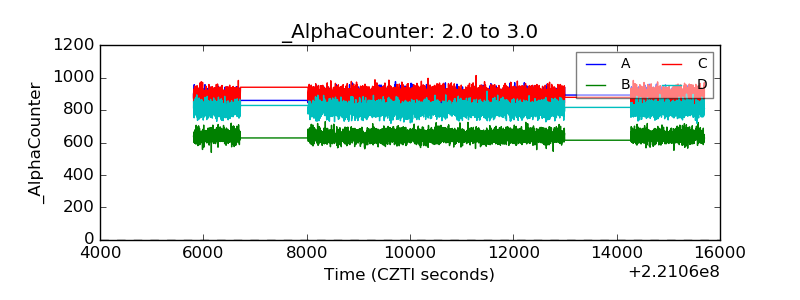 |
| _CPM_Rate | 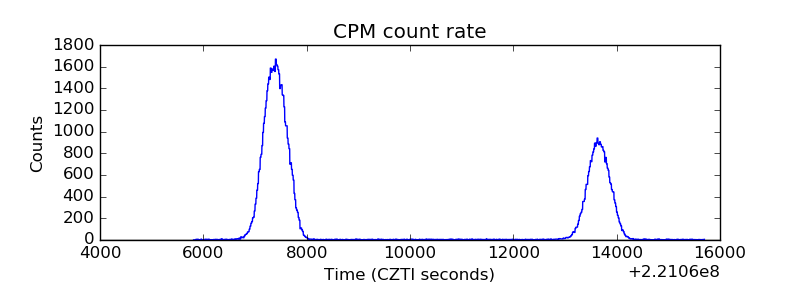 |
| CZT Counter | 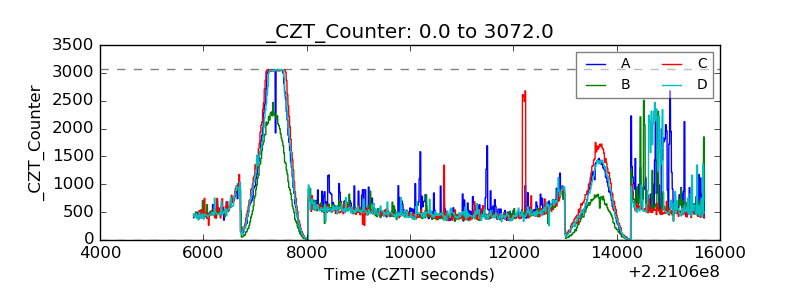 |
| +2.5 Volts monitor |  |
| +5 Volts monitor |  |
| _ROLL_ROT |  |
| _Roll_DEC |  |
| _Roll_RA |  |
| Veto Counter |  |