| Param | Original file | Final file |
|---|---|---|
| Filename | modeM0/AS1A02_075T02_9000000940_06846cztM0_level2.evt | modeM0/AS1A02_075T02_9000000940_06846cztM0_level2_quad_clean.evt |
| Size (bytes) | 165,856,320 | 21,412,800 |
| Size | 158.2 MB | 20.4 MB |
| Events in quadrant A | 1,295,821 | 122,331 |
| Events in quadrant B | 1,218,218 | 126,233 |
| Events in quadrant C | 1,189,974 | 124,691 |
| Events in quadrant D | 1,172,136 | 120,423 |
| Mode M0 | |||
|---|---|---|---|
| Quadrant | BADHDUFLAG | Total packets | Discarded packets |
| A | 0 | 5281 | 2 |
| B | 0 | 4959 | 1 |
| C | 0 | 4838 | 1 |
| D | 0 | 4775 | 1 |
| Mode M9 | |||
|---|---|---|---|
| Quadrant | BADHDUFLAG | Total packets | Discarded packets |
| A | 0 | 13 | 0 |
| B | 0 | 13 | 0 |
| C | 0 | 13 | 0 |
| D | 0 | 13 | 0 |
| Mode SS | |||
|---|---|---|---|
| Quadrant | BADHDUFLAG | Total packets | Discarded packets |
| A | 0 | 44 | 0 |
| B | 0 | 44 | 0 |
| C | 0 | 44 | 0 |
| D | 0 | 44 | 0 |
| Quadrant | Total seconds | Saturated seconds | Saturation percentage |
|---|---|---|---|
| A | 2129 | 87 | 4.086426% |
| B | 2129 | 87 | 4.086426% |
| C | 2129 | 74 | 3.475810% |
| D | 2129 | 81 | 3.804603% |
Noise dominated data is calculated using 1-second bins in cleaned event files. If a bin has >2000 counts, and if more than 50% of those come from <1% of pixels, then it is considered to be noise-dominated and hence unusable.
| Quadrant | # 1 sec bins | Bins with >0 counts | Bins with >2000 counts | High rate bins dominated by noise | Noise dominated (total time) | Noise dominated (detector-on time) | Marked lightcurve |
|---|---|---|---|---|---|---|---|
| A | 3439 | 2130 | 2 | 2 | 0.06% | 0.09% | 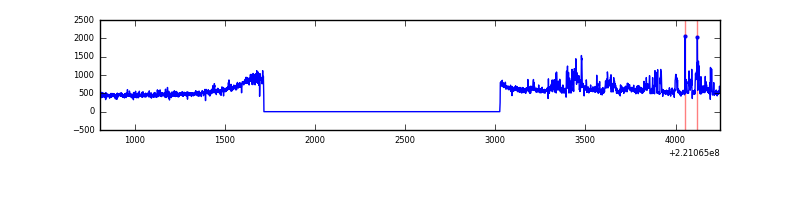 |
| B | 3439 | 2130 | 1 | 1 | 0.03% | 0.05% | 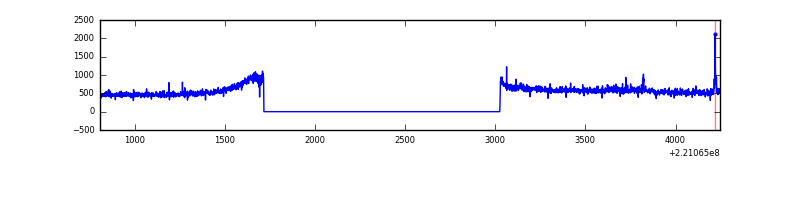 |
| C | 3439 | 2130 | 0 | 0 | 0.00% | 0.00% | 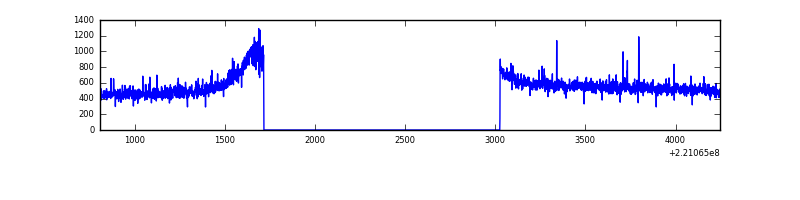 |
| D | 3439 | 2130 | 0 | 0 | 0.00% | 0.00% | 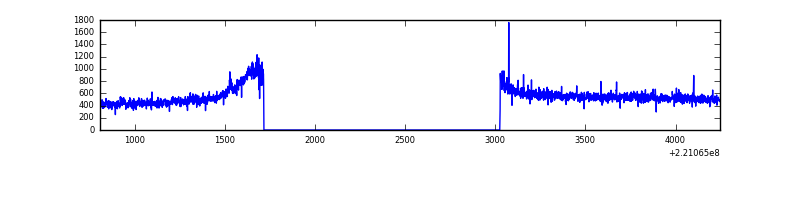 |
Top three noisy pixels from each quadrant. If the there are fewer than three noisy pixels in the level2.evt file, extra rows are filled as -1
| Pixel properties | Quadrant properties | ||||||
|---|---|---|---|---|---|---|---|
| Quadrant | DetID | PixID | Counts | Sigma | Mean | Median | Sigma |
| A | 8 | 15 | 124842 | 1992.13 | 301 | 296 | 62.5 |
| A | 15 | 239 | 5328 | 80.49 | 301 | 296 | 62.5 |
| A | 0 | 226 | 2906 | 41.75 | 301 | 296 | 62.5 |
| B | 0 | 228 | 19418 | 321.04 | 302 | 296 | 59.6 |
| B | 0 | 219 | 8254 | 133.61 | 302 | 296 | 59.6 |
| B | 0 | 214 | 6850 | 110.03 | 302 | 296 | 59.6 |
| C | 9 | 68 | 21112 | 298.74 | 297 | 298 | 69.7 |
| C | 9 | 247 | 4788 | 64.45 | 297 | 298 | 69.7 |
| C | 10 | 22 | 3625 | 47.75 | 297 | 298 | 69.7 |
| D | 8 | 195 | 25522 | 343.82 | 298 | 288 | 73.4 |
| D | 2 | 152 | 8308 | 109.27 | 298 | 288 | 73.4 |
| D | 5 | 81 | 5154 | 66.3 | 298 | 288 | 73.4 |
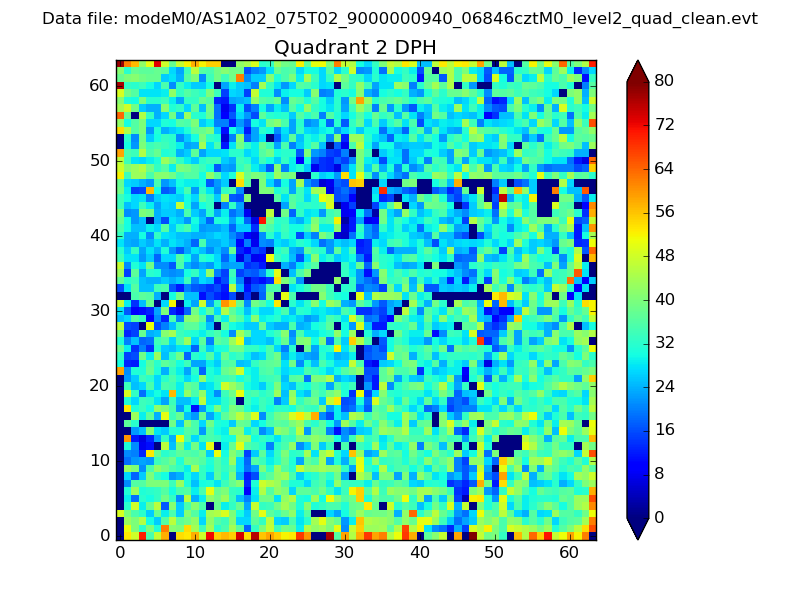
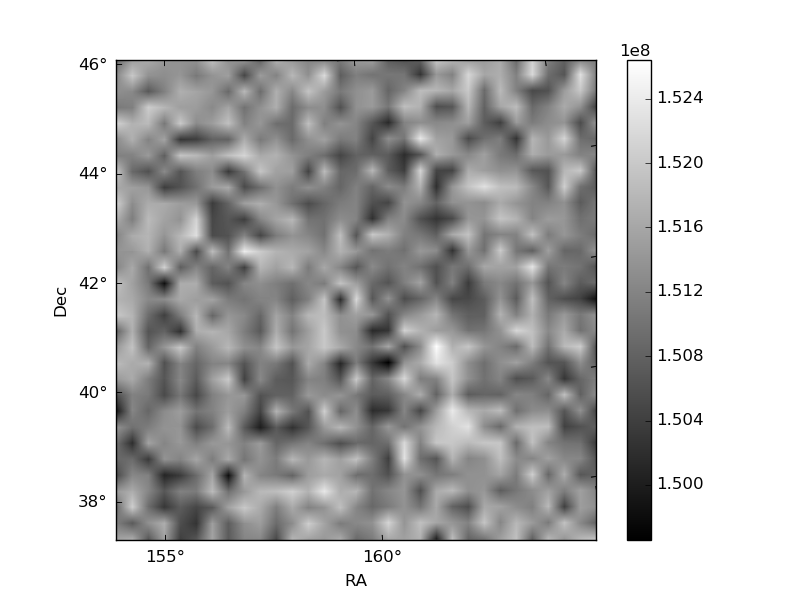
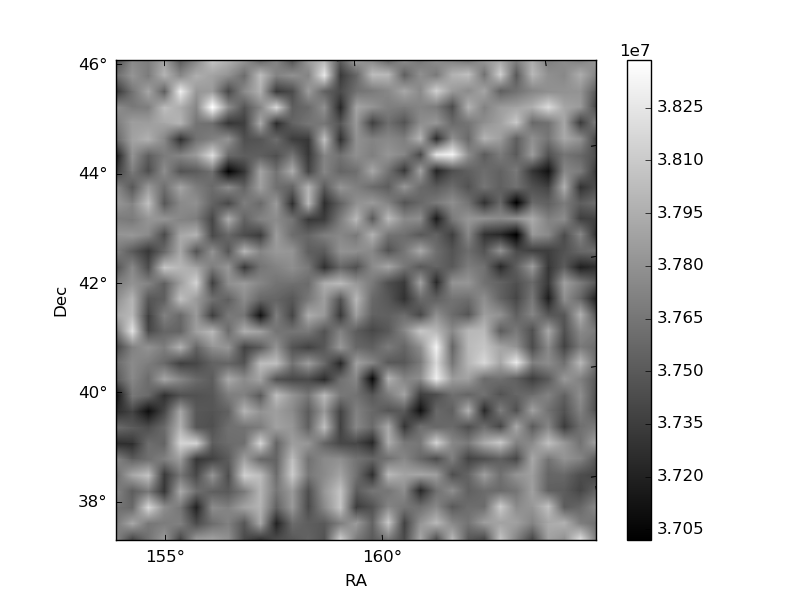
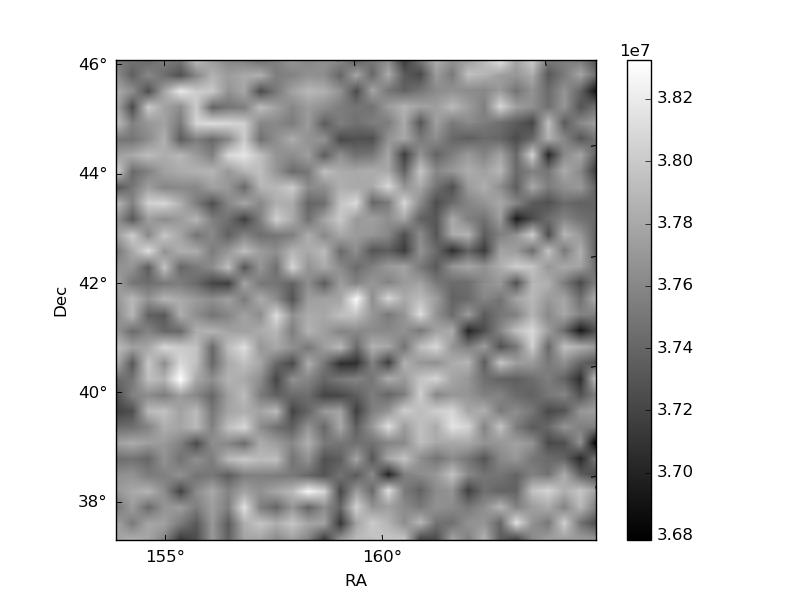
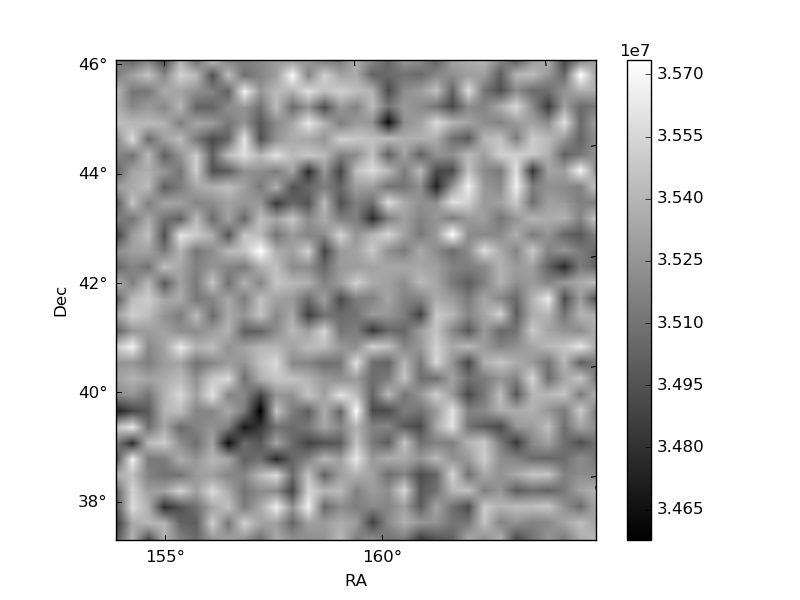
Histogram calculated using DETX and DETY for each event in the final _common_clean file
| Quadrant A | 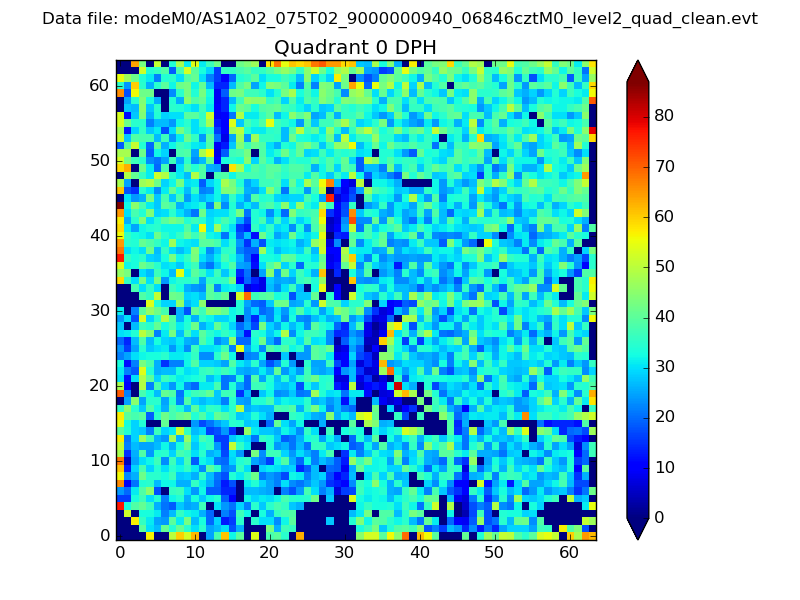 |
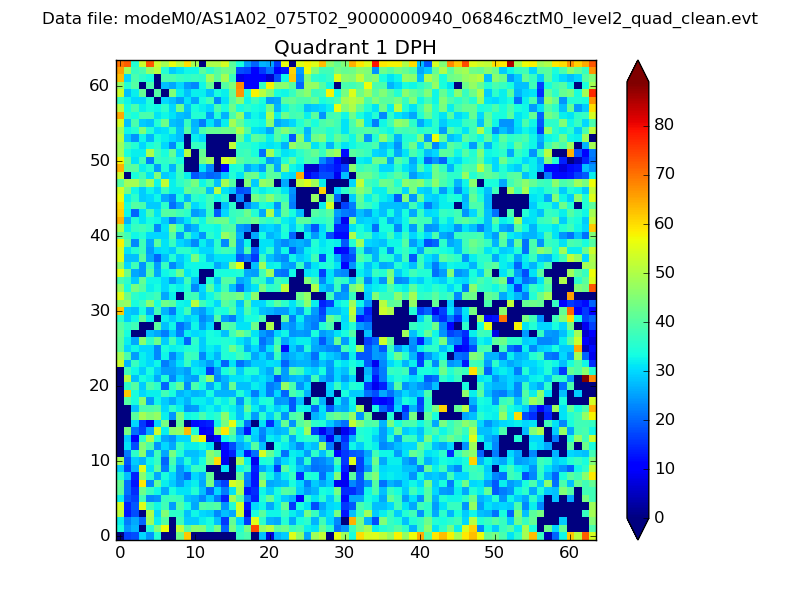 |
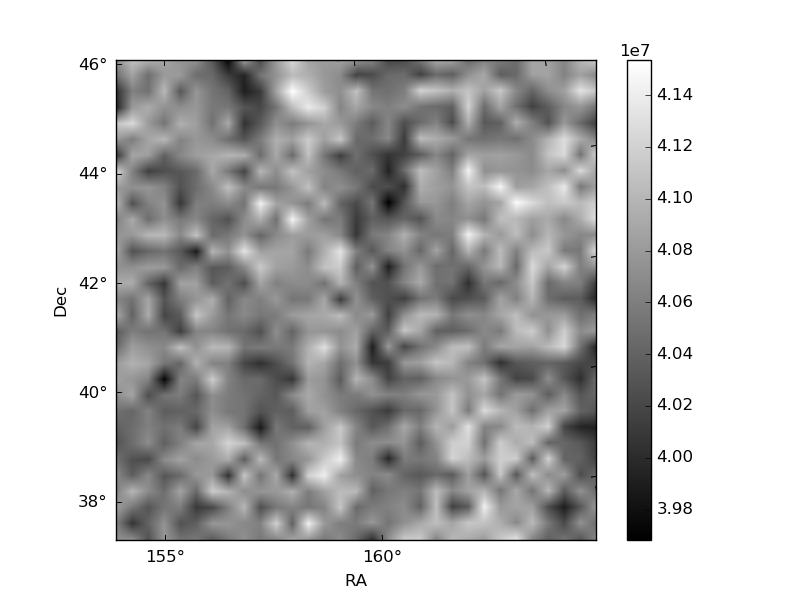
Quadrant B |
|---|---|---|---|
| Quadrant D | 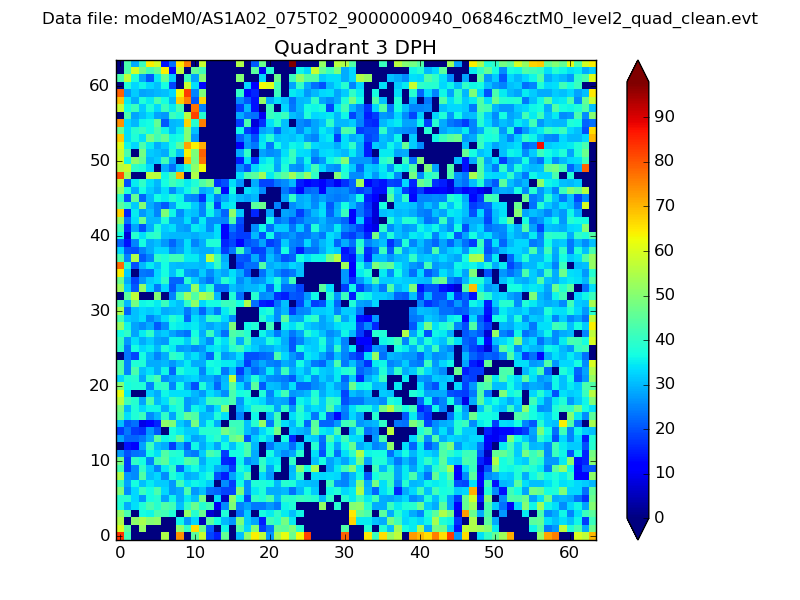 |
 |
Quadrant C |
| Plot type | Count rate plots | Images |
|---|---|---|
| Comparison with Poisson distribution Blue bars denote a histogram of data divided into 1 sec bins. Red curve is a Poisson curve with rate = median count rate of data. |
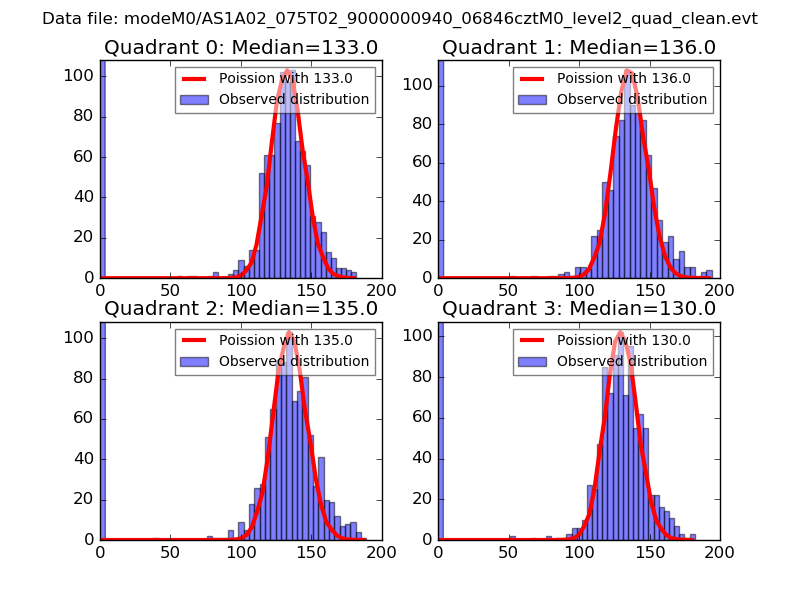 |
 |
| Quadrant-wise count rates Data is divided into 100 sec bins |
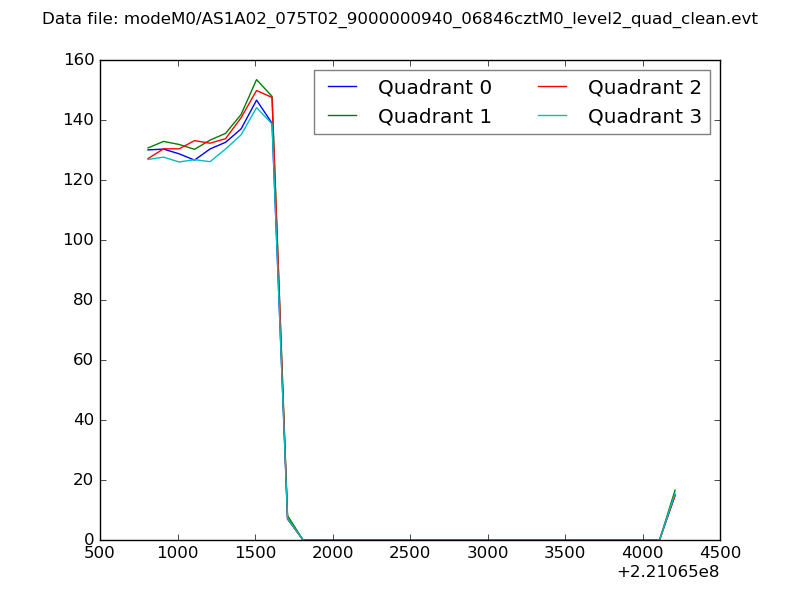 |
|
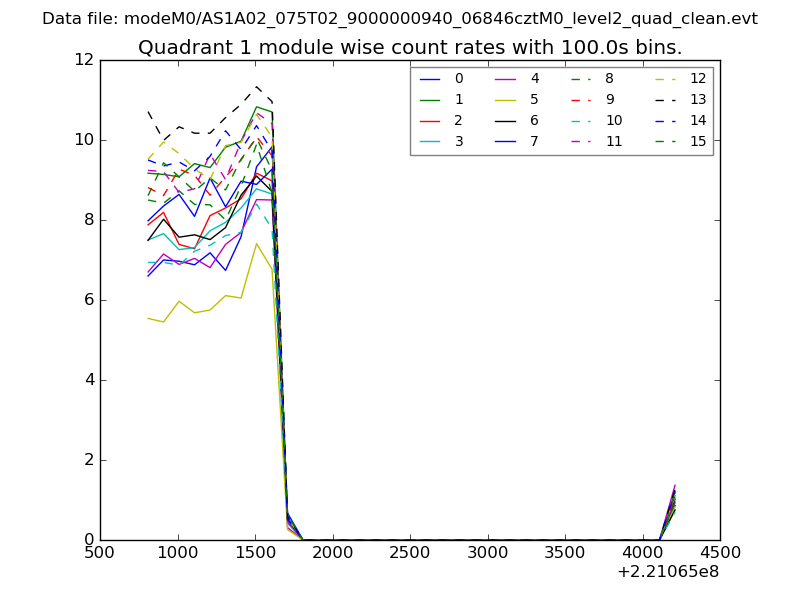
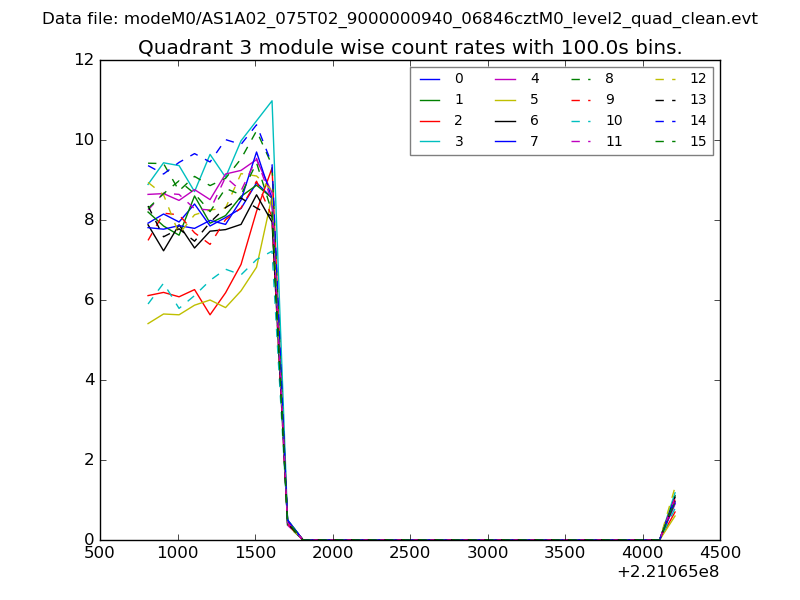
| Module-wise count rates for Quadrant A Data is divided into 100 sec bins |
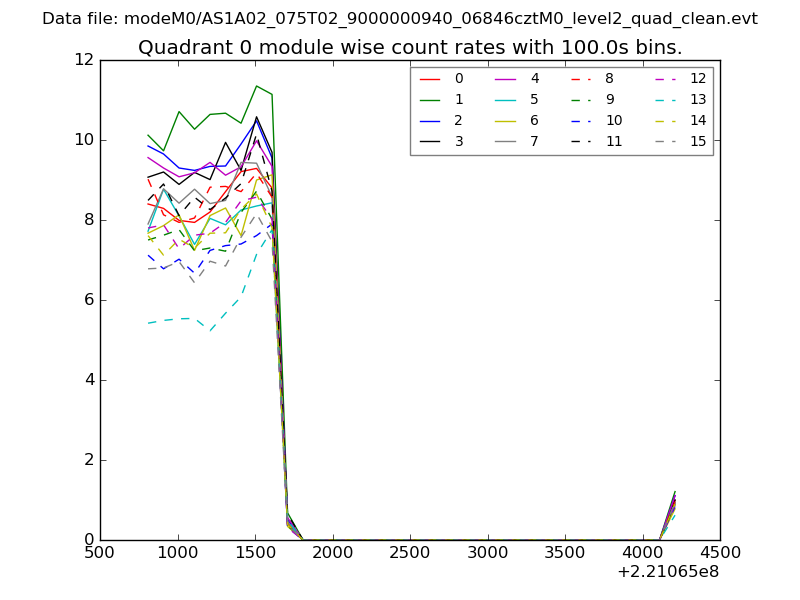 |
 |
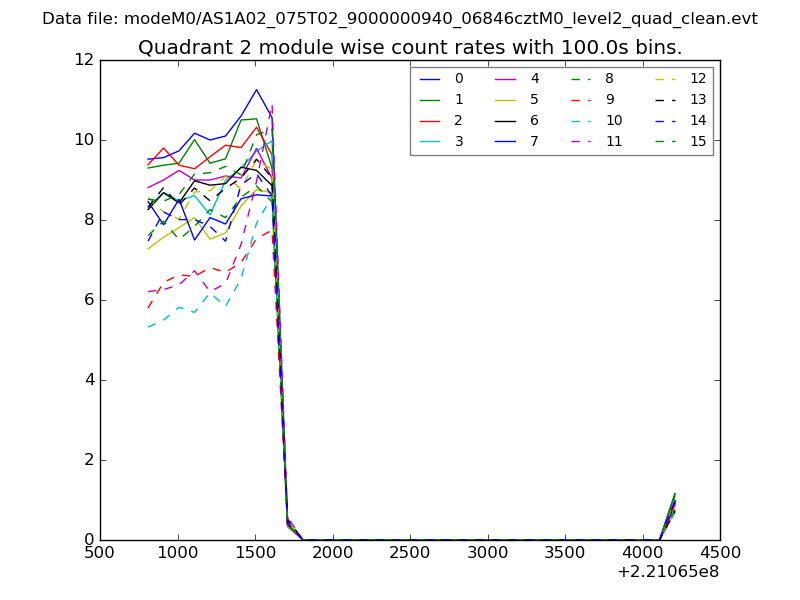
| Module-wise count rates for Quadrant B Data is divided into 100 sec bins |
 |
 |
| Module-wise count rates for Quadrant C Data is divided into 100 sec bins |
 |
 |
| Module-wise count rates for Quadrant D Data is divided into 100 sec bins |
 |
 |
| Parameter | Plot |
|---|---|
| CZT HV Monitor | 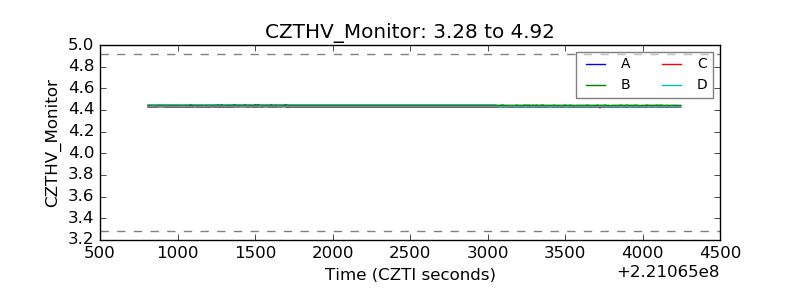 |
| D_VDD | 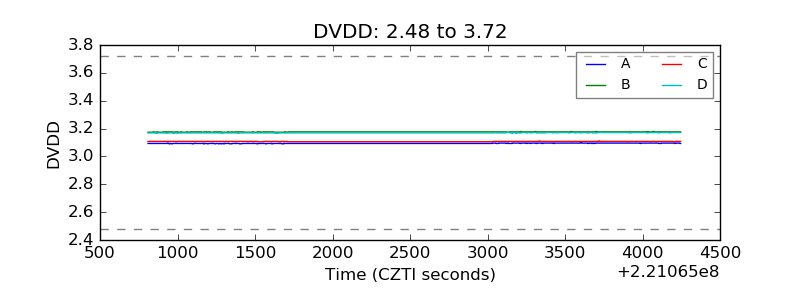 |
| Temperature 1 | 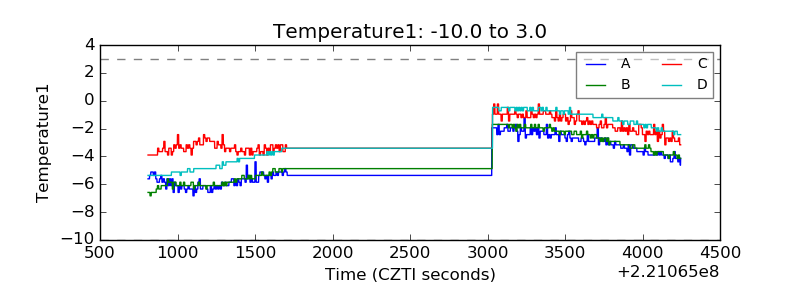 |
| Veto HV Monitor | 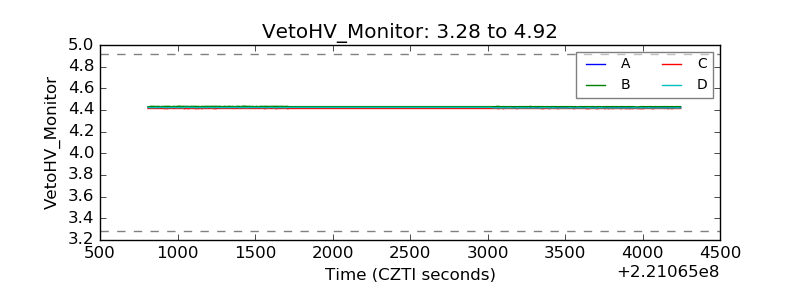 |
| Veto LLD | 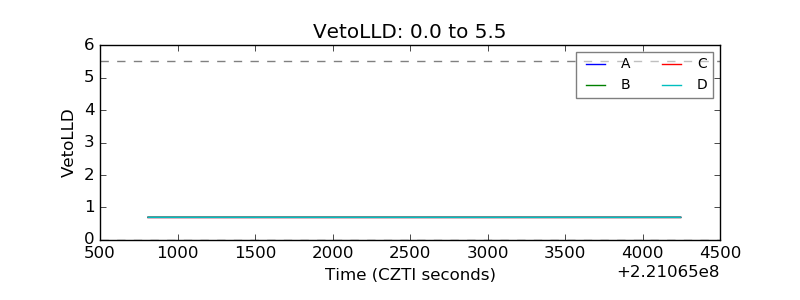 |
| Alpha Counter | 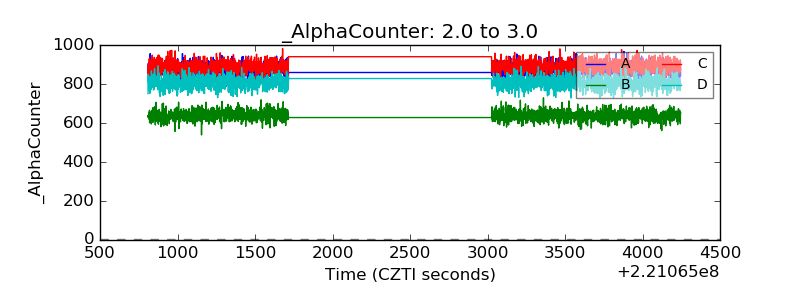 |
| _CPM_Rate | 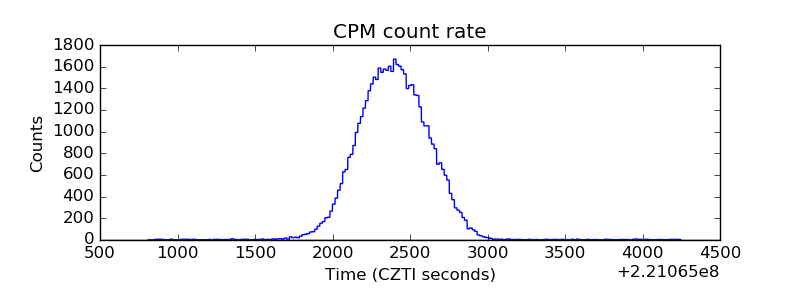 |
| CZT Counter | 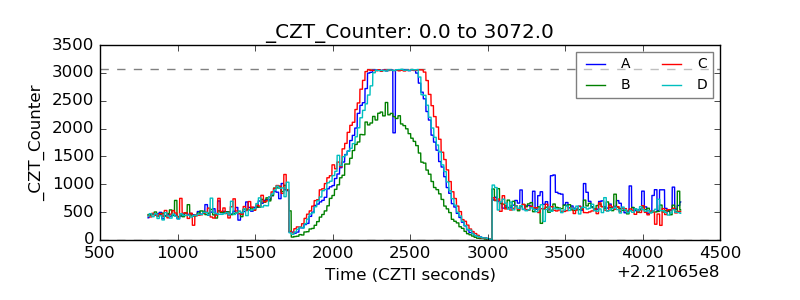 |
| +2.5 Volts monitor | 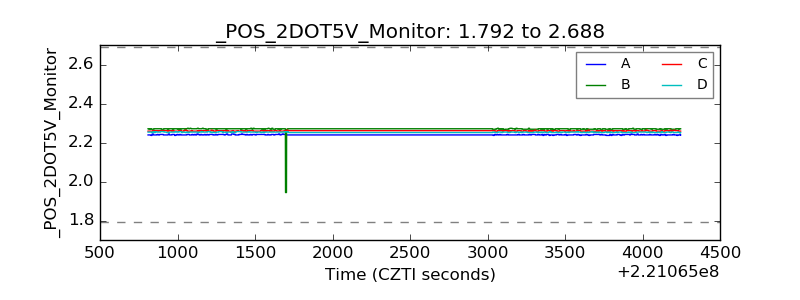 |
| +5 Volts monitor | 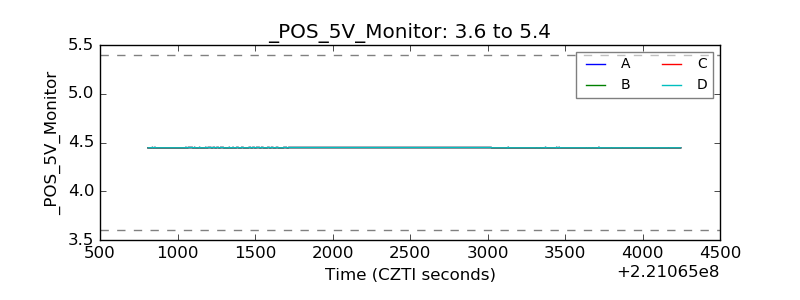 |
| _ROLL_ROT | 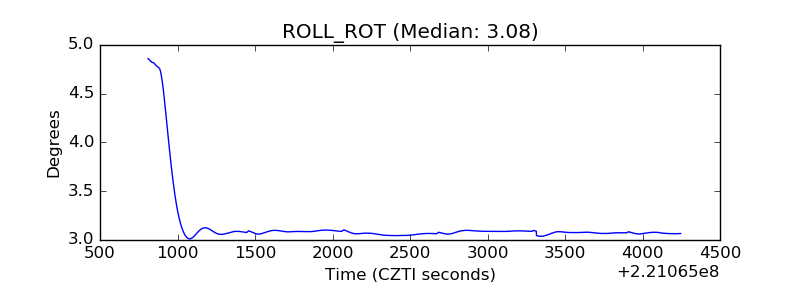 |
| _Roll_DEC | 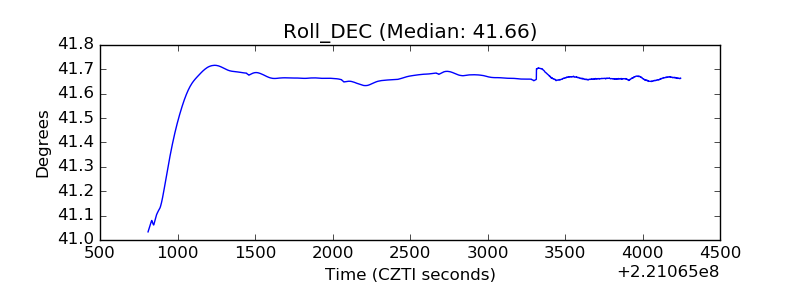 |
| _Roll_RA | 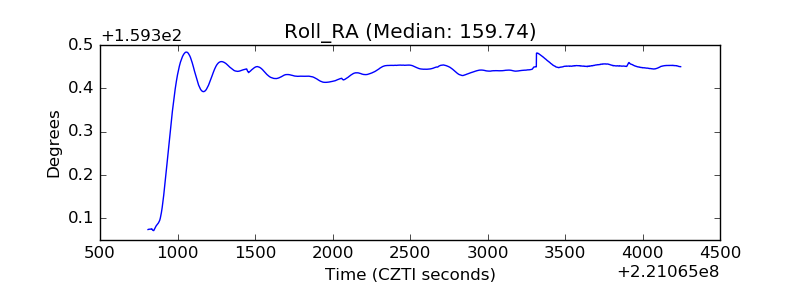 |
| Veto Counter | 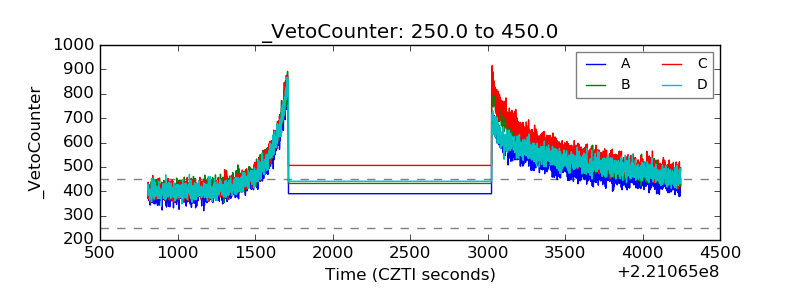 |