| Param | Original file | Final file |
|---|---|---|
| Filename | modeM0/AS1A02_075T02_9000000940_06848cztM0_level2.evt | modeM0/AS1A02_075T02_9000000940_06848cztM0_level2_quad_clean.evt |
| Size (bytes) | 510,814,080 | 89,058,240 |
| Size | 487.2 MB | 84.9 MB |
| Events in quadrant A | 4,385,821 | 561,693 |
| Events in quadrant B | 3,538,673 | 573,536 |
| Events in quadrant C | 3,349,138 | 566,451 |
| Events in quadrant D | 3,762,455 | 549,220 |
| Mode M0 | |||
|---|---|---|---|
| Quadrant | BADHDUFLAG | Total packets | Discarded packets |
| A | 0 | 17374 | 2 |
| B | 0 | 14820 | 2 |
| C | 0 | 14082 | 2 |
| D | 0 | 15285 | 2 |
| Mode M9 | |||
|---|---|---|---|
| Quadrant | BADHDUFLAG | Total packets | Discarded packets |
| A | 0 | 23 | 0 |
| B | 0 | 23 | 0 |
| C | 0 | 23 | 0 |
| D | 0 | 24 | 0 |
| Mode SS | |||
|---|---|---|---|
| Quadrant | BADHDUFLAG | Total packets | Discarded packets |
| A | 0 | 130 | 0 |
| B | 0 | 130 | 0 |
| C | 0 | 130 | 0 |
| D | 0 | 130 | 0 |
| Quadrant | Total seconds | Saturated seconds | Saturation percentage |
|---|---|---|---|
| A | 6392 | 305 | 4.771589% |
| B | 6392 | 168 | 2.628285% |
| C | 6392 | 127 | 1.986859% |
| D | 6392 | 273 | 4.270964% |
Noise dominated data is calculated using 1-second bins in cleaned event files. If a bin has >2000 counts, and if more than 50% of those come from <1% of pixels, then it is considered to be noise-dominated and hence unusable.
| Quadrant | # 1 sec bins | Bins with >0 counts | Bins with >2000 counts | High rate bins dominated by noise | Noise dominated (total time) | Noise dominated (detector-on time) | Marked lightcurve |
|---|---|---|---|---|---|---|---|
| A | 7672 | 6393 | 134 | 134 | 1.75% | 2.10% | 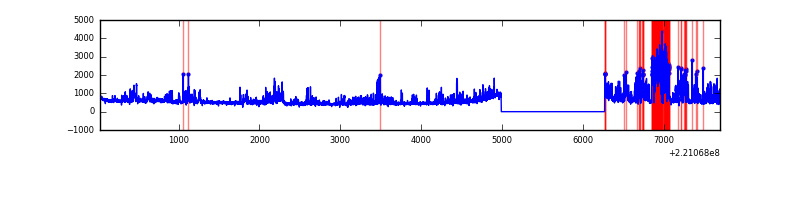 |
| B | 7672 | 6393 | 45 | 45 | 0.59% | 0.70% | 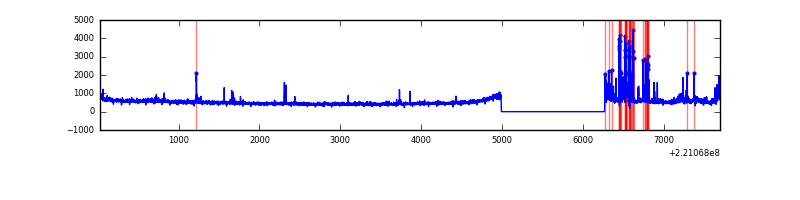 |
| C | 7672 | 6393 | 59 | 59 | 0.77% | 0.92% | 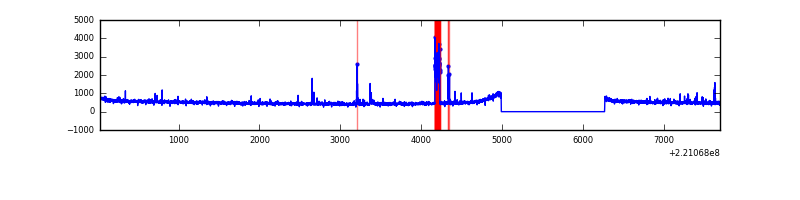 |
| D | 7672 | 6393 | 125 | 125 | 1.63% | 1.96% | 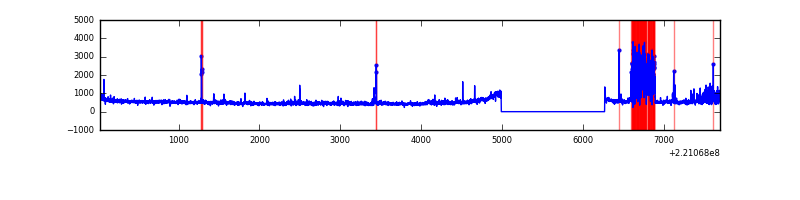 |
Top three noisy pixels from each quadrant. If the there are fewer than three noisy pixels in the level2.evt file, extra rows are filled as -1
| Pixel properties | Quadrant properties | ||||||
|---|---|---|---|---|---|---|---|
| Quadrant | DetID | PixID | Counts | Sigma | Mean | Median | Sigma |
| A | 8 | 15 | 1228203 | 7687.67 | 794 | 779 | 159.7 |
| A | 13 | 251 | 66630 | 412.44 | 794 | 779 | 159.7 |
| A | 15 | 239 | 15677 | 93.31 | 794 | 779 | 159.7 |
| B | 4 | 48 | 200661 | 1321.33 | 804 | 789 | 151.3 |
| B | 0 | 228 | 142235 | 935.08 | 804 | 789 | 151.3 |
| B | 0 | 214 | 26802 | 171.97 | 804 | 789 | 151.3 |
| C | 9 | 68 | 213265 | 1179.89 | 789 | 793 | 180.1 |
| C | 10 | 22 | 29313 | 158.38 | 789 | 793 | 180.1 |
| C | 12 | 4 | 18999 | 101.1 | 789 | 793 | 180.1 |
| D | 2 | 33 | 493557 | 2584.34 | 779 | 755 | 190.7 |
| D | 8 | 195 | 124470 | 648.78 | 779 | 755 | 190.7 |
| D | 2 | 136 | 71011 | 368.43 | 779 | 755 | 190.7 |
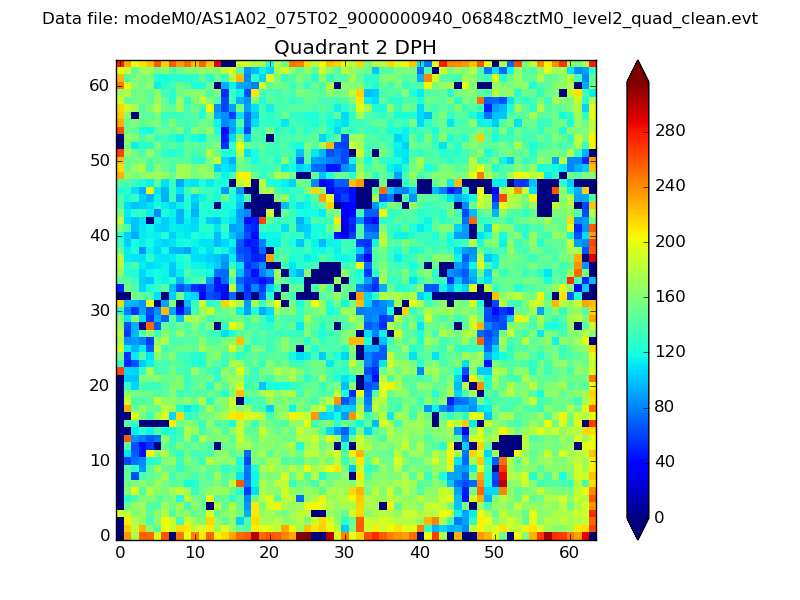
Histogram calculated using DETX and DETY for each event in the final _common_clean file
| Quadrant A | 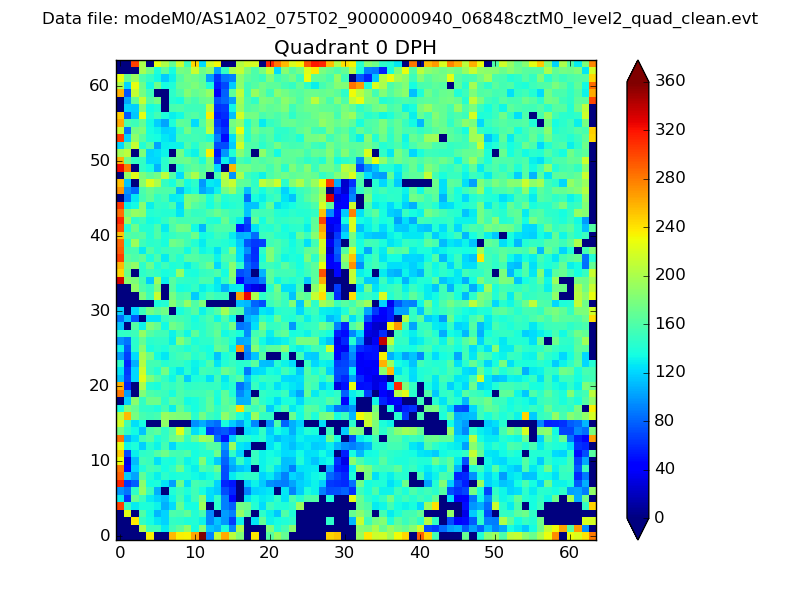 |
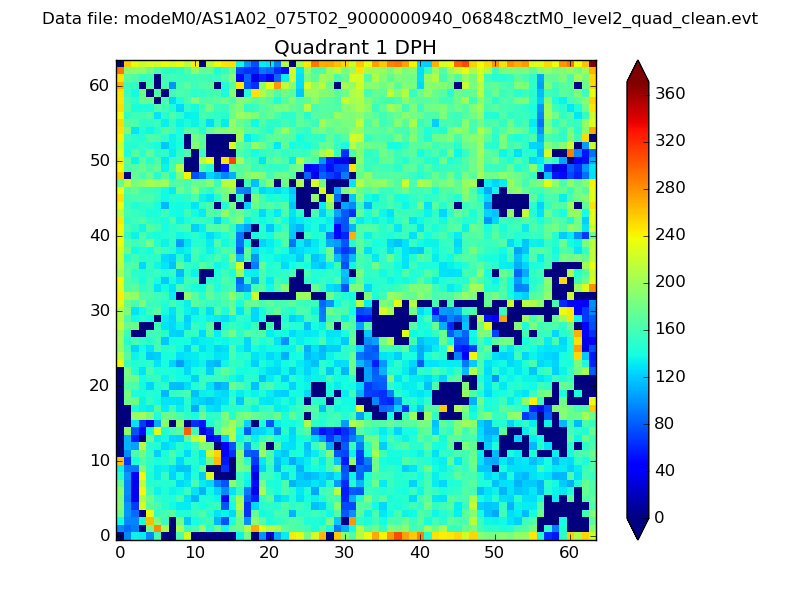 |
Quadrant B |
|---|---|---|---|
| Quadrant D | 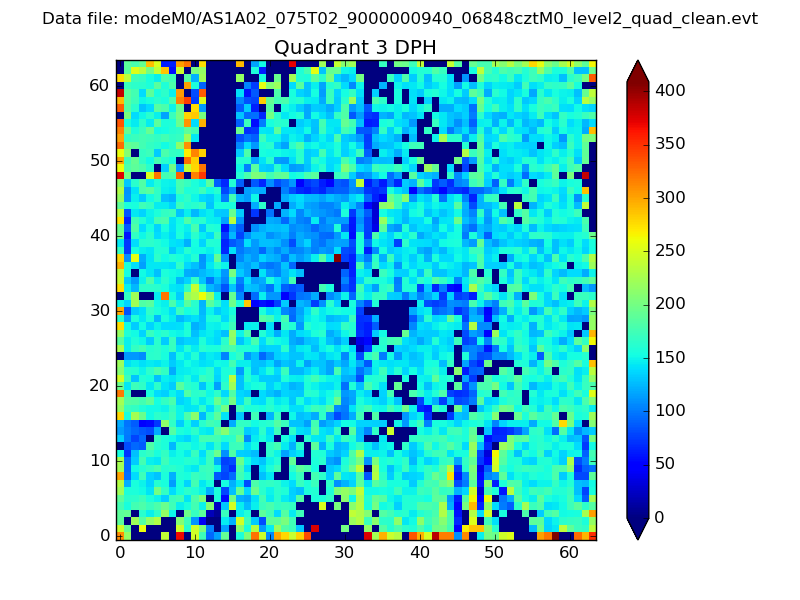 |
 |
Quadrant C |
| Plot type | Count rate plots | Images |
|---|---|---|
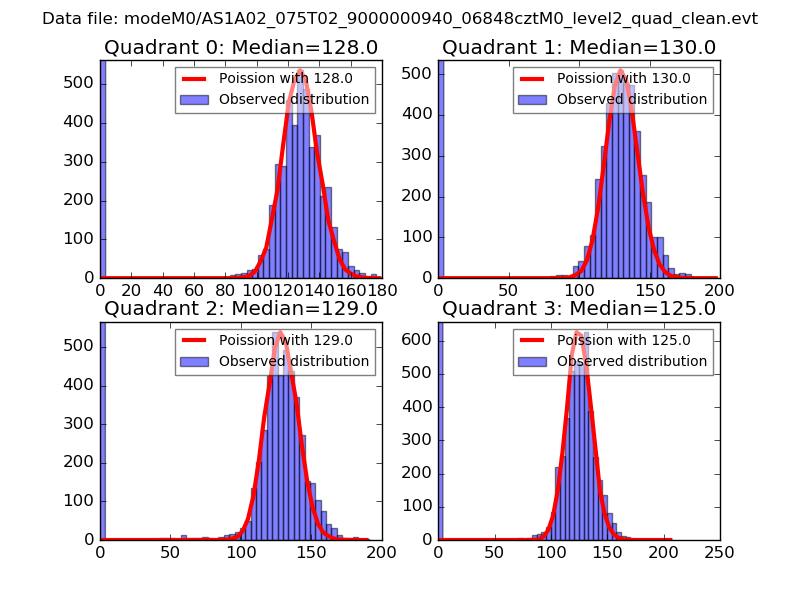
| Comparison with Poisson distribution Blue bars denote a histogram of data divided into 1 sec bins. Red curve is a Poisson curve with rate = median count rate of data. |
 |
 |
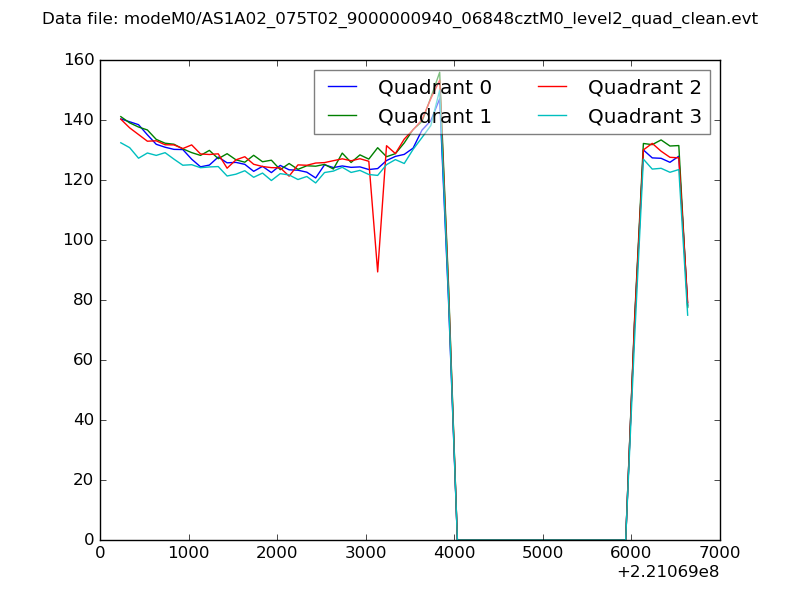
| Quadrant-wise count rates Data is divided into 100 sec bins |
 |
|
| Module-wise count rates for Quadrant A Data is divided into 100 sec bins |
 |
 |
| Module-wise count rates for Quadrant B Data is divided into 100 sec bins |
 |
 |
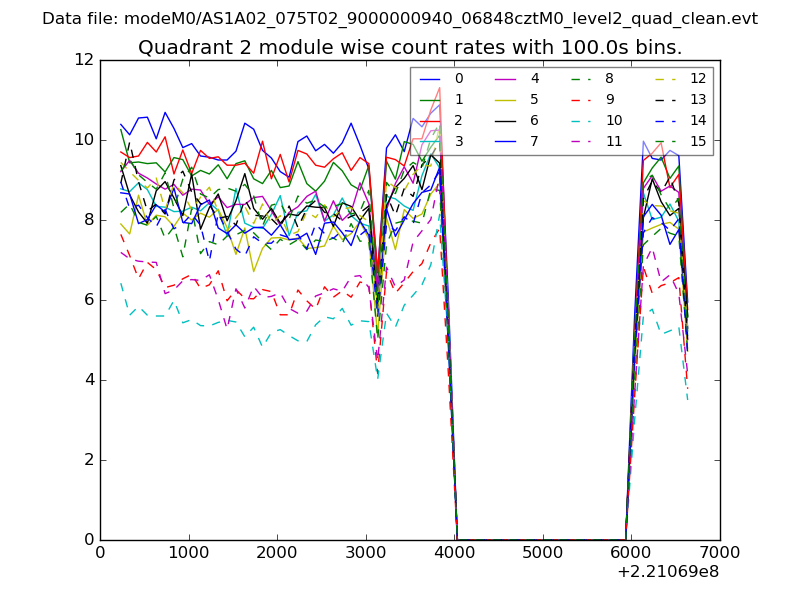
| Module-wise count rates for Quadrant C Data is divided into 100 sec bins |
 |
 |
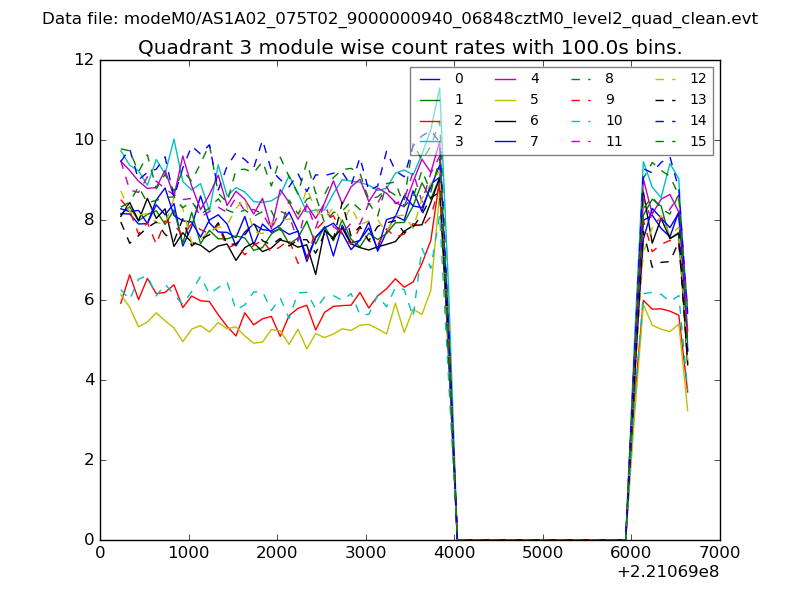
| Module-wise count rates for Quadrant D Data is divided into 100 sec bins |
 |
 |
| Parameter | Plot |
|---|---|
| CZT HV Monitor | 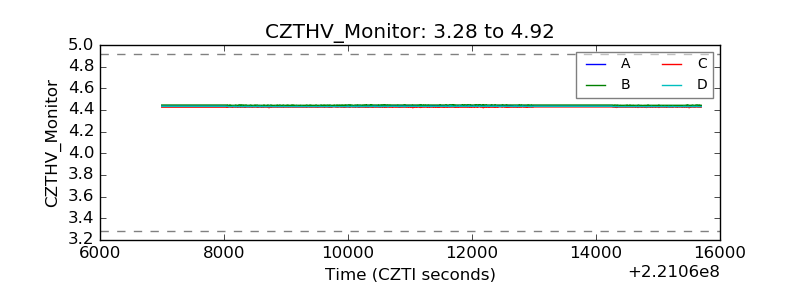 |
| D_VDD | 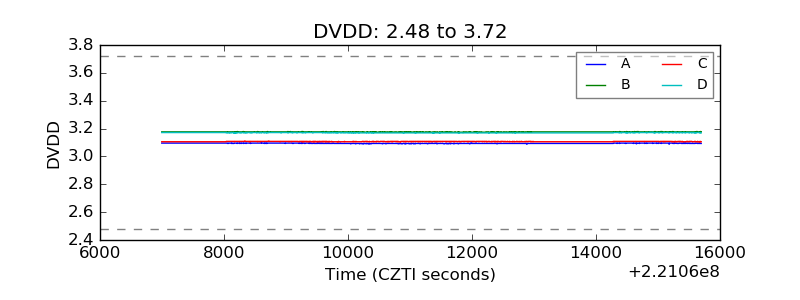 |
| Temperature 1 | 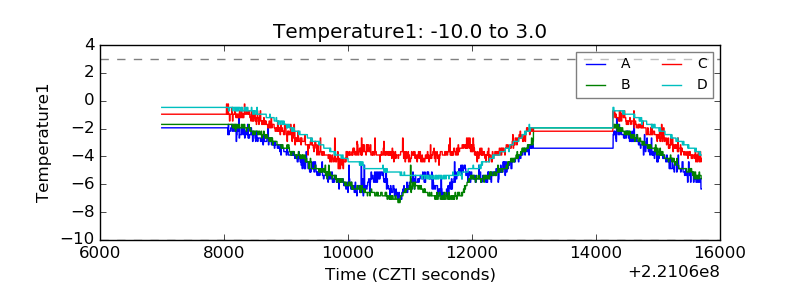 |
| Veto HV Monitor | 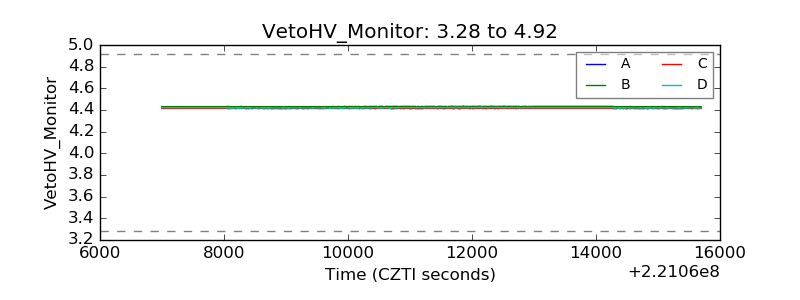 |
| Veto LLD | 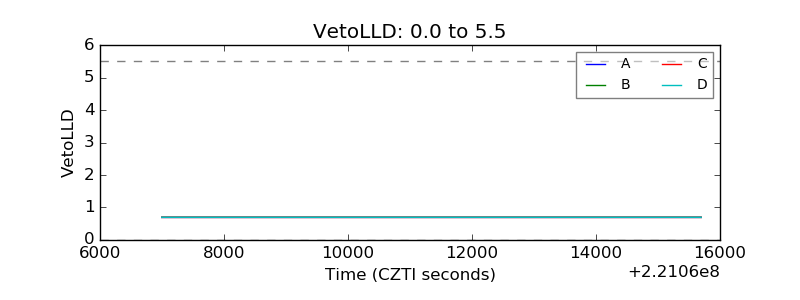 |
| Alpha Counter | 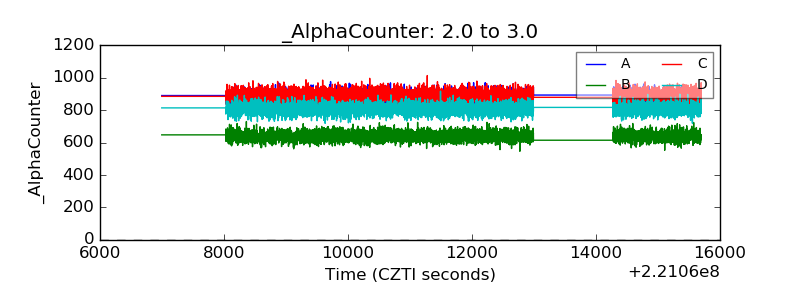 |
| _CPM_Rate | 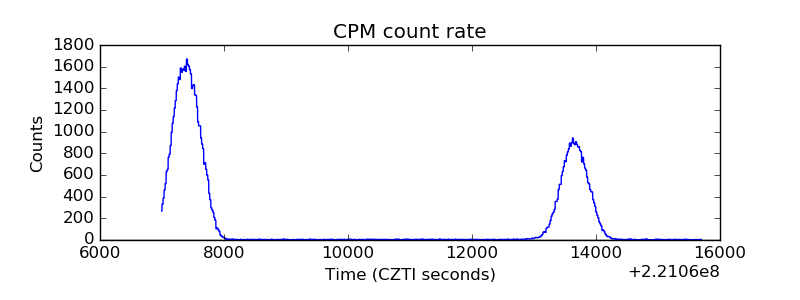 |
| CZT Counter | 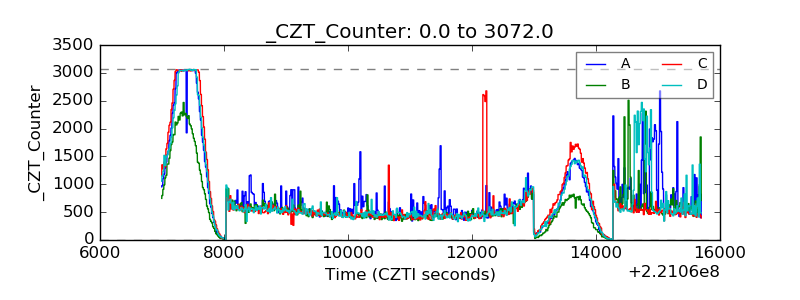 |
| +2.5 Volts monitor |  |
| +5 Volts monitor |  |
| _ROLL_ROT | 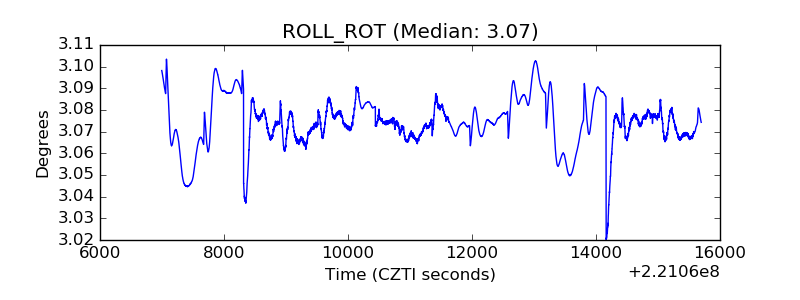 |
| _Roll_DEC |  |
| _Roll_RA | 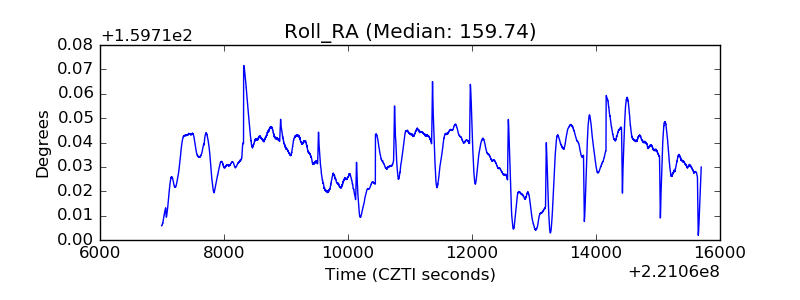 |
| Veto Counter | 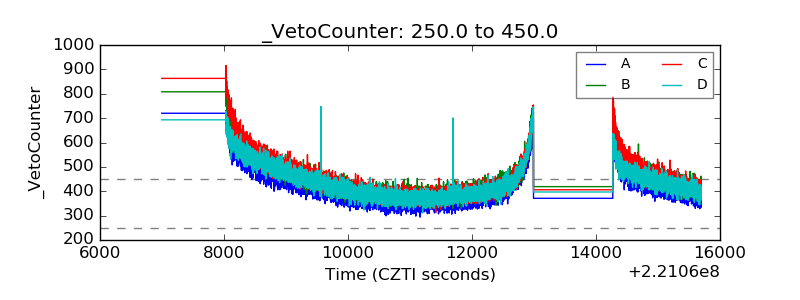 |