| Param | Original file | Final file |
|---|---|---|
| Filename | modeM0/AS1G06_135T03_9000000944cztM0_level2.fits | modeM0/AS1G06_135T03_9000000944cztM0_level2_quad_clean.evt |
| Size (bytes) | 145,071,360 | 128,520,000 |
| Size | 138.4 MB | 122.6 MB |
| Events in quadrant A | 864,850 | 725,949 |
| Events in quadrant B | 834,670 | 727,462 |
| Events in quadrant C | 856,808 | 695,289 |
| Events in quadrant D | 728,798 | 634,268 |
| Mode M9 | |||
|---|---|---|---|
| Quadrant | BADHDUFLAG | Total packets | Discarded packets |
| A | 0 | 6 | 0 |
| B | 0 | 6 | 0 |
| C | 0 | 6 | 0 |
| D | 0 | 6 | 0 |
| Mode M0 | |||
|---|---|---|---|
| Quadrant | BADHDUFLAG | Total packets | Discarded packets |
| A | 0 | 34784 | 0 |
| B | 0 | 34499 | 0 |
| C | 0 | 33969 | 0 |
| D | 0 | 38670 | 0 |
| Mode SS | |||
|---|---|---|---|
| Quadrant | BADHDUFLAG | Total packets | Discarded packets |
| A | 0 | 328 | 0 |
| B | 0 | 328 | 0 |
| C | 0 | 328 | 0 |
| D | 0 | 328 | 0 |
| Quadrant | Total seconds | Saturated seconds | Saturation percentage |
|---|---|---|---|
| A | 16067 | 155 | 0.964710% |
| B | 16067 | 287 | 1.786270% |
| C | 16067 | 146 | 0.908695% |
| D | 16067 | 465 | 2.894131% |
Noise dominated data is calculated using 1-second bins in cleaned event files. If a bin has >2000 counts, and if more than 50% of those come from <1% of pixels, then it is considered to be noise-dominated and hence unusable.
| Quadrant | # 1 sec bins | Bins with >0 counts | Bins with >2000 counts | High rate bins dominated by noise | Noise dominated (total time) | Noise dominated (detector-on time) | Marked lightcurve |
|---|---|---|---|---|---|---|---|
| A | 16767 | 16067 | 0 | 0 | 0.00% | 0.00% |  |
| B | 16767 | 16067 | 0 | 0 | 0.00% | 0.00% |  |
| C | 16767 | 16067 | 0 | 0 | 0.00% | 0.00% | 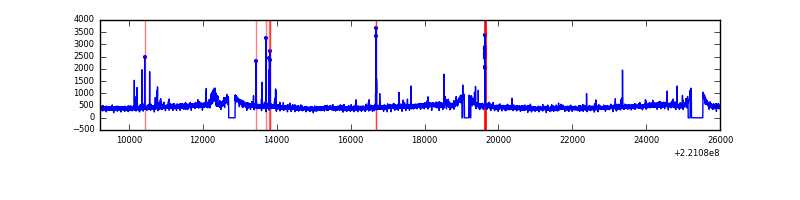 |
| D | 16767 | 16059 | 0 | 0 | 0.00% | 0.00% |  |
Top three noisy pixels from each quadrant. If the there are fewer than three noisy pixels in the level2.evt file, extra rows are filled as -1
| Pixel properties | Quadrant properties | ||||||
|---|---|---|---|---|---|---|---|
| Quadrant | DetID | PixID | Counts | Sigma | Mean | Median | Sigma |
| A | 14 | 188 | 845 | 10.59 | 224 | 209 | 60.0 |
| A | 0 | 29 | 841 | 10.53 | 224 | 209 | 60.0 |
| A | 7 | 110 | 730 | 8.68 | 224 | 209 | 60.0 |
| B | 2 | 9 | 776 | 12.04 | 220 | 209 | 47.1 |
| B | 12 | 226 | 580 | 7.88 | 220 | 209 | 47.1 |
| B | 2 | 8 | 569 | 7.65 | 220 | 209 | 47.1 |
| C | 1 | 81 | 635 | 6.91 | 226 | 208 | 61.8 |
| C | 12 | 241 | 621 | 6.68 | 226 | 208 | 61.8 |
| C | 1 | 80 | 617 | 6.61 | 226 | 208 | 61.8 |
| D | 3 | 14 | 580 | 6.77 | 208 | 188 | 57.9 |
| D | 4 | 246 | 576 | 6.7 | 208 | 188 | 57.9 |
| D | 11 | 82 | 555 | 6.34 | 208 | 188 | 57.9 |
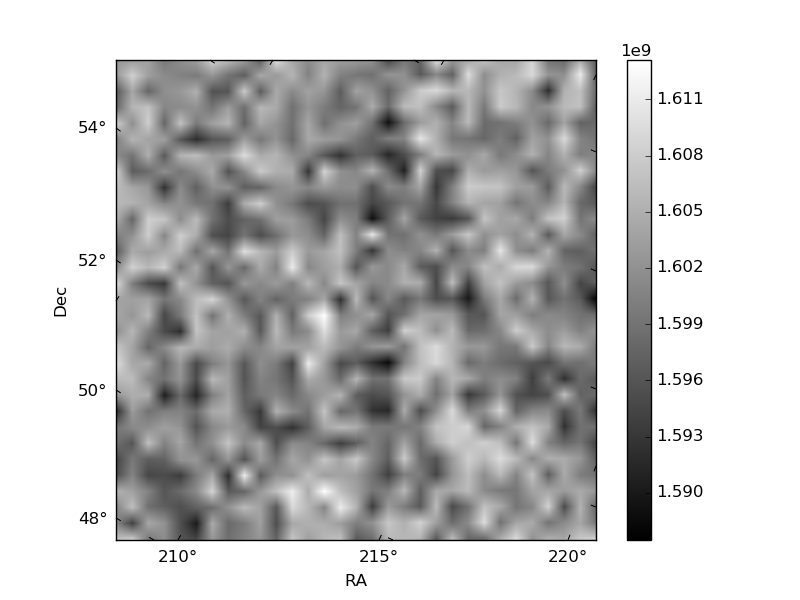
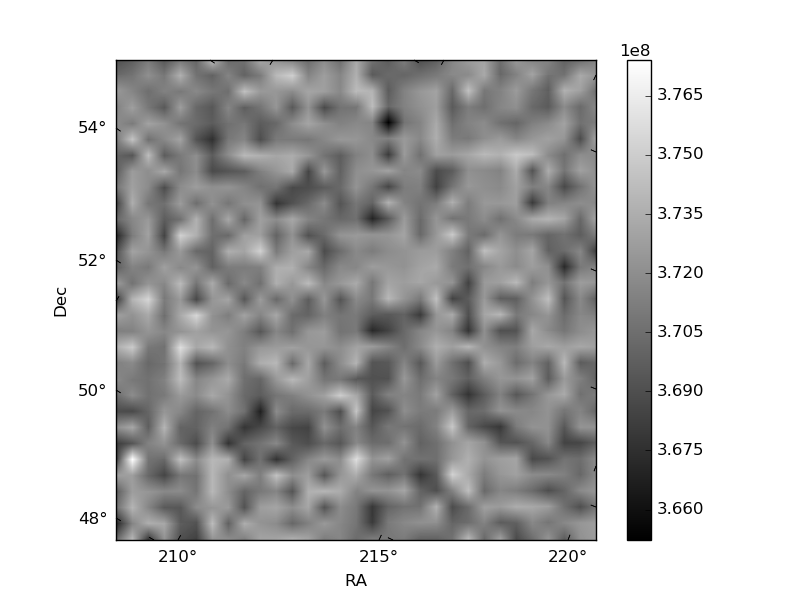
Histogram calculated using DETX and DETY for each event in the final _common_clean file
| Quadrant A | 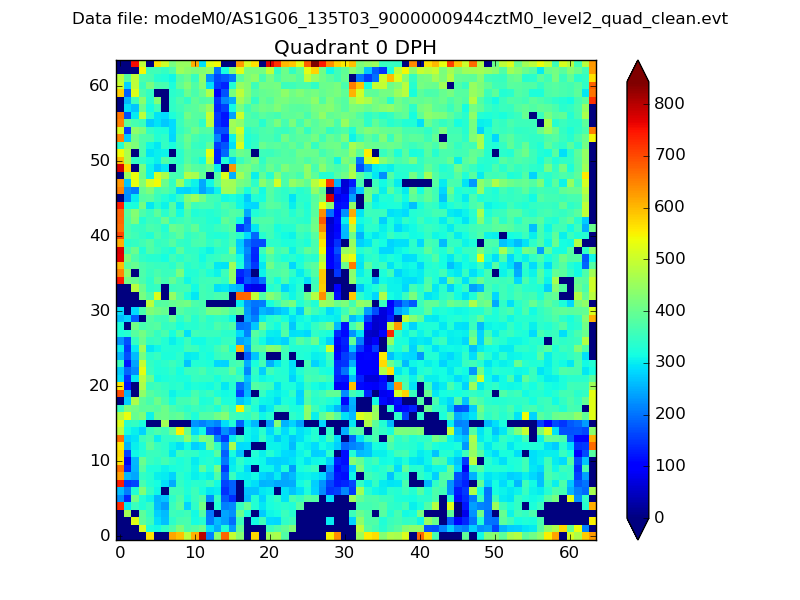 |
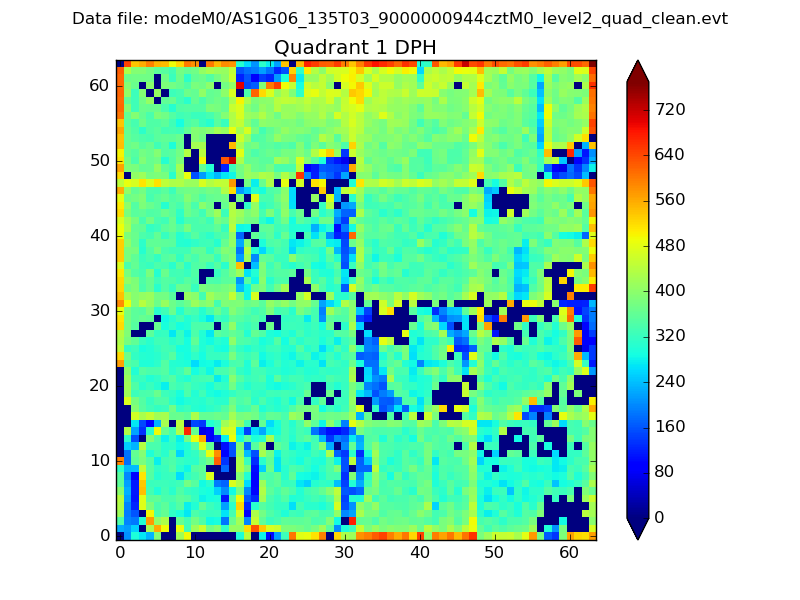 |
Quadrant B |
|---|---|---|---|
| Quadrant D |  |
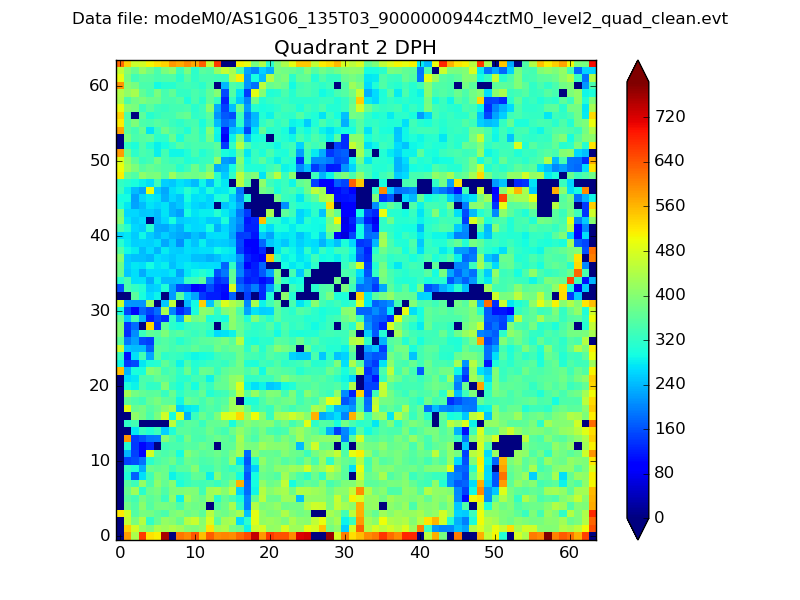 |
Quadrant C |
| Plot type | Count rate plots | Images |
|---|---|---|
| Comparison with Poisson distribution Blue bars denote a histogram of data divided into 1 sec bins. Red curve is a Poisson curve with rate = median count rate of data. |
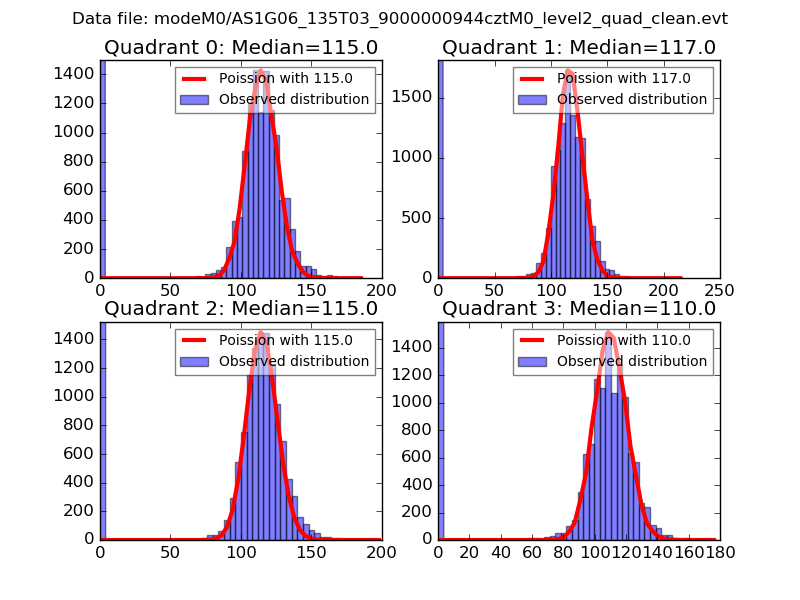 |
 |
| Quadrant-wise count rates Data is divided into 100 sec bins |
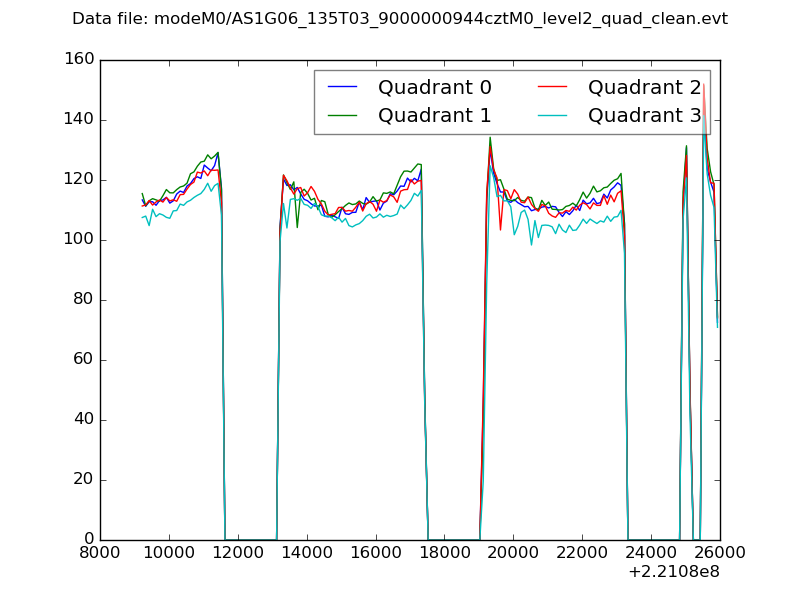 |
|
| Module-wise count rates for Quadrant A Data is divided into 100 sec bins |
 |
 |
| Module-wise count rates for Quadrant B Data is divided into 100 sec bins |
 |
 |
| Module-wise count rates for Quadrant C Data is divided into 100 sec bins |
 |
 |
| Module-wise count rates for Quadrant D Data is divided into 100 sec bins |
 |
 |
| Parameter | Plot |
|---|---|
| CZT HV Monitor |  |
| D_VDD | 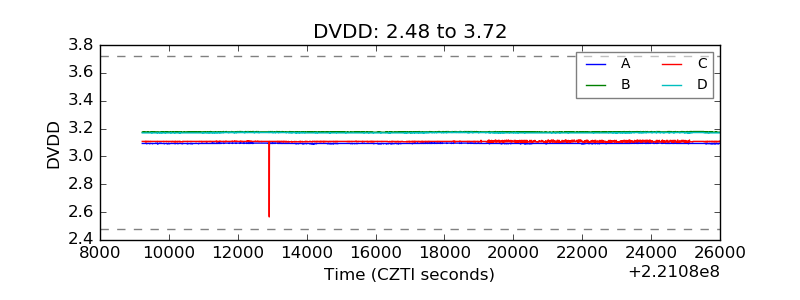 |
| Temperature 1 |  |
| Veto HV Monitor |  |
| Veto LLD | 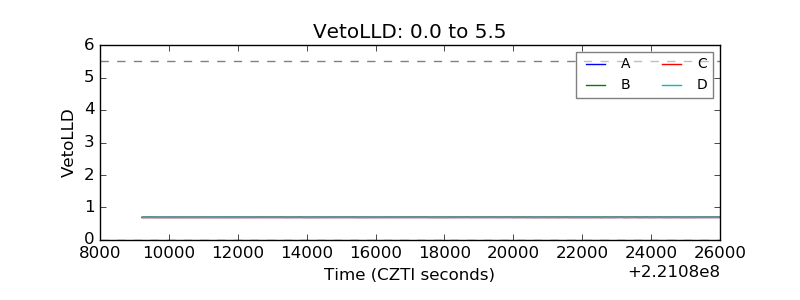 |
| Alpha Counter |  |
| _CPM_Rate |  |
| CZT Counter |  |
| +2.5 Volts monitor |  |
| +5 Volts monitor | 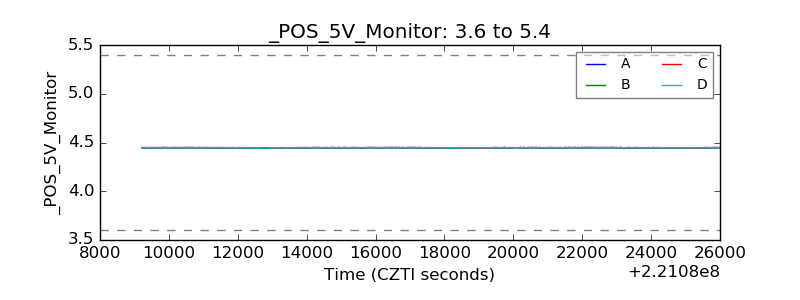 |
| _ROLL_ROT | 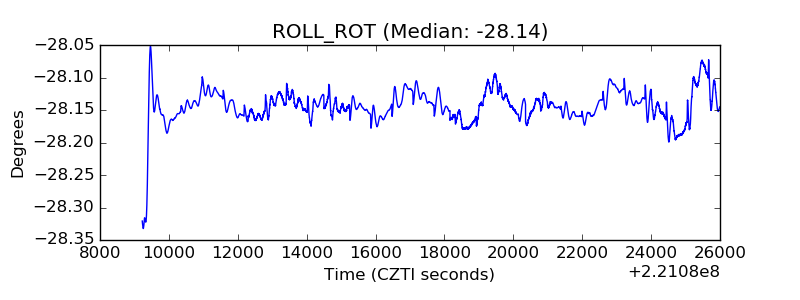 |
| _Roll_DEC |  |
| _Roll_RA | 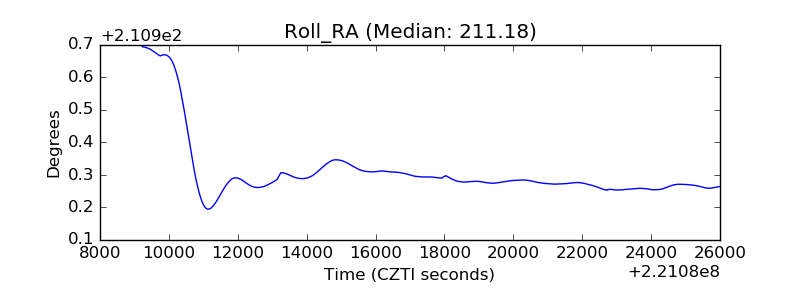 |
| Veto Counter | 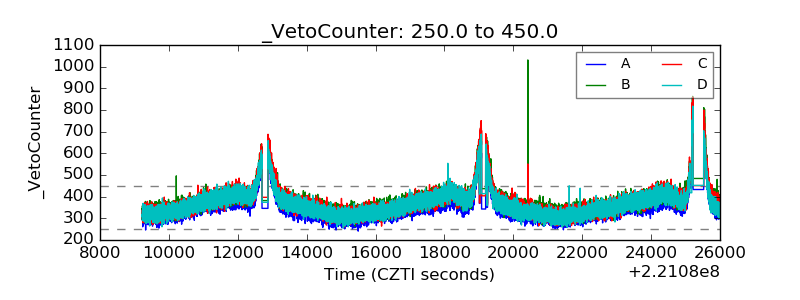 |