| Param | Original file | Final file |
|---|---|---|
| Filename | modeM0/AS1G06_135T03_9000000944_06850cztM0_level2.evt | modeM0/AS1G06_135T03_9000000944_06850cztM0_level2_quad_clean.evt |
| Size (bytes) | 359,075,520 | 68,034,240 |
| Size | 342.4 MB | 64.9 MB |
| Events in quadrant A | 2,639,863 | 428,438 |
| Events in quadrant B | 2,649,940 | 433,209 |
| Events in quadrant C | 2,502,946 | 428,367 |
| Events in quadrant D | 2,733,217 | 411,401 |
| Mode M9 | |||
|---|---|---|---|
| Quadrant | BADHDUFLAG | Total packets | Discarded packets |
| A | 0 | 1 | 0 |
| B | 0 | 1 | 0 |
| C | 0 | 1 | 0 |
| D | 0 | 1 | 0 |
| Mode M0 | |||
|---|---|---|---|
| Quadrant | BADHDUFLAG | Total packets | Discarded packets |
| A | 0 | 11288 | 2 |
| B | 0 | 11393 | 1 |
| C | 0 | 11056 | 1 |
| D | 0 | 11806 | 1 |
| Mode SS | |||
|---|---|---|---|
| Quadrant | BADHDUFLAG | Total packets | Discarded packets |
| A | 0 | 106 | 0 |
| B | 0 | 106 | 0 |
| C | 0 | 106 | 0 |
| D | 0 | 106 | 0 |
| Quadrant | Total seconds | Saturated seconds | Saturation percentage |
|---|---|---|---|
| A | 5112 | 50 | 0.978091% |
| B | 5112 | 121 | 2.366980% |
| C | 5112 | 41 | 0.802034% |
| D | 5112 | 172 | 3.364632% |
Noise dominated data is calculated using 1-second bins in cleaned event files. If a bin has >2000 counts, and if more than 50% of those come from <1% of pixels, then it is considered to be noise-dominated and hence unusable.
| Quadrant | # 1 sec bins | Bins with >0 counts | Bins with >2000 counts | High rate bins dominated by noise | Noise dominated (total time) | Noise dominated (detector-on time) | Marked lightcurve |
|---|---|---|---|---|---|---|---|
| A | 5287 | 5113 | 0 | 0 | 0.00% | 0.00% | 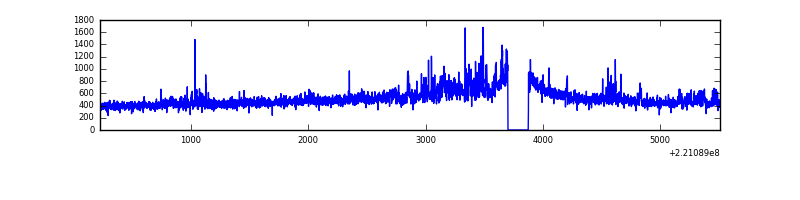 |
| B | 5287 | 5113 | 25 | 25 | 0.47% | 0.49% | 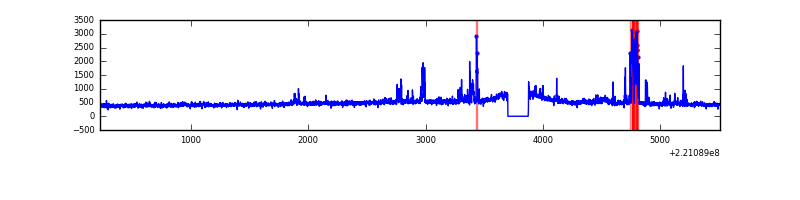 |
| C | 5287 | 5113 | 6 | 6 | 0.11% | 0.12% | 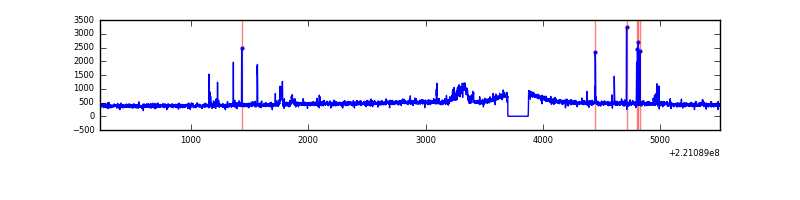 |
| D | 5287 | 5113 | 97 | 97 | 1.83% | 1.90% | 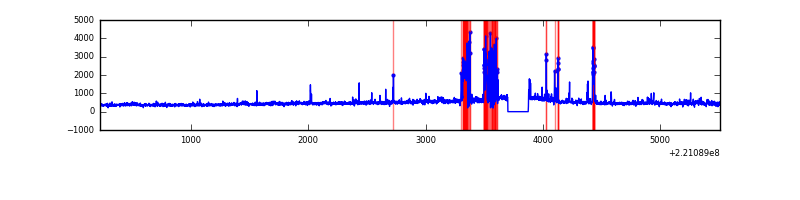 |
Top three noisy pixels from each quadrant. If the there are fewer than three noisy pixels in the level2.evt file, extra rows are filled as -1
| Pixel properties | Quadrant properties | ||||||
|---|---|---|---|---|---|---|---|
| Quadrant | DetID | PixID | Counts | Sigma | Mean | Median | Sigma |
| A | 8 | 15 | 233196 | 1894.15 | 605 | 590 | 122.8 |
| A | 15 | 239 | 74095 | 598.56 | 605 | 590 | 122.8 |
| A | 0 | 226 | 5858 | 42.89 | 605 | 590 | 122.8 |
| B | 0 | 228 | 231089 | 1987.34 | 609 | 592 | 116.0 |
| B | 15 | 204 | 16667 | 138.6 | 609 | 592 | 116.0 |
| B | 0 | 219 | 11678 | 95.58 | 609 | 592 | 116.0 |
| C | 10 | 22 | 158979 | 1154.12 | 589 | 591 | 137.2 |
| C | 9 | 247 | 20589 | 145.72 | 589 | 591 | 137.2 |
| C | 9 | 68 | 18872 | 133.21 | 589 | 591 | 137.2 |
| D | 2 | 33 | 343528 | 2387.9 | 579 | 558 | 143.6 |
| D | 8 | 195 | 137585 | 954.04 | 579 | 558 | 143.6 |
| D | 2 | 14 | 20466 | 138.61 | 579 | 558 | 143.6 |
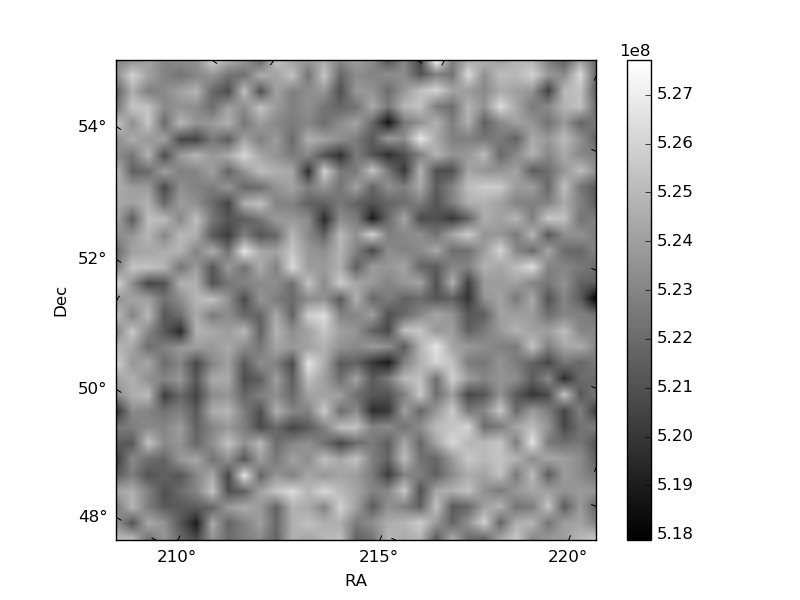
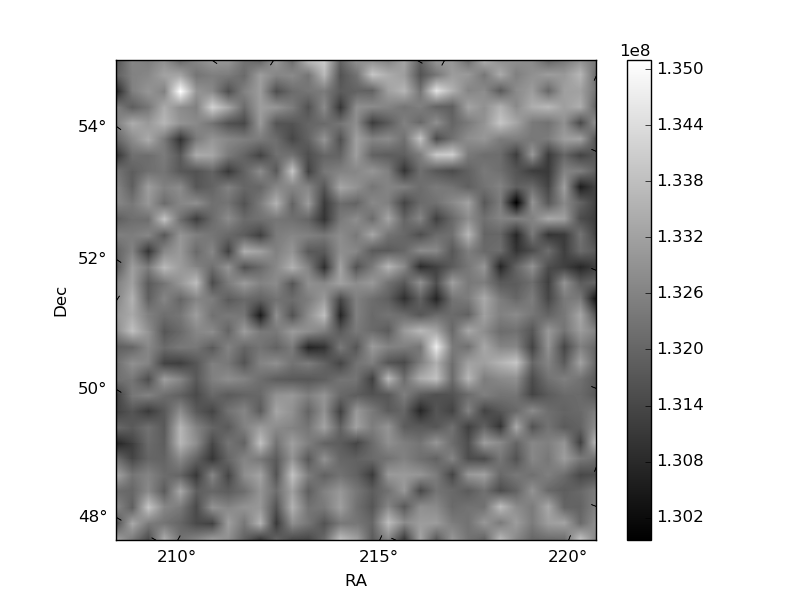
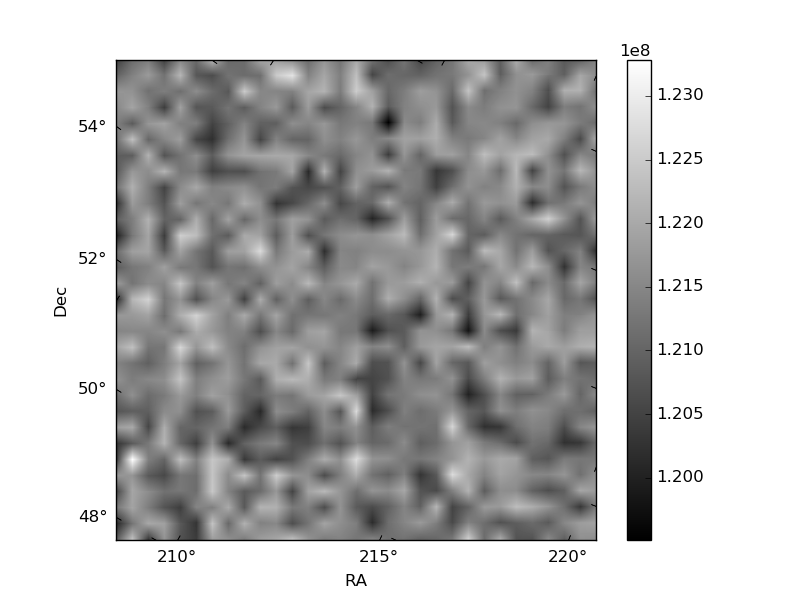
Histogram calculated using DETX and DETY for each event in the final _common_clean file
| Quadrant A | 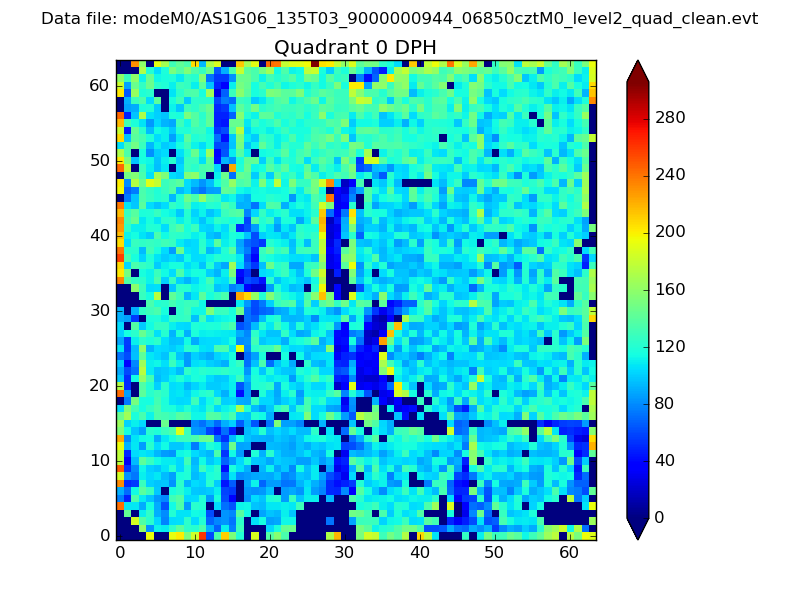 |
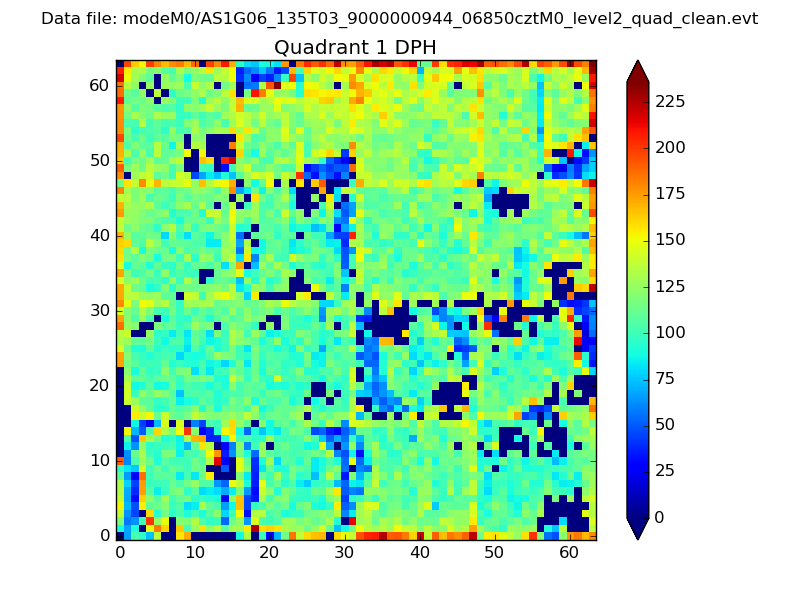 |
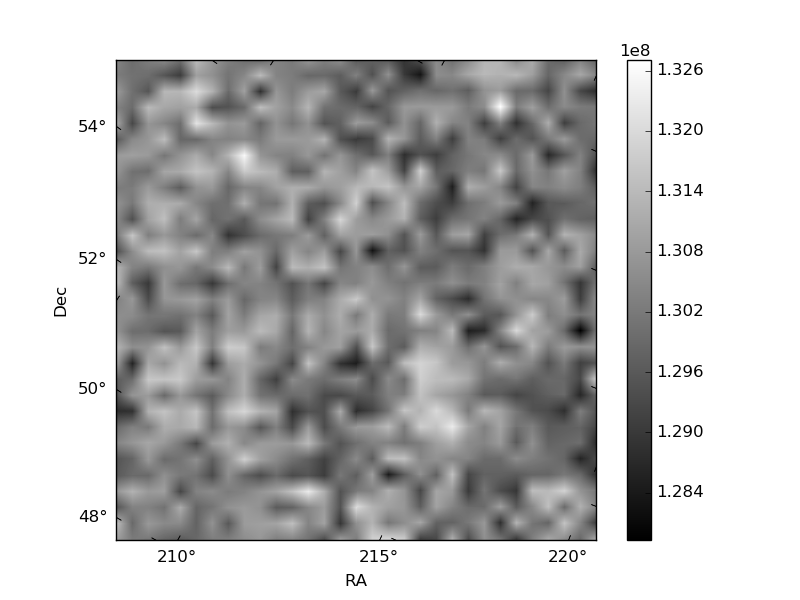
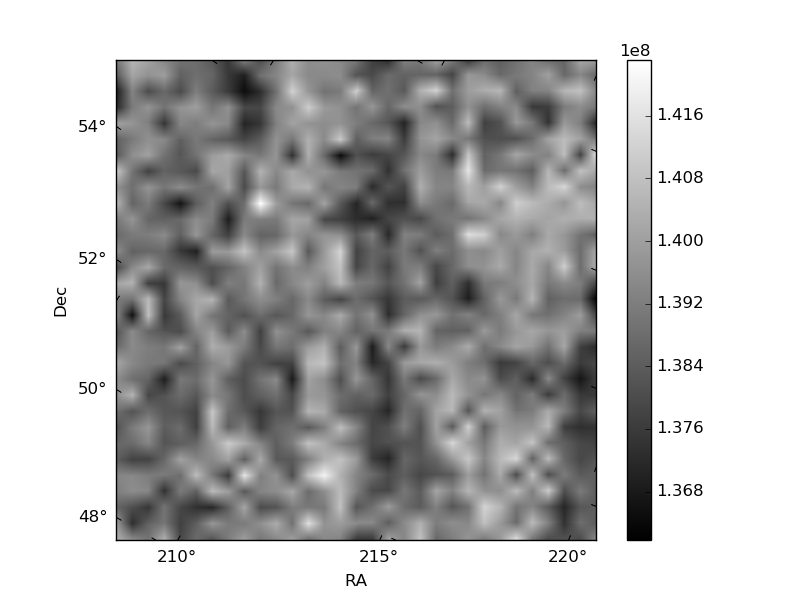
Quadrant B |
|---|---|---|---|
| Quadrant D | 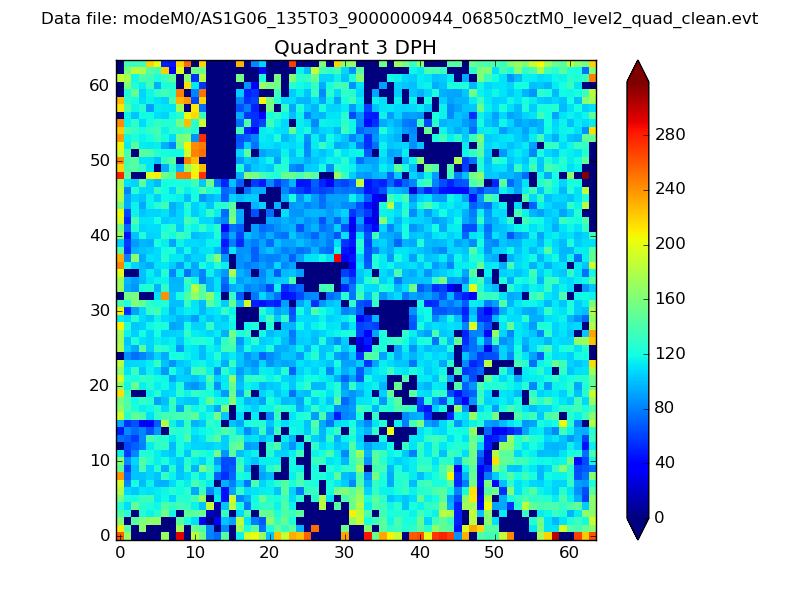 |
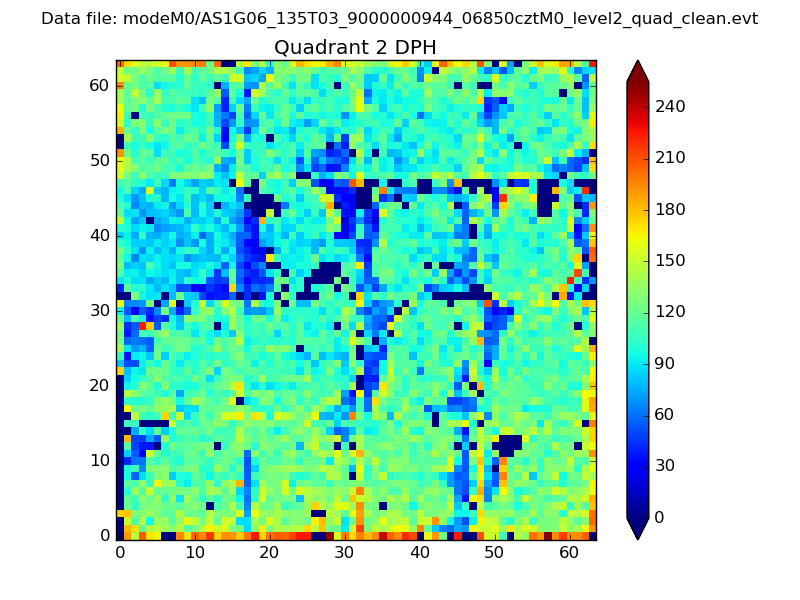 |
Quadrant C |
| Plot type | Count rate plots | Images |
|---|---|---|
| Comparison with Poisson distribution Blue bars denote a histogram of data divided into 1 sec bins. Red curve is a Poisson curve with rate = median count rate of data. |
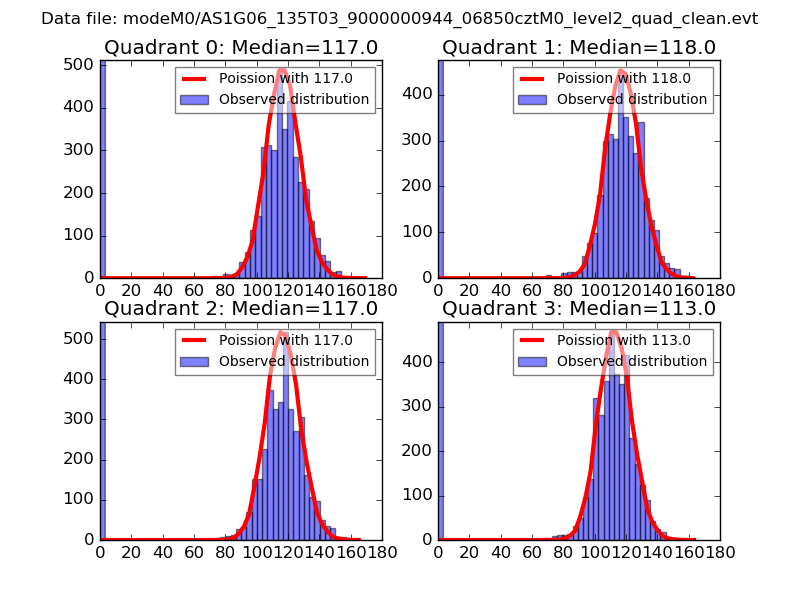 |
 |
| Quadrant-wise count rates Data is divided into 100 sec bins |
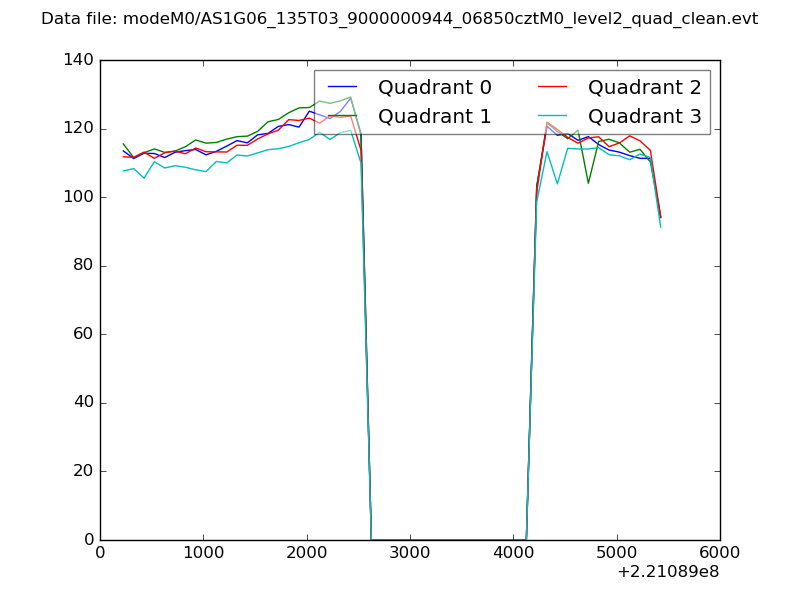 |
|
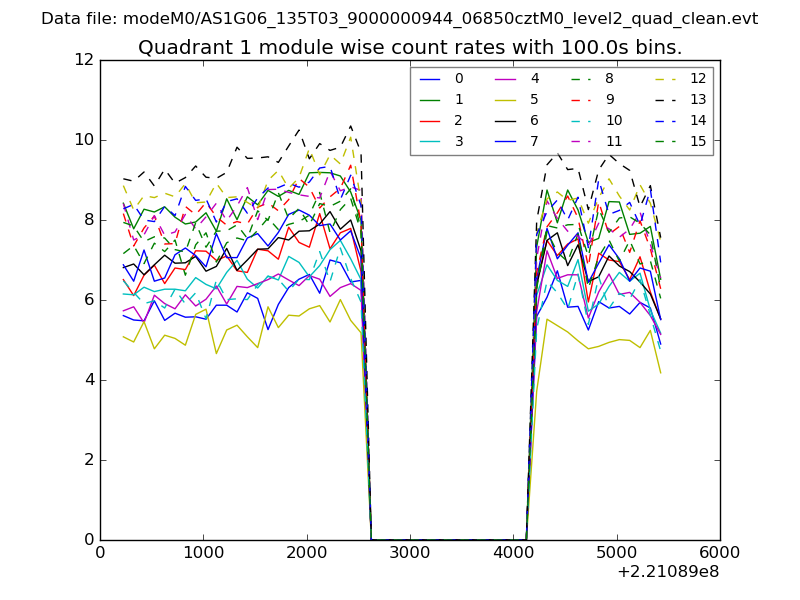
| Module-wise count rates for Quadrant A Data is divided into 100 sec bins |
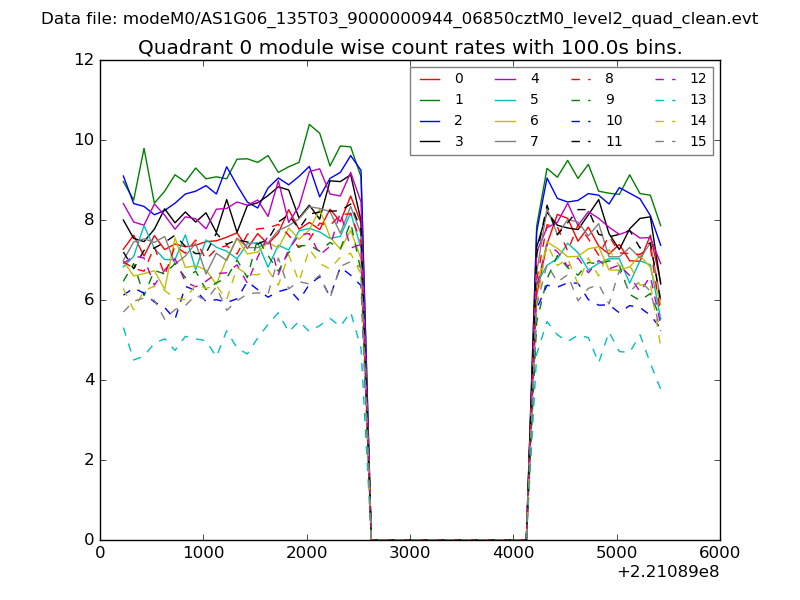 |
 |
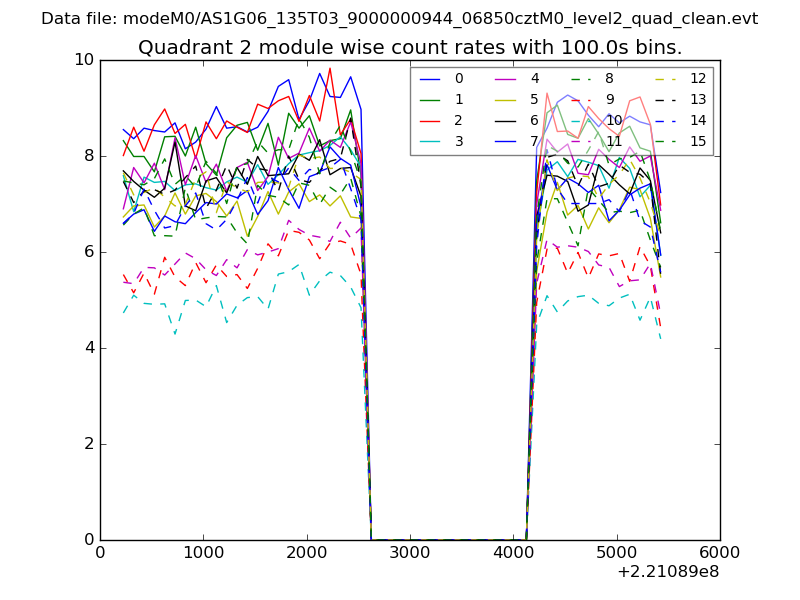
| Module-wise count rates for Quadrant B Data is divided into 100 sec bins |
 |
 |
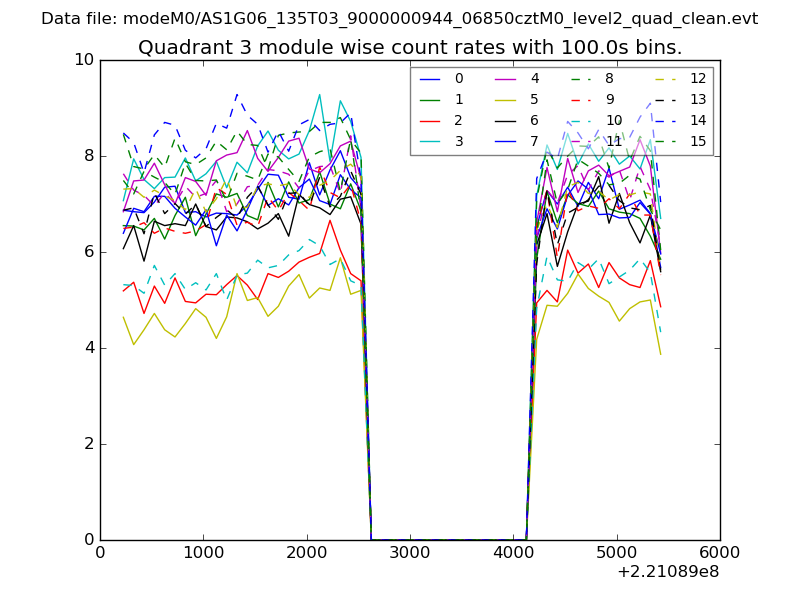
| Module-wise count rates for Quadrant C Data is divided into 100 sec bins |
 |
 |
| Module-wise count rates for Quadrant D Data is divided into 100 sec bins |
 |
 |
| Parameter | Plot |
|---|---|
| CZT HV Monitor | 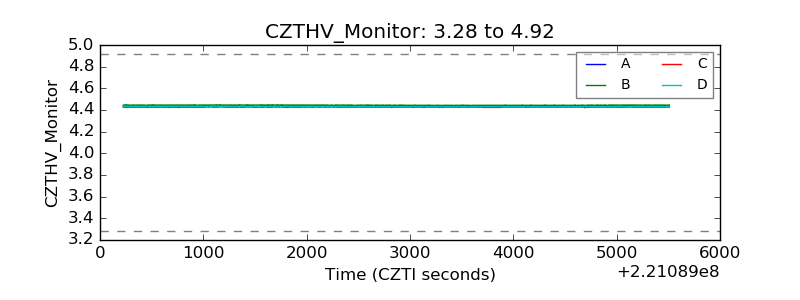 |
| D_VDD | 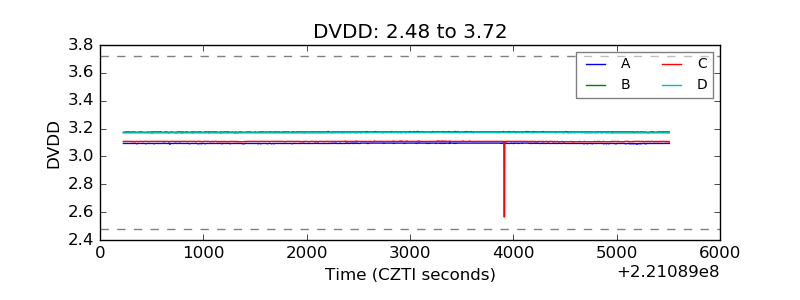 |
| Temperature 1 | 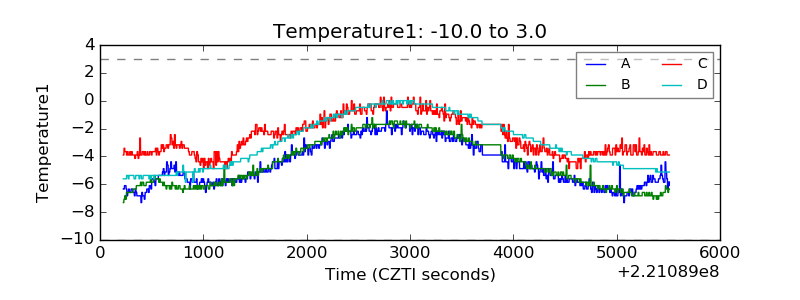 |
| Veto HV Monitor | 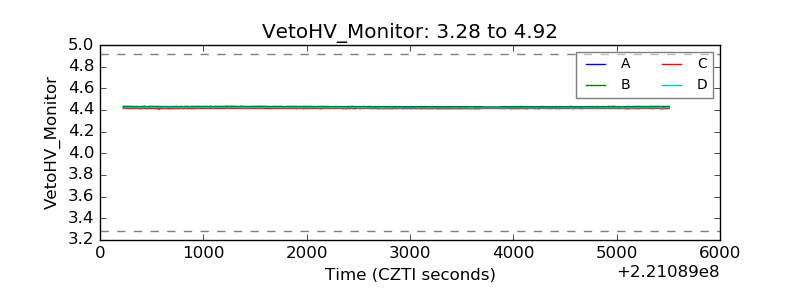 |
| Veto LLD | 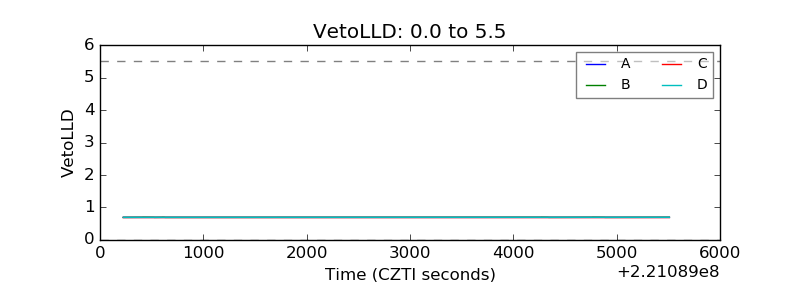 |
| Alpha Counter | 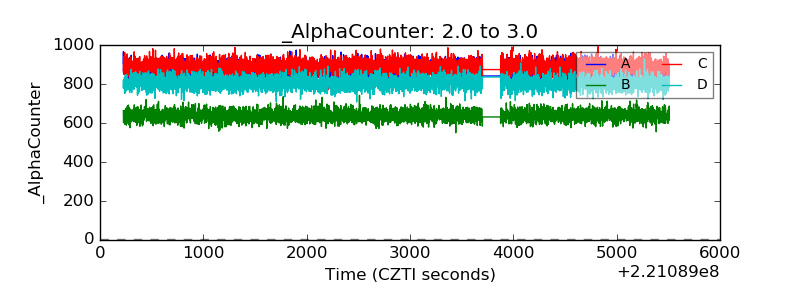 |
| _CPM_Rate | 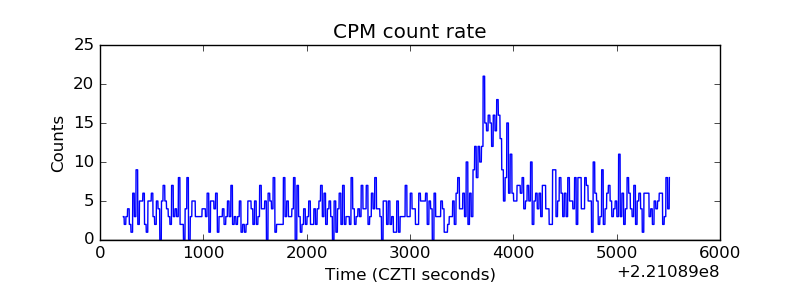 |
| CZT Counter | 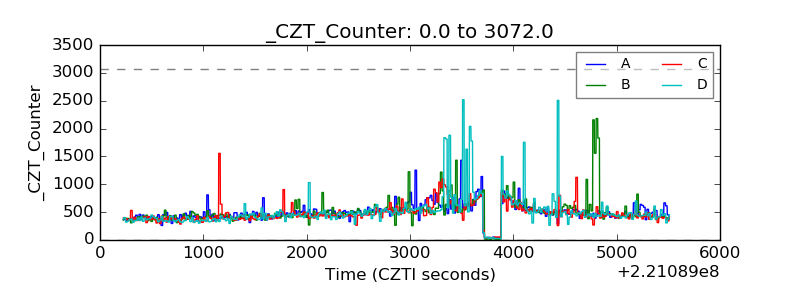 |
| +2.5 Volts monitor |  |
| +5 Volts monitor |  |
| _ROLL_ROT | 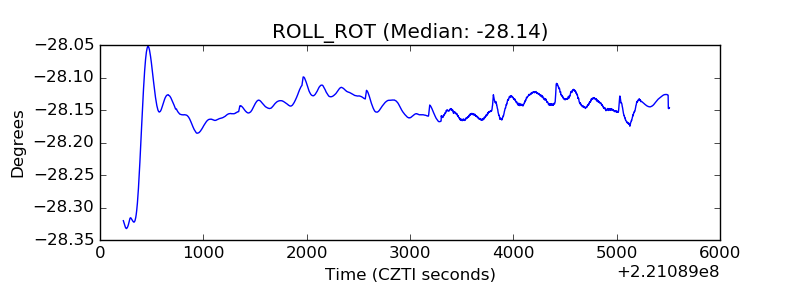 |
| _Roll_DEC | 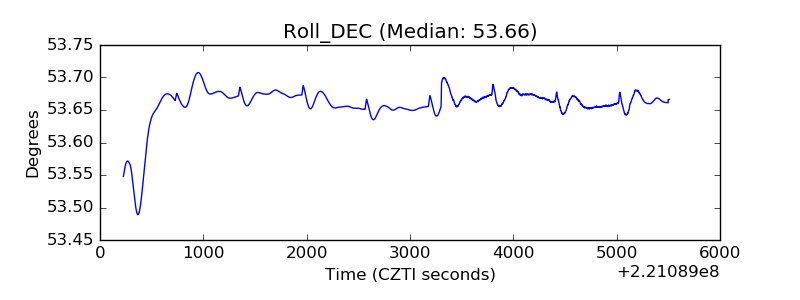 |
| _Roll_RA | 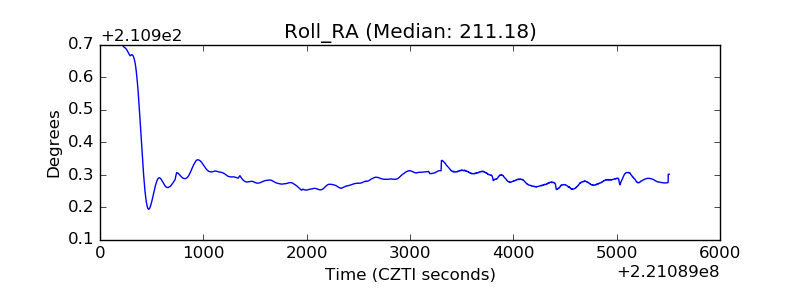 |
| Veto Counter | 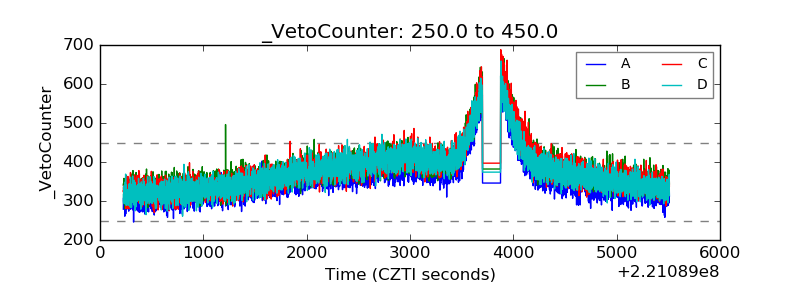 |