| Param | Original file | Final file |
|---|---|---|
| Filename | modeM0/AS1G06_135T03_9000000944_06851cztM0_level2.evt | modeM0/AS1G06_135T03_9000000944_06851cztM0_level2_quad_clean.evt |
| Size (bytes) | 582,819,840 | 108,633,600 |
| Size | 555.8 MB | 103.6 MB |
| Events in quadrant A | 4,214,593 | 684,970 |
| Events in quadrant B | 4,135,268 | 693,268 |
| Events in quadrant C | 3,917,327 | 688,119 |
| Events in quadrant D | 4,826,050 | 652,808 |
| Mode M9 | |||
|---|---|---|---|
| Quadrant | BADHDUFLAG | Total packets | Discarded packets |
| A | 0 | 3 | 0 |
| B | 0 | 3 | 0 |
| C | 0 | 3 | 0 |
| D | 0 | 3 | 0 |
| Mode M0 | |||
|---|---|---|---|
| Quadrant | BADHDUFLAG | Total packets | Discarded packets |
| A | 0 | 18234 | 3 |
| B | 0 | 18095 | 2 |
| C | 0 | 17552 | 2 |
| D | 0 | 20257 | 2 |
| Mode SS | |||
|---|---|---|---|
| Quadrant | BADHDUFLAG | Total packets | Discarded packets |
| A | 0 | 168 | 0 |
| B | 0 | 168 | 0 |
| C | 0 | 168 | 0 |
| D | 0 | 168 | 0 |
| Quadrant | Total seconds | Saturated seconds | Saturation percentage |
|---|---|---|---|
| A | 8214 | 87 | 1.059167% |
| B | 8214 | 204 | 2.483565% |
| C | 8214 | 97 | 1.180911% |
| D | 8214 | 320 | 3.895788% |
Noise dominated data is calculated using 1-second bins in cleaned event files. If a bin has >2000 counts, and if more than 50% of those come from <1% of pixels, then it is considered to be noise-dominated and hence unusable.
| Quadrant | # 1 sec bins | Bins with >0 counts | Bins with >2000 counts | High rate bins dominated by noise | Noise dominated (total time) | Noise dominated (detector-on time) | Marked lightcurve |
|---|---|---|---|---|---|---|---|
| A | 8549 | 8218 | 1 | 1 | 0.01% | 0.01% | 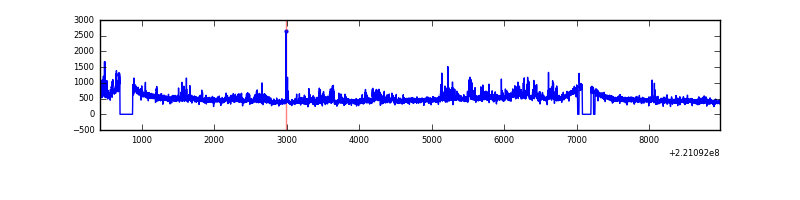 |
| B | 8549 | 8218 | 29 | 29 | 0.34% | 0.35% | 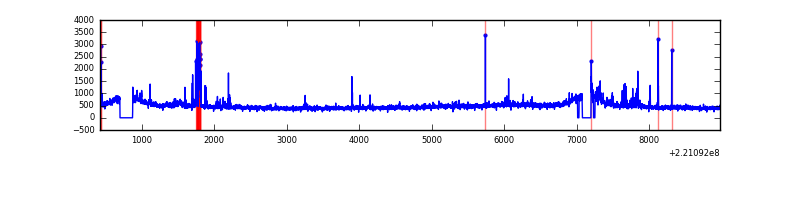 |
| C | 8549 | 8218 | 24 | 24 | 0.28% | 0.29% | 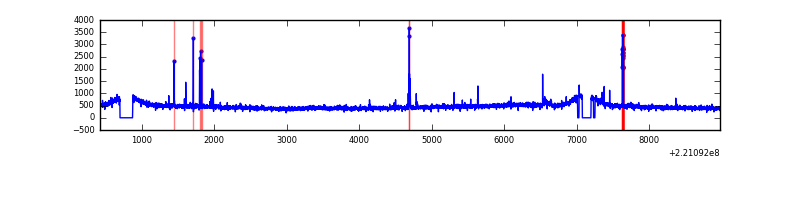 |
| D | 8549 | 8218 | 165 | 165 | 1.93% | 2.01% | 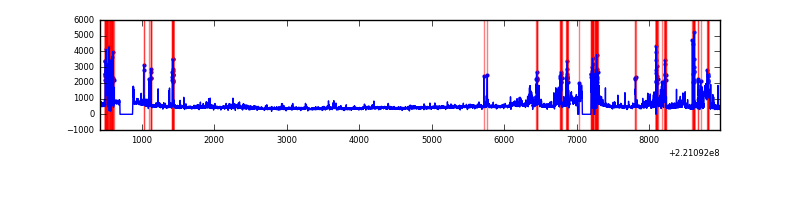 |
Top three noisy pixels from each quadrant. If the there are fewer than three noisy pixels in the level2.evt file, extra rows are filled as -1
| Pixel properties | Quadrant properties | ||||||
|---|---|---|---|---|---|---|---|
| Quadrant | DetID | PixID | Counts | Sigma | Mean | Median | Sigma |
| A | 8 | 15 | 385333 | 1961.26 | 960 | 938 | 196.0 |
| A | 15 | 239 | 104343 | 527.59 | 960 | 938 | 196.0 |
| A | 13 | 251 | 15771 | 75.68 | 960 | 938 | 196.0 |
| B | 0 | 228 | 258618 | 1398.04 | 970 | 944 | 184.3 |
| B | 15 | 204 | 32722 | 172.42 | 970 | 944 | 184.3 |
| B | 0 | 219 | 29276 | 153.72 | 970 | 944 | 184.3 |
| C | 10 | 22 | 146569 | 665.26 | 942 | 947 | 218.9 |
| C | 9 | 247 | 70417 | 317.37 | 942 | 947 | 218.9 |
| C | 13 | 61 | 7638 | 30.57 | 942 | 947 | 218.9 |
| D | 2 | 33 | 544943 | 2414.91 | 919 | 886 | 225.3 |
| D | 2 | 216 | 282941 | 1251.96 | 919 | 886 | 225.3 |
| D | 14 | 34 | 163291 | 720.87 | 919 | 886 | 225.3 |
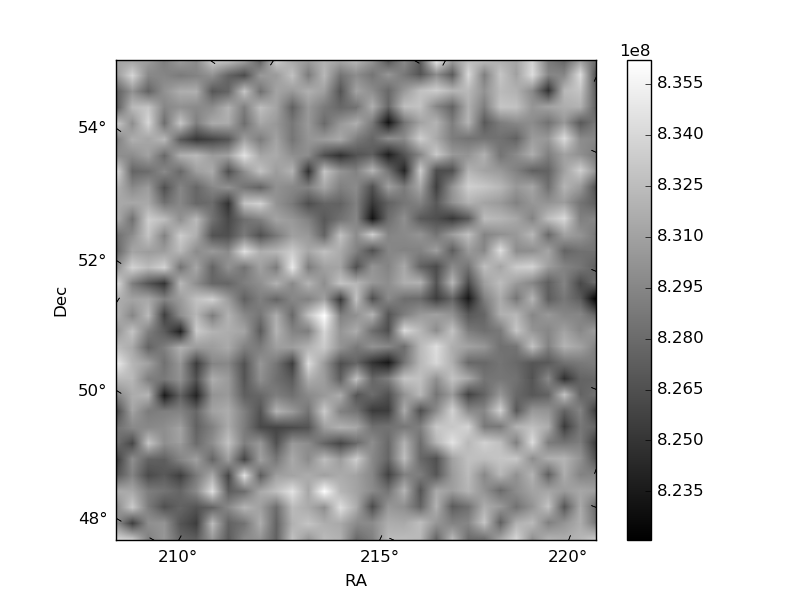
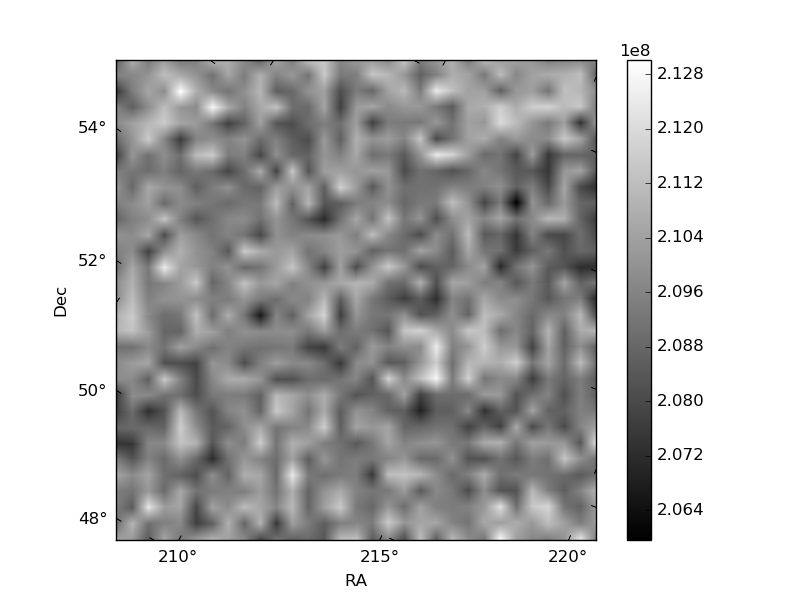
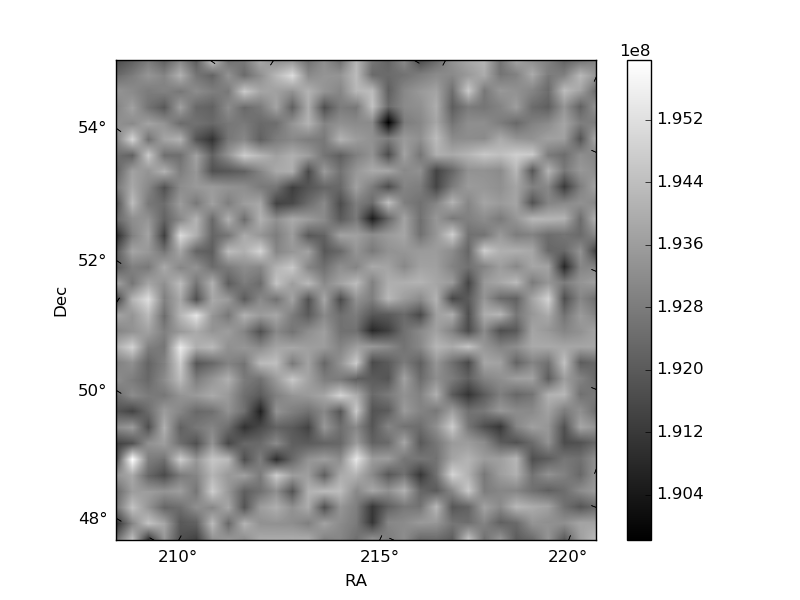
Histogram calculated using DETX and DETY for each event in the final _common_clean file
| Quadrant A | 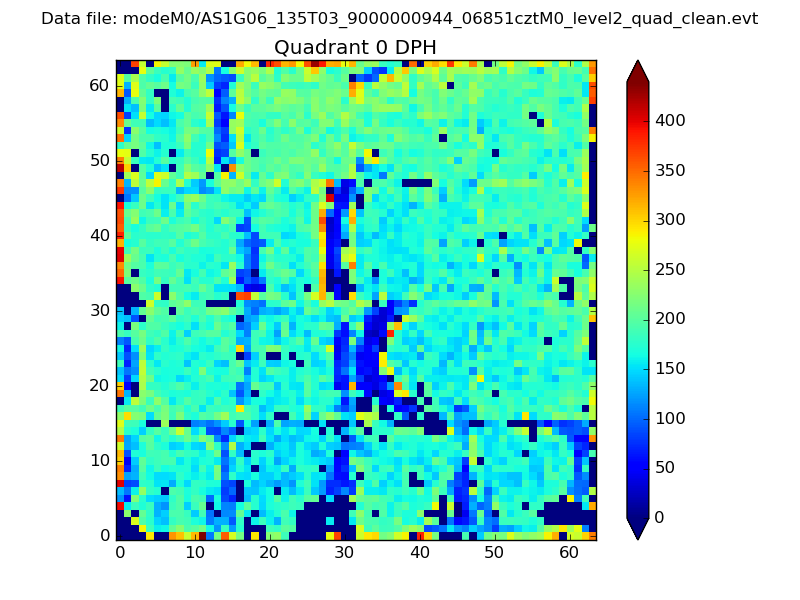 |
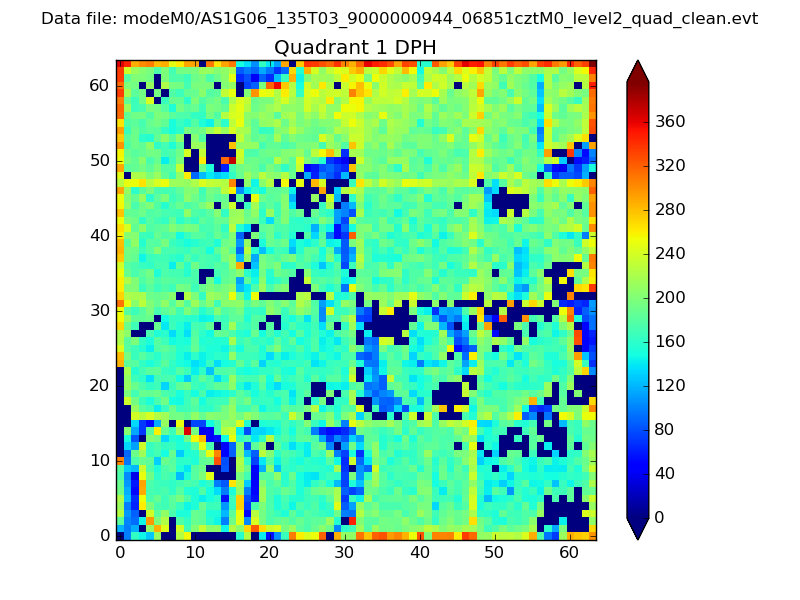 |
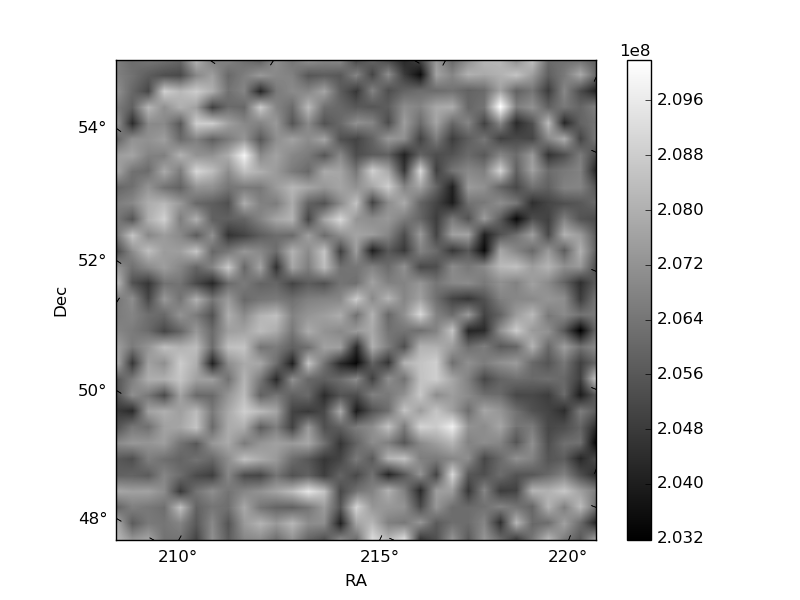
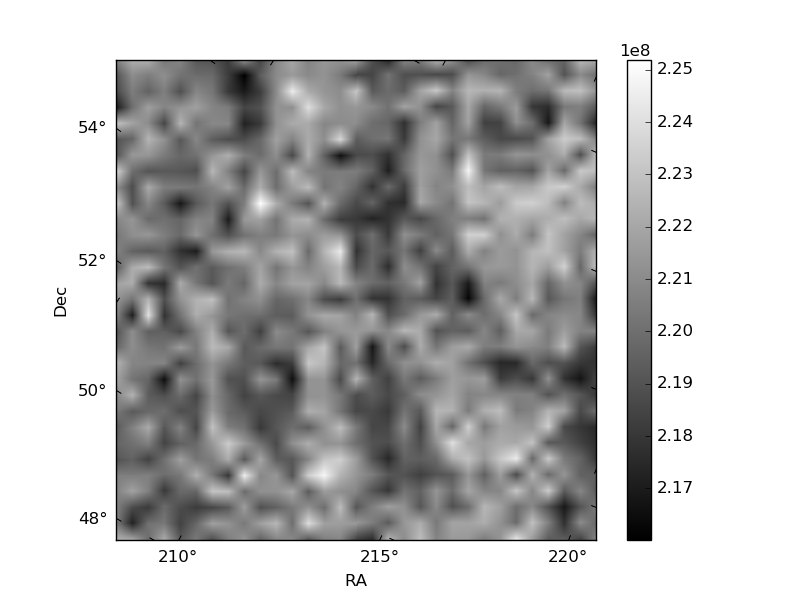
Quadrant B |
|---|---|---|---|
| Quadrant D | 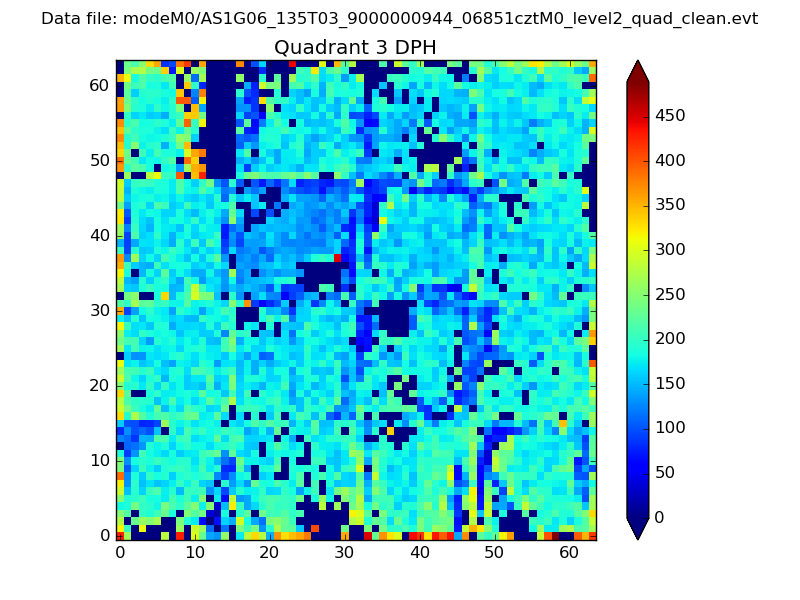 |
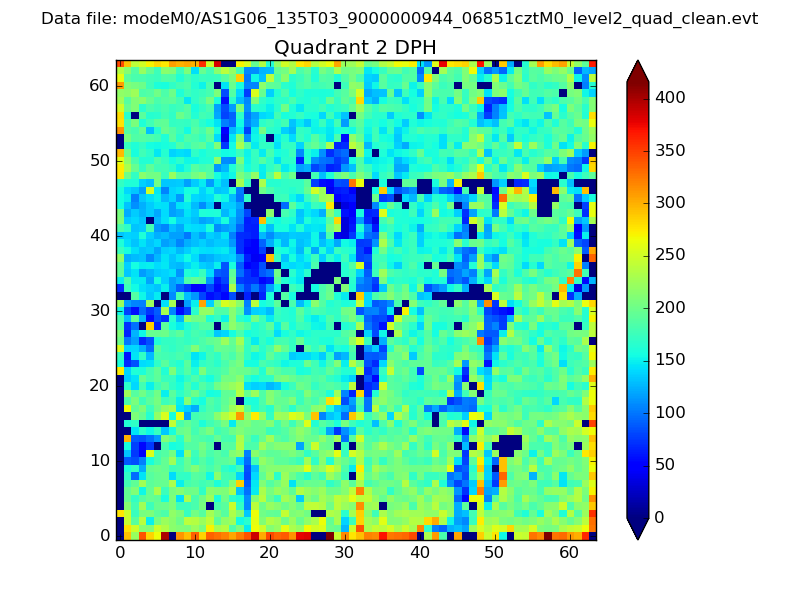 |
Quadrant C |
| Plot type | Count rate plots | Images |
|---|---|---|
| Comparison with Poisson distribution Blue bars denote a histogram of data divided into 1 sec bins. Red curve is a Poisson curve with rate = median count rate of data. |
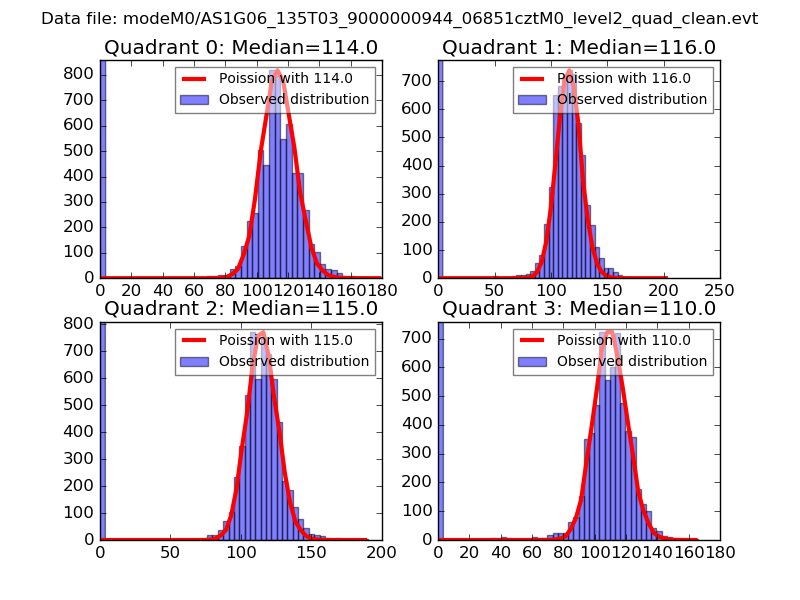 |
 |
| Quadrant-wise count rates Data is divided into 100 sec bins |
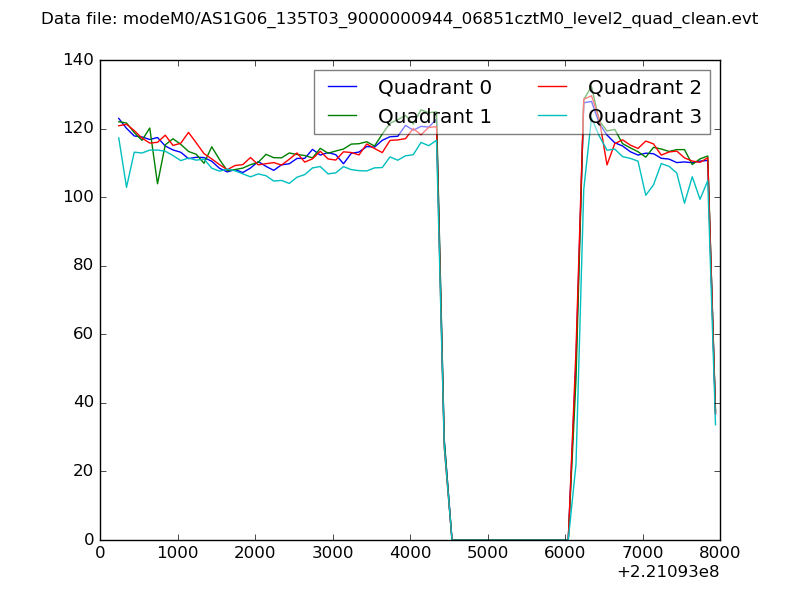 |
|
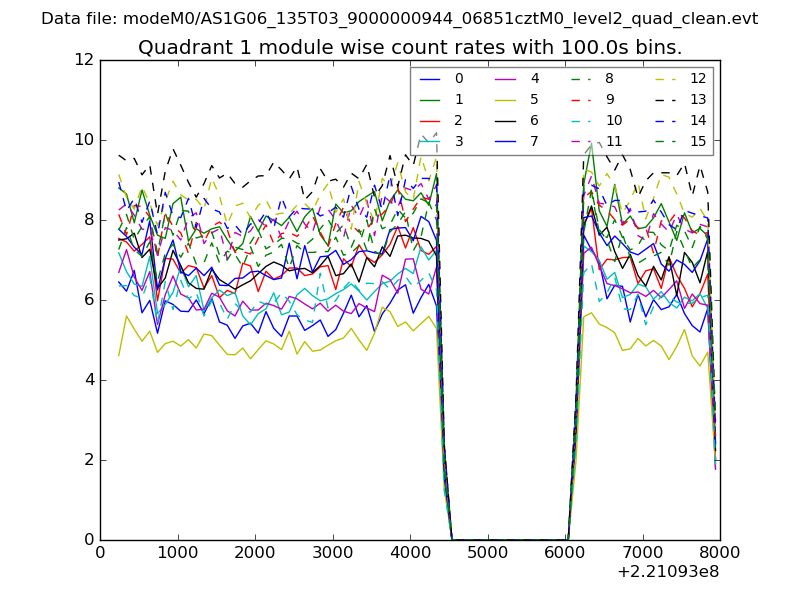
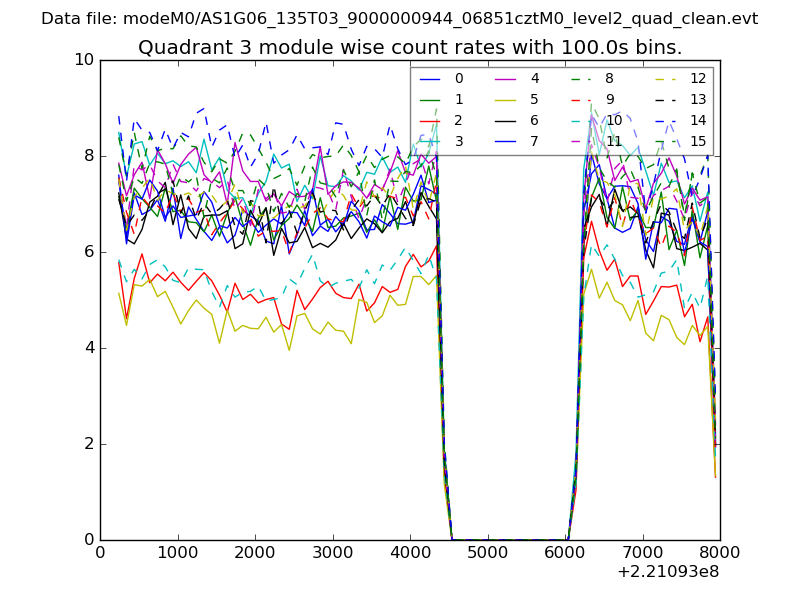
| Module-wise count rates for Quadrant A Data is divided into 100 sec bins |
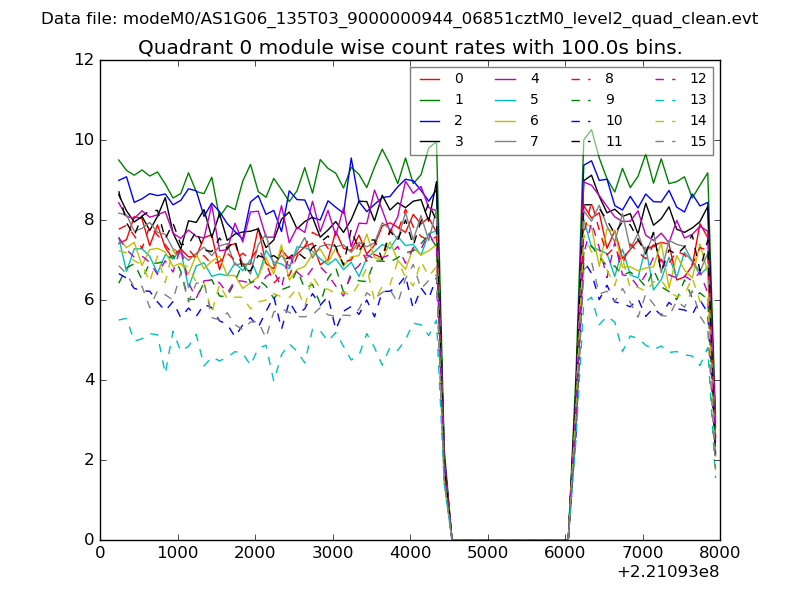 |
 |
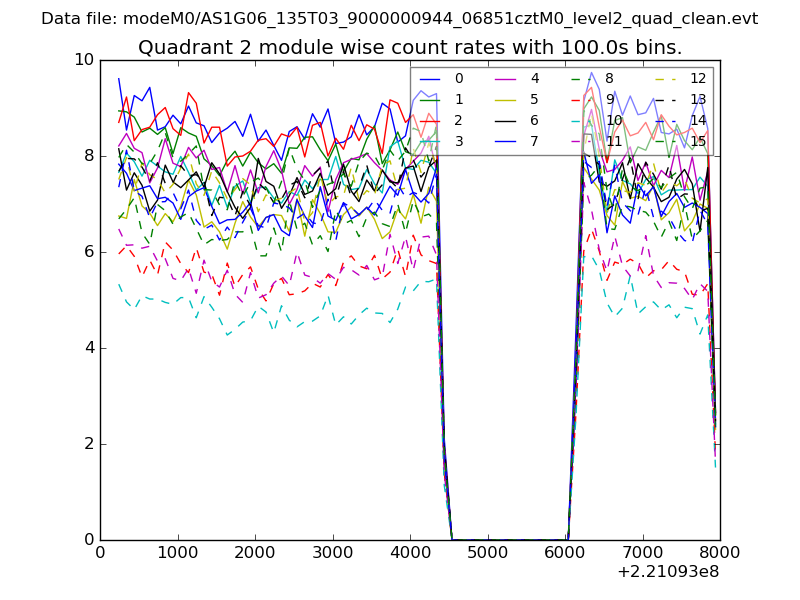
| Module-wise count rates for Quadrant B Data is divided into 100 sec bins |
 |
 |
| Module-wise count rates for Quadrant C Data is divided into 100 sec bins |
 |
 |
| Module-wise count rates for Quadrant D Data is divided into 100 sec bins |
 |
 |
| Parameter | Plot |
|---|---|
| CZT HV Monitor | 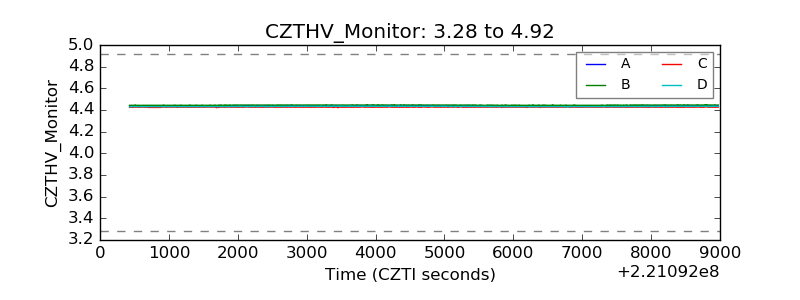 |
| D_VDD | 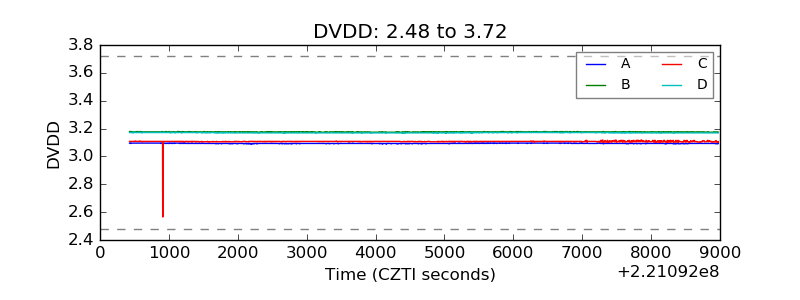 |
| Temperature 1 | 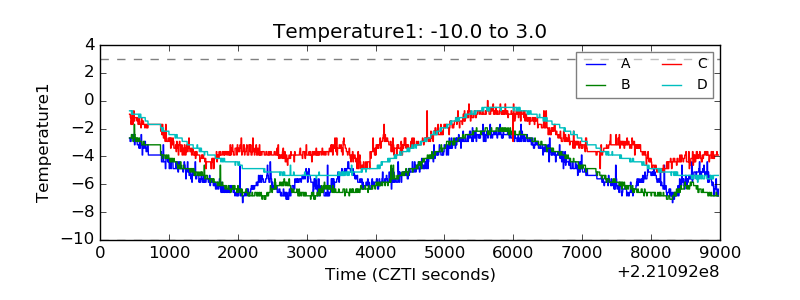 |
| Veto HV Monitor | 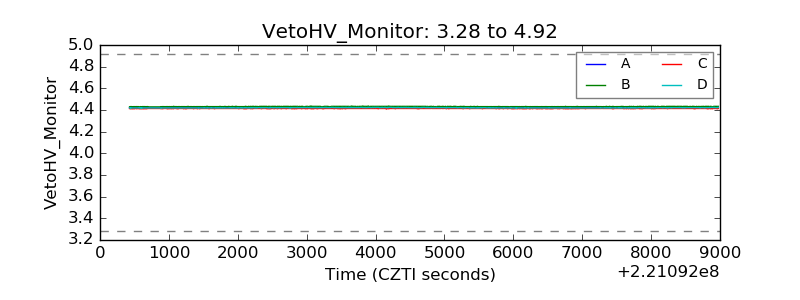 |
| Veto LLD | 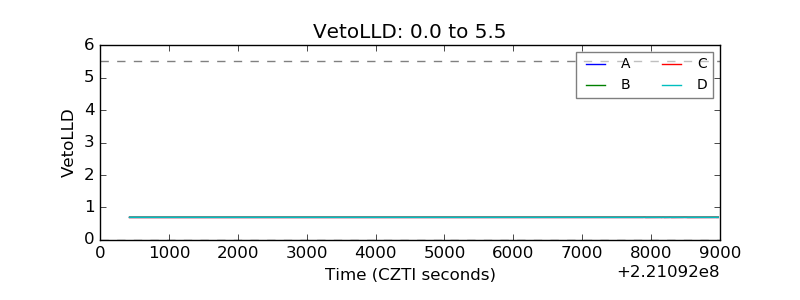 |
| Alpha Counter | 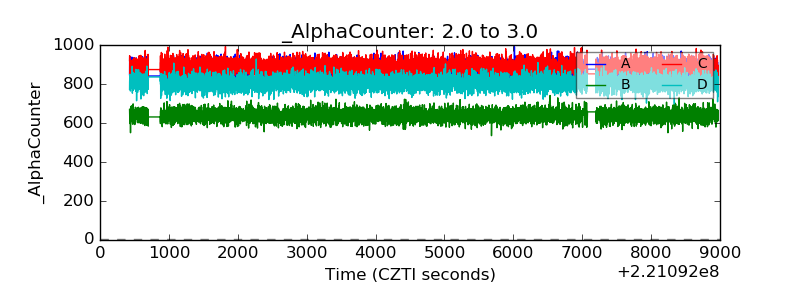 |
| _CPM_Rate | 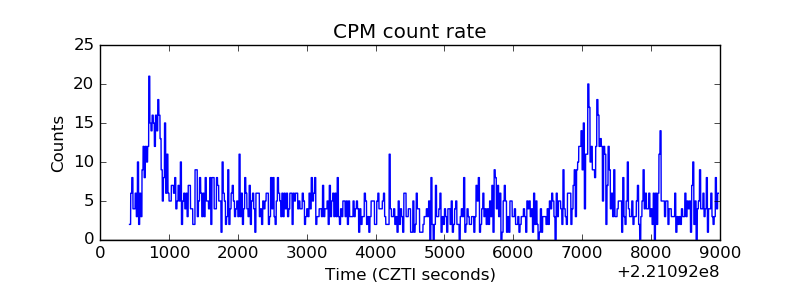 |
| CZT Counter | 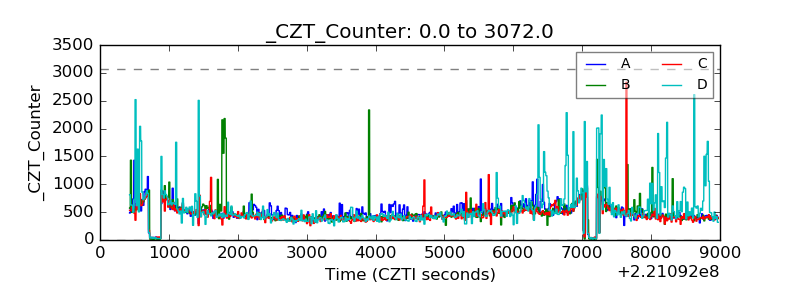 |
| +2.5 Volts monitor |  |
| +5 Volts monitor |  |
| _ROLL_ROT | 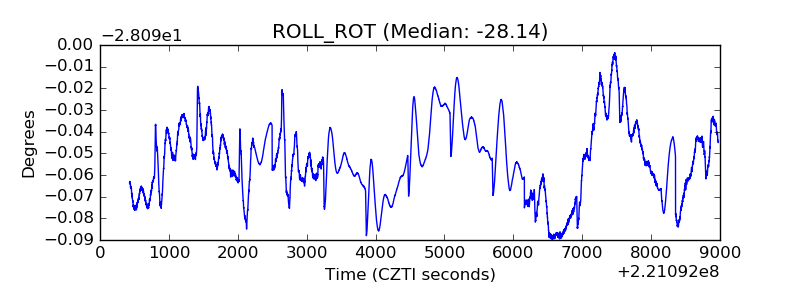 |
| _Roll_DEC | 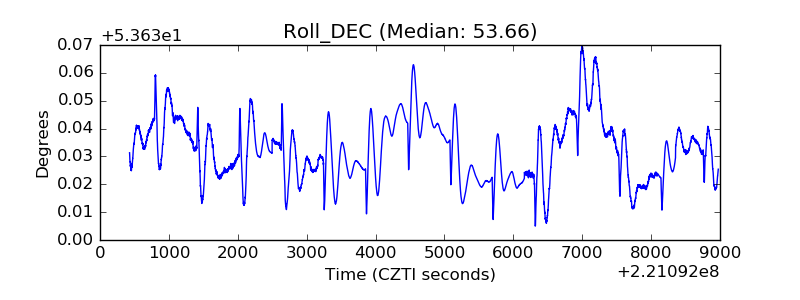 |
| _Roll_RA | 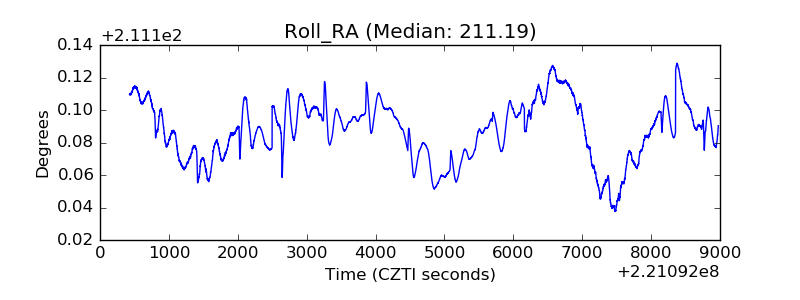 |
| Veto Counter | 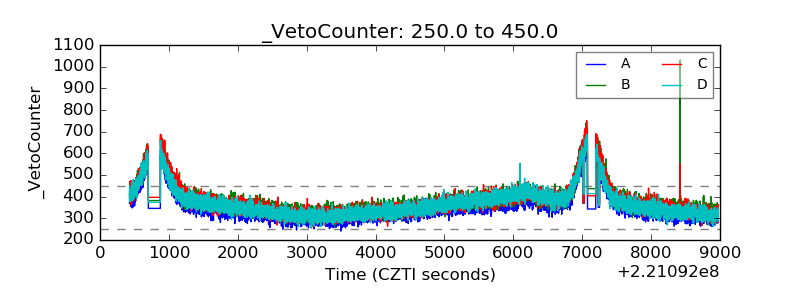 |