| Param | Original file | Final file |
|---|---|---|
| Filename | modeM0/AS1G06_135T03_9000000944_06852cztM0_level2.evt | modeM0/AS1G06_135T03_9000000944_06852cztM0_level2_quad_clean.evt |
| Size (bytes) | 461,491,200 | 87,537,600 |
| Size | 440.1 MB | 83.5 MB |
| Events in quadrant A | 3,119,575 | 555,177 |
| Events in quadrant B | 3,162,992 | 565,571 |
| Events in quadrant C | 3,064,134 | 555,110 |
| Events in quadrant D | 4,186,662 | 520,408 |
| Mode M9 | |||
|---|---|---|---|
| Quadrant | BADHDUFLAG | Total packets | Discarded packets |
| A | 0 | 5 | 0 |
| B | 0 | 5 | 0 |
| C | 0 | 5 | 0 |
| D | 0 | 5 | 0 |
| Mode M0 | |||
|---|---|---|---|
| Quadrant | BADHDUFLAG | Total packets | Discarded packets |
| A | 0 | 13710 | 3 |
| B | 0 | 13991 | 3 |
| C | 0 | 13769 | 3 |
| D | 0 | 17002 | 3 |
| Mode SS | |||
|---|---|---|---|
| Quadrant | BADHDUFLAG | Total packets | Discarded packets |
| A | 0 | 134 | 0 |
| B | 0 | 134 | 0 |
| C | 0 | 134 | 0 |
| D | 0 | 134 | 0 |
| Quadrant | Total seconds | Saturated seconds | Saturation percentage |
|---|---|---|---|
| A | 6517 | 98 | 1.503759% |
| B | 6517 | 155 | 2.378395% |
| C | 6517 | 97 | 1.488415% |
| D | 6517 | 248 | 3.805432% |
Noise dominated data is calculated using 1-second bins in cleaned event files. If a bin has >2000 counts, and if more than 50% of those come from <1% of pixels, then it is considered to be noise-dominated and hence unusable.
| Quadrant | # 1 sec bins | Bins with >0 counts | Bins with >2000 counts | High rate bins dominated by noise | Noise dominated (total time) | Noise dominated (detector-on time) | Marked lightcurve |
|---|---|---|---|---|---|---|---|
| A | 7042 | 6522 | 0 | 0 | 0.00% | 0.00% | 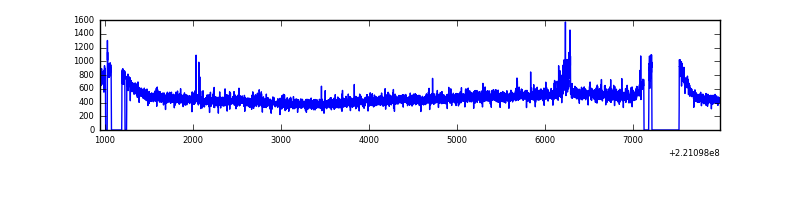 |
| B | 7042 | 6522 | 6 | 6 | 0.09% | 0.09% | 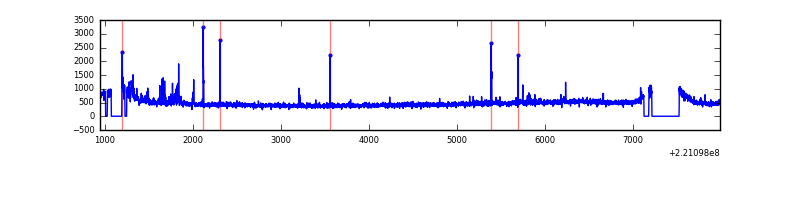 |
| C | 7042 | 6522 | 17 | 17 | 0.24% | 0.26% | 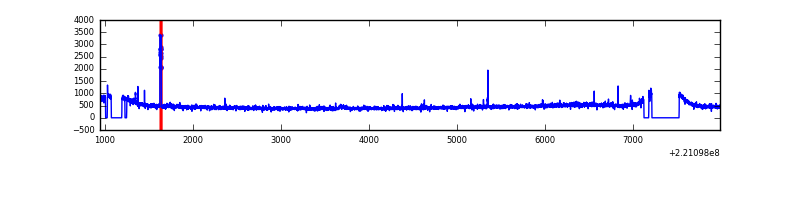 |
| D | 7042 | 6522 | 116 | 116 | 1.65% | 1.78% | 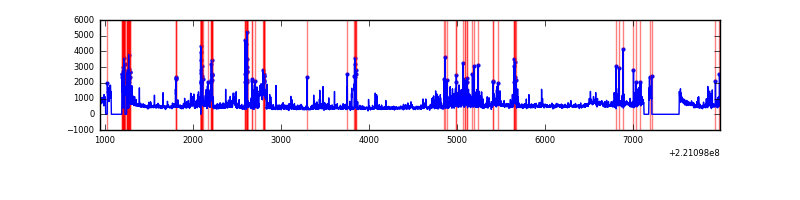 |
Top three noisy pixels from each quadrant. If the there are fewer than three noisy pixels in the level2.evt file, extra rows are filled as -1
| Pixel properties | Quadrant properties | ||||||
|---|---|---|---|---|---|---|---|
| Quadrant | DetID | PixID | Counts | Sigma | Mean | Median | Sigma |
| A | 15 | 239 | 106134 | 665.94 | 768 | 749 | 158.2 |
| A | 8 | 15 | 47368 | 294.59 | 768 | 749 | 158.2 |
| A | 3 | 1 | 8332 | 47.92 | 768 | 749 | 158.2 |
| B | 0 | 228 | 110611 | 740.32 | 772 | 751 | 148.4 |
| B | 12 | 111 | 15318 | 98.16 | 772 | 751 | 148.4 |
| B | 4 | 48 | 14544 | 92.95 | 772 | 751 | 148.4 |
| C | 10 | 22 | 64524 | 367.11 | 747 | 749 | 173.7 |
| C | 9 | 247 | 49057 | 278.08 | 747 | 749 | 173.7 |
| C | 8 | 128 | 14915 | 81.54 | 747 | 749 | 173.7 |
| D | 2 | 216 | 457318 | 2507.44 | 732 | 707 | 182.1 |
| D | 14 | 34 | 349091 | 1913.12 | 732 | 707 | 182.1 |
| D | 8 | 195 | 190342 | 1041.36 | 732 | 707 | 182.1 |
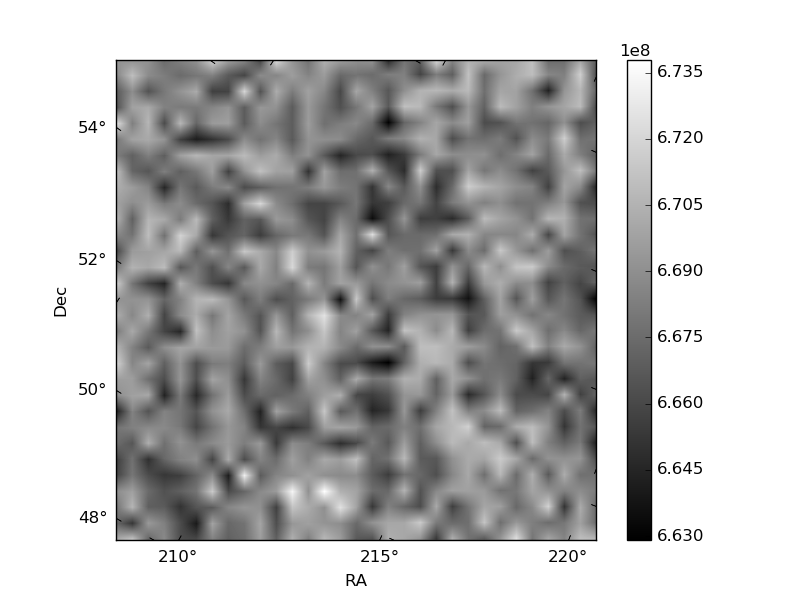
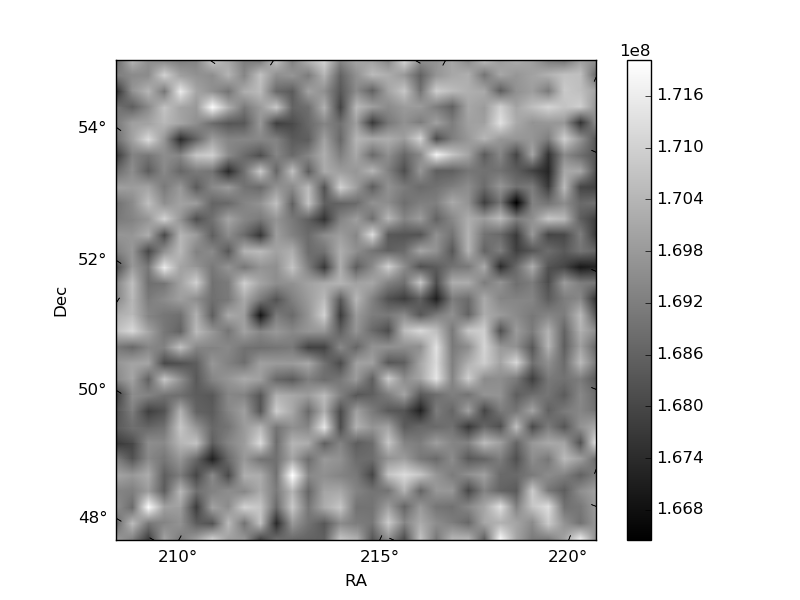
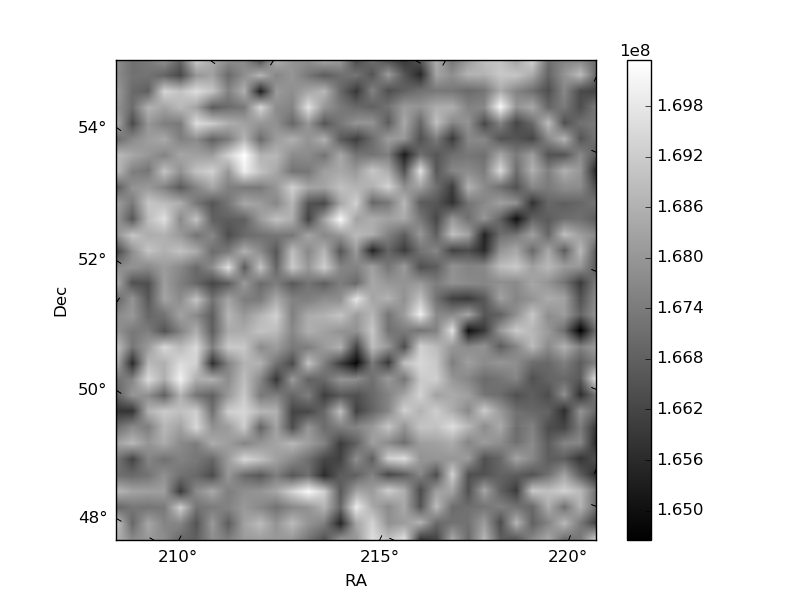
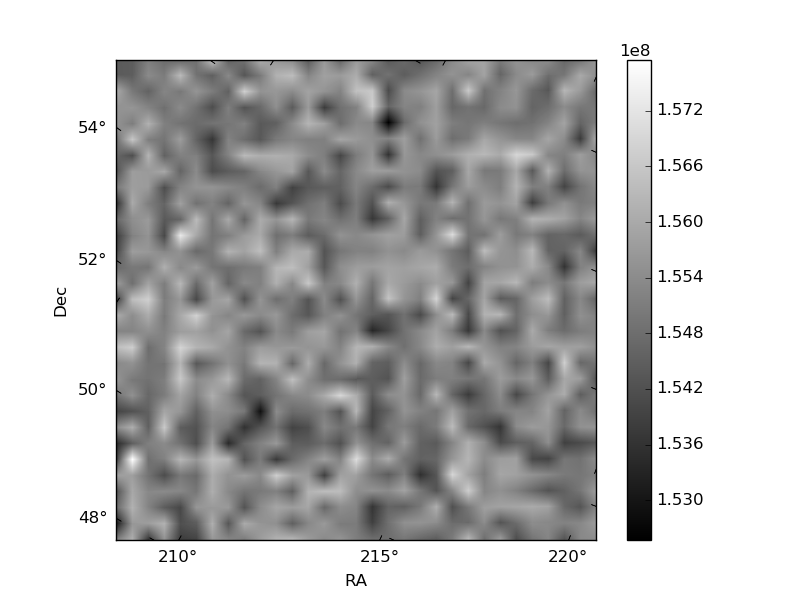
Histogram calculated using DETX and DETY for each event in the final _common_clean file
| Quadrant A | 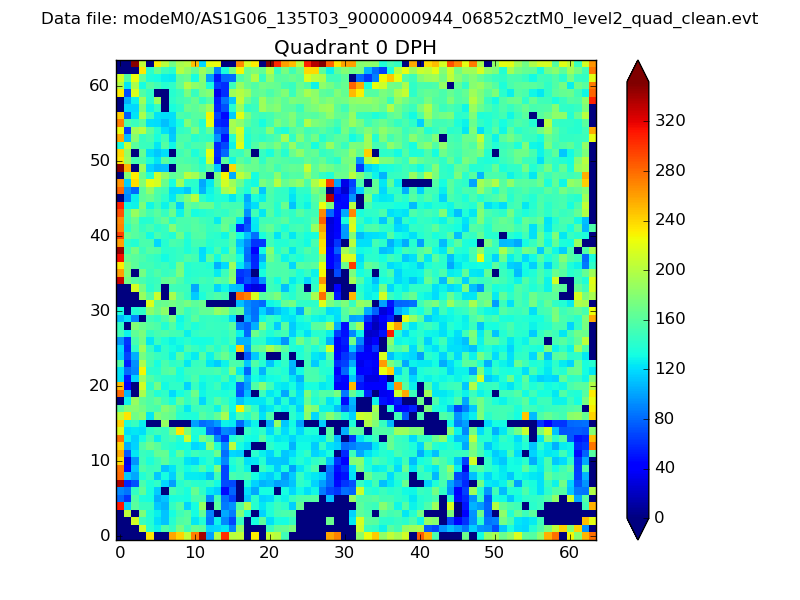 |
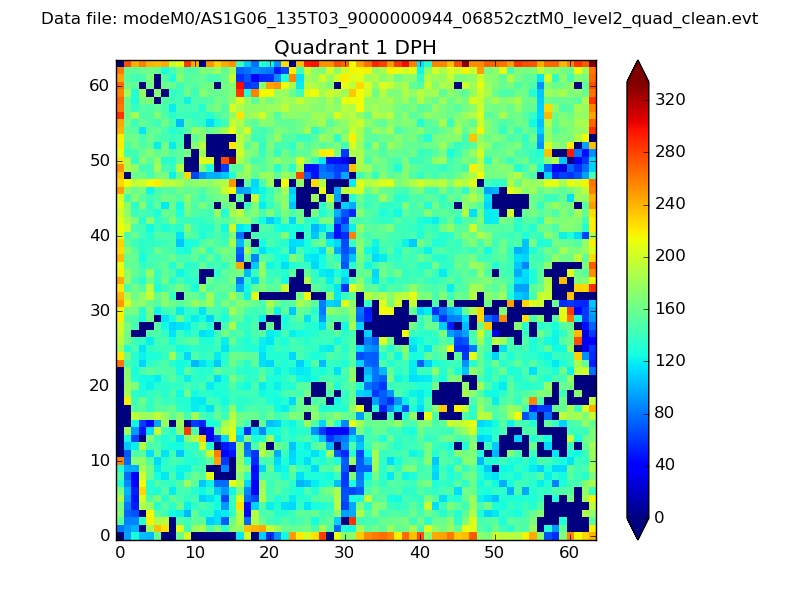 |
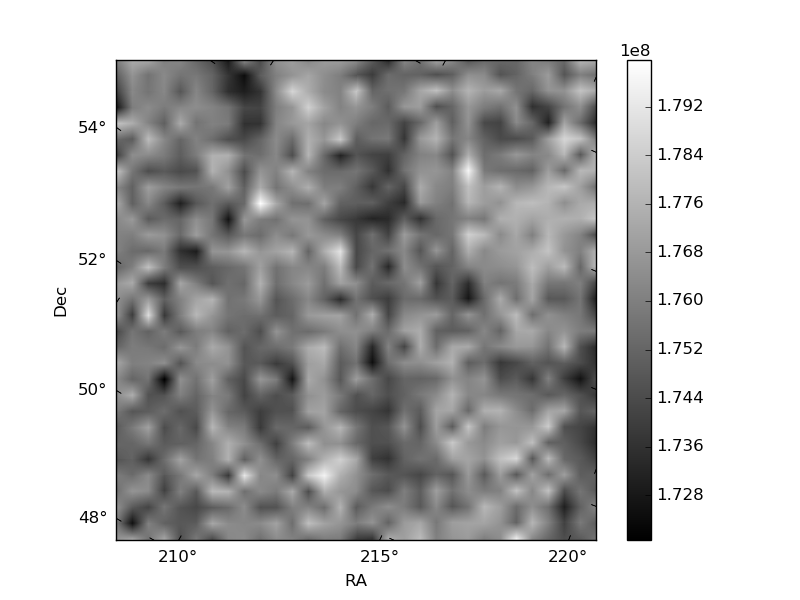
Quadrant B |
|---|---|---|---|
| Quadrant D | 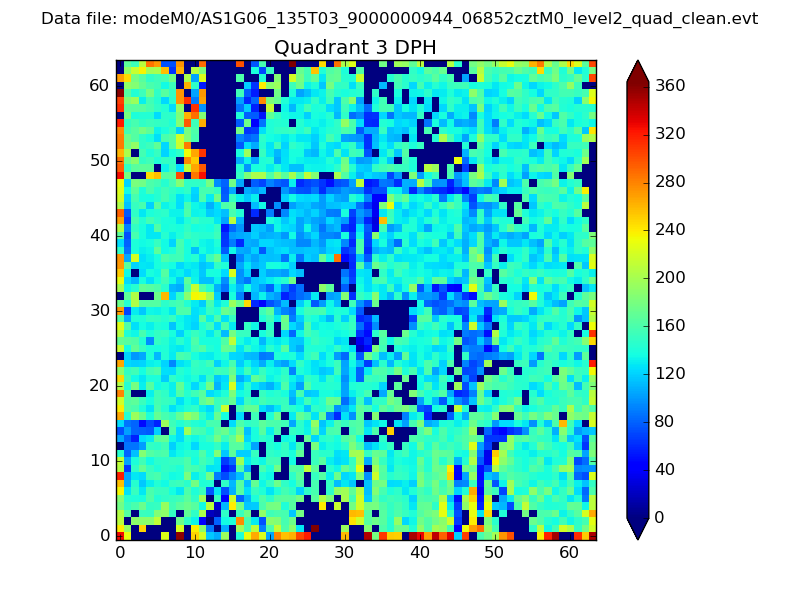 |
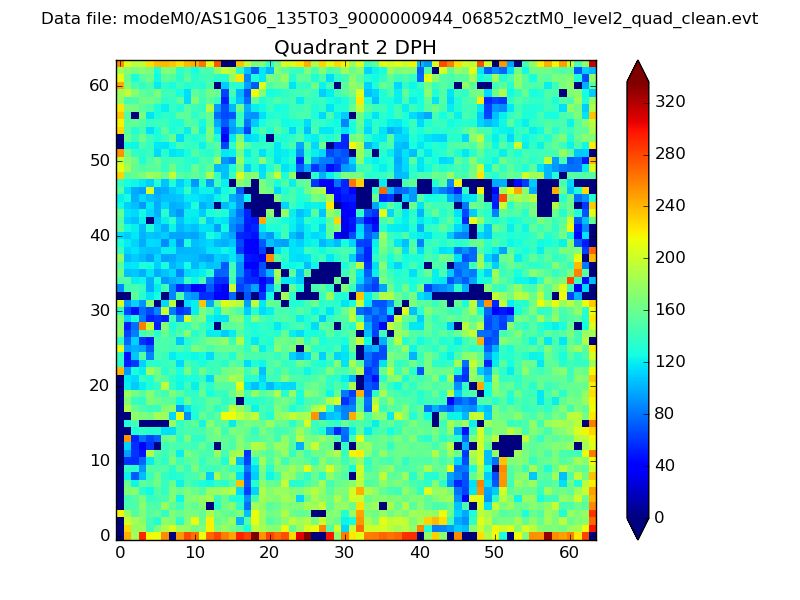 |
Quadrant C |
| Plot type | Count rate plots | Images |
|---|---|---|
| Comparison with Poisson distribution Blue bars denote a histogram of data divided into 1 sec bins. Red curve is a Poisson curve with rate = median count rate of data. |
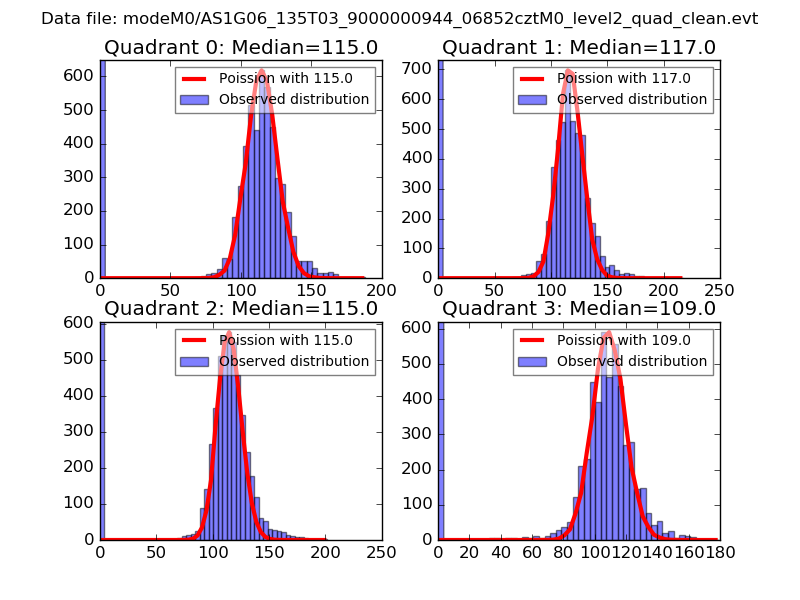 |
 |
| Quadrant-wise count rates Data is divided into 100 sec bins |
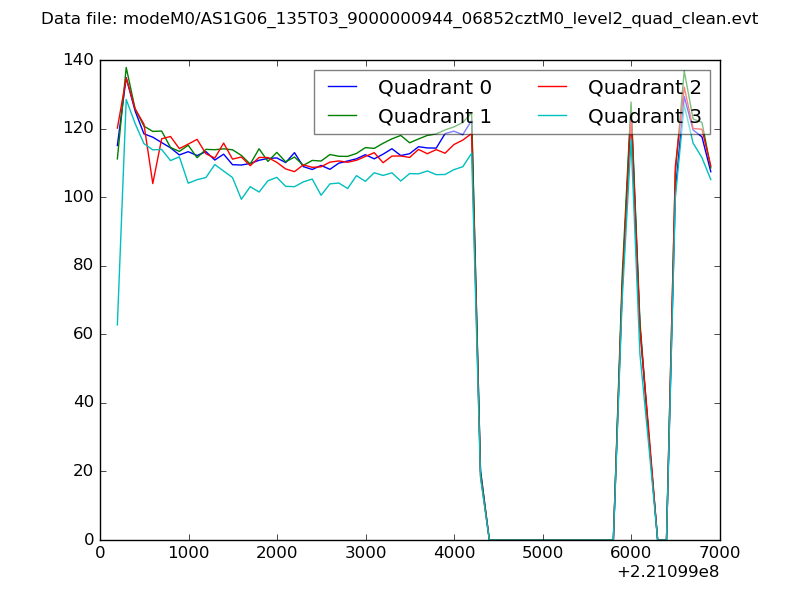 |
|
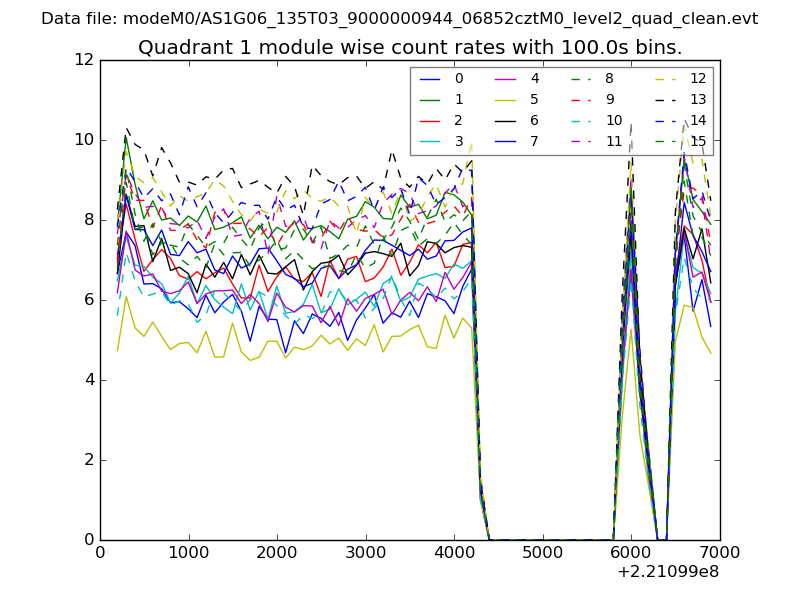
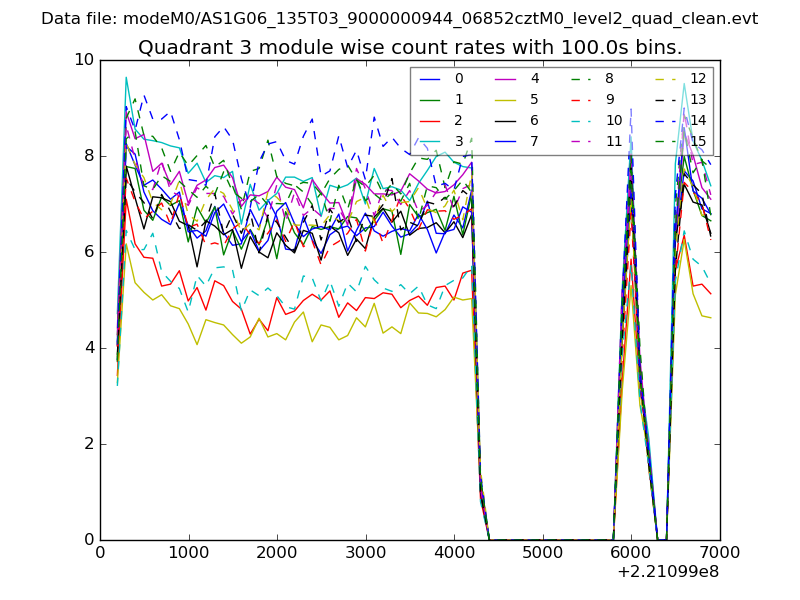
| Module-wise count rates for Quadrant A Data is divided into 100 sec bins |
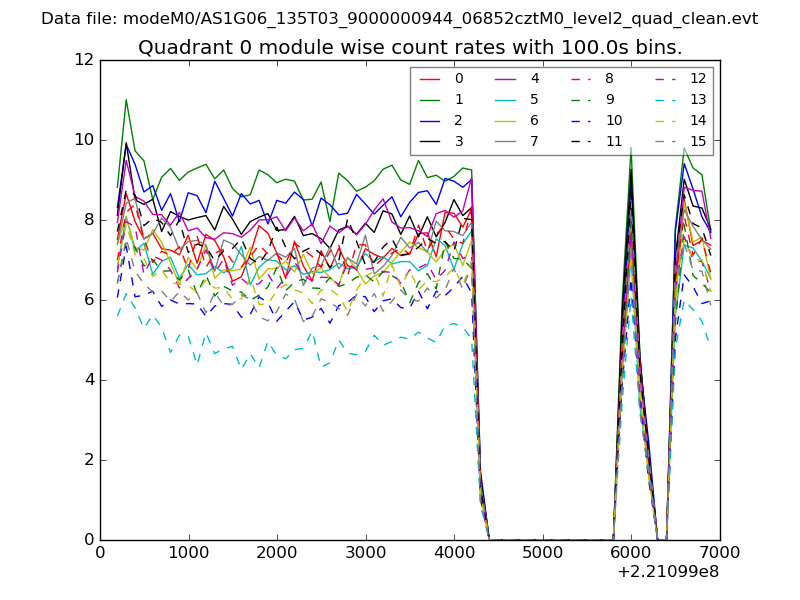 |
 |
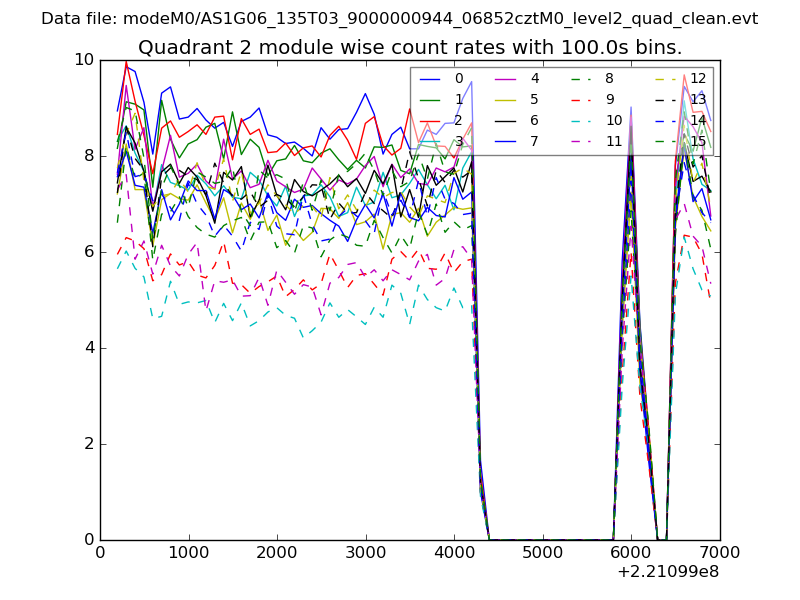
| Module-wise count rates for Quadrant B Data is divided into 100 sec bins |
 |
 |
| Module-wise count rates for Quadrant C Data is divided into 100 sec bins |
 |
 |
| Module-wise count rates for Quadrant D Data is divided into 100 sec bins |
 |
 |
| Parameter | Plot |
|---|---|
| CZT HV Monitor | 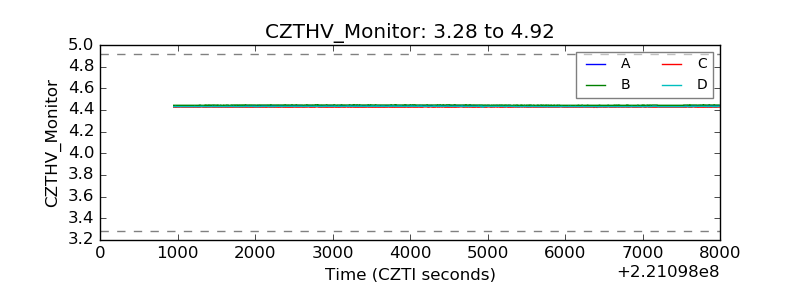 |
| D_VDD | 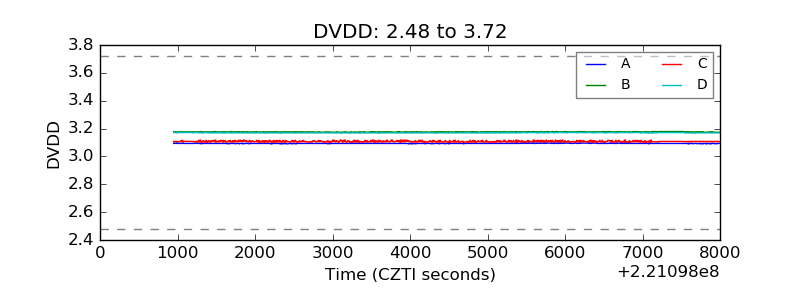 |
| Temperature 1 | 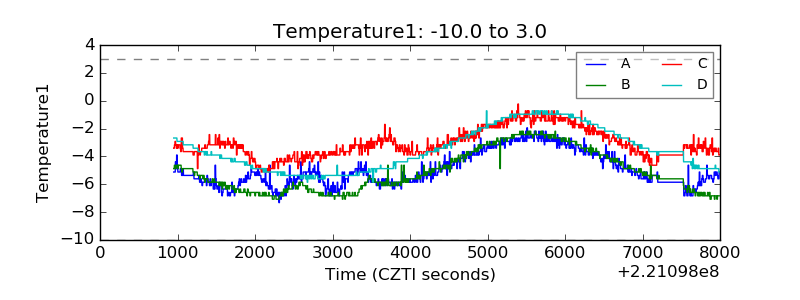 |
| Veto HV Monitor | 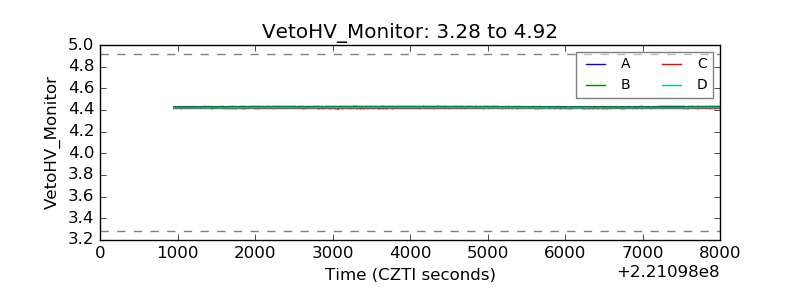 |
| Veto LLD | 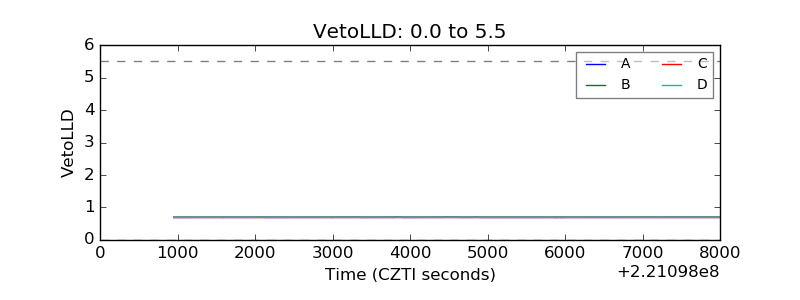 |
| Alpha Counter | 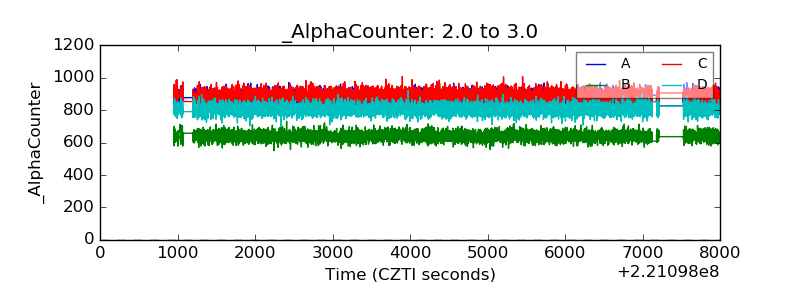 |
| _CPM_Rate | 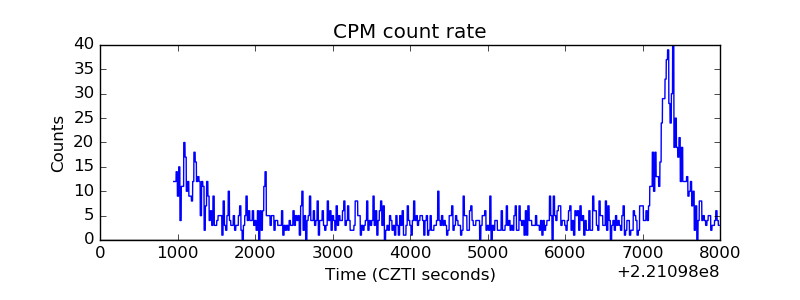 |
| CZT Counter | 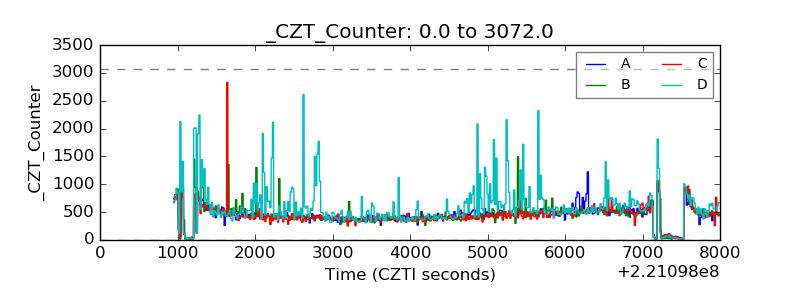 |
| +2.5 Volts monitor |  |
| +5 Volts monitor | 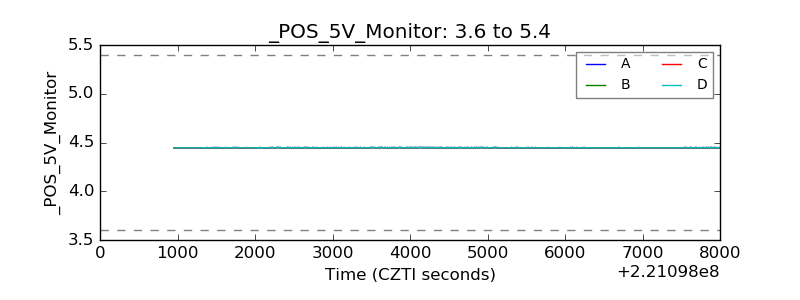 |
| _ROLL_ROT | 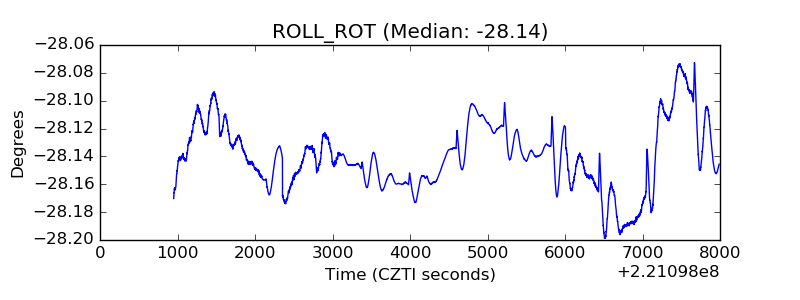 |
| _Roll_DEC | 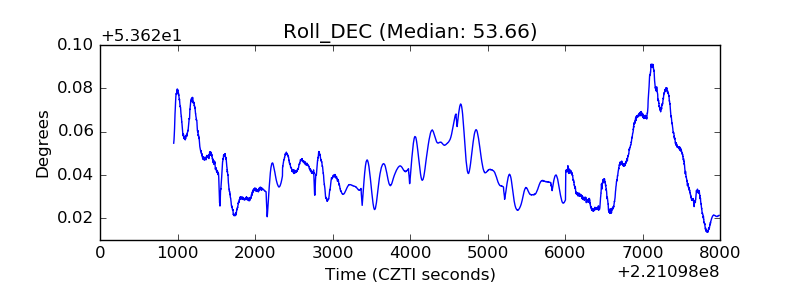 |
| _Roll_RA | 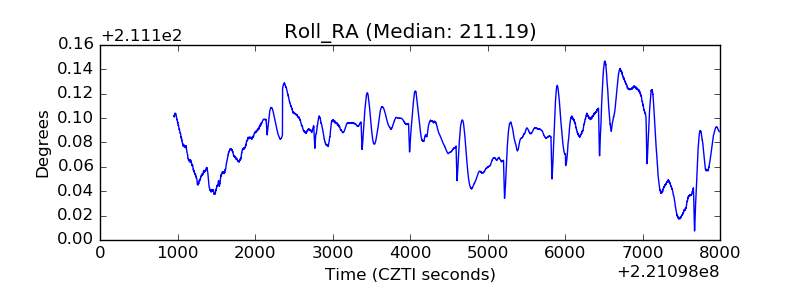 |
| Veto Counter | 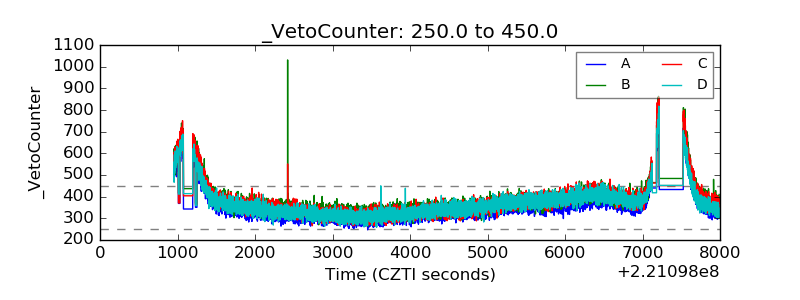 |