| Param | Original file | Final file |
|---|---|---|
| Filename | modeM0/AS1G06_168T13_9000000942_06848cztM0_level2.evt | modeM0/AS1G06_168T13_9000000942_06848cztM0_level2_quad_clean.evt |
| Size (bytes) | 344,116,800 | 65,825,280 |
| Size | 328.2 MB | 62.8 MB |
| Events in quadrant A | 2,605,412 | 416,294 |
| Events in quadrant B | 2,337,805 | 424,727 |
| Events in quadrant C | 2,473,303 | 414,730 |
| Events in quadrant D | 2,686,606 | 409,130 |
| Mode SS | |||
|---|---|---|---|
| Quadrant | BADHDUFLAG | Total packets | Discarded packets |
| A | 0 | 96 | 0 |
| B | 0 | 96 | 0 |
| C | 0 | 96 | 0 |
| D | 0 | 96 | 0 |
| Mode M0 | |||
|---|---|---|---|
| Quadrant | BADHDUFLAG | Total packets | Discarded packets |
| A | 0 | 10795 | 2 |
| B | 0 | 10068 | 1 |
| C | 0 | 10496 | 1 |
| D | 0 | 11198 | 1 |
| Mode M9 | |||
|---|---|---|---|
| Quadrant | BADHDUFLAG | Total packets | Discarded packets |
| A | 0 | 10 | 0 |
| B | 0 | 10 | 0 |
| C | 0 | 10 | 0 |
| D | 0 | 10 | 0 |
| Quadrant | Total seconds | Saturated seconds | Saturation percentage |
|---|---|---|---|
| A | 4670 | 63 | 1.349036% |
| B | 4670 | 70 | 1.498929% |
| C | 4670 | 125 | 2.676660% |
| D | 4670 | 175 | 3.747323% |
Noise dominated data is calculated using 1-second bins in cleaned event files. If a bin has >2000 counts, and if more than 50% of those come from <1% of pixels, then it is considered to be noise-dominated and hence unusable.
| Quadrant | # 1 sec bins | Bins with >0 counts | Bins with >2000 counts | High rate bins dominated by noise | Noise dominated (total time) | Noise dominated (detector-on time) | Marked lightcurve |
|---|---|---|---|---|---|---|---|
| A | 5690 | 4671 | 4 | 4 | 0.07% | 0.09% | 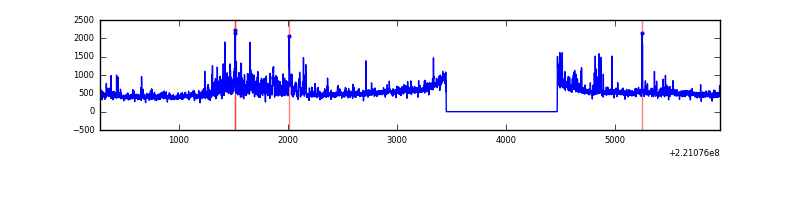 |
| B | 5690 | 4671 | 2 | 2 | 0.04% | 0.04% | 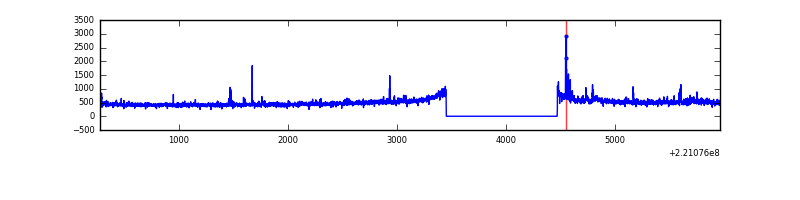 |
| C | 5690 | 4671 | 60 | 60 | 1.05% | 1.28% | 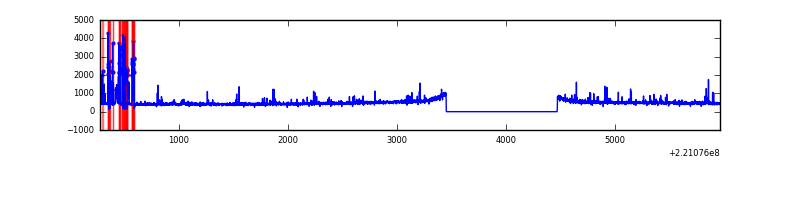 |
| D | 5690 | 4671 | 115 | 115 | 2.02% | 2.46% | 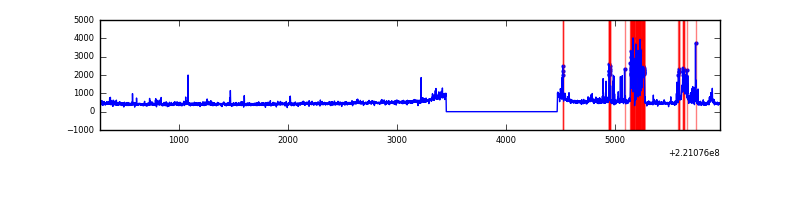 |
Top three noisy pixels from each quadrant. If the there are fewer than three noisy pixels in the level2.evt file, extra rows are filled as -1
| Pixel properties | Quadrant properties | ||||||
|---|---|---|---|---|---|---|---|
| Quadrant | DetID | PixID | Counts | Sigma | Mean | Median | Sigma |
| A | 8 | 15 | 358379 | 3066.87 | 563 | 549 | 116.7 |
| A | 15 | 239 | 44352 | 375.42 | 563 | 549 | 116.7 |
| A | 13 | 248 | 26588 | 223.17 | 563 | 549 | 116.7 |
| B | 4 | 48 | 29716 | 262.93 | 569 | 556 | 110.9 |
| B | 3 | 220 | 28819 | 254.85 | 569 | 556 | 110.9 |
| B | 0 | 219 | 22583 | 198.62 | 569 | 556 | 110.9 |
| C | 9 | 68 | 318402 | 2485.85 | 545 | 548 | 127.9 |
| C | 9 | 247 | 11731 | 87.46 | 545 | 548 | 127.9 |
| C | 10 | 22 | 6744 | 48.46 | 545 | 548 | 127.9 |
| D | 2 | 33 | 469303 | 3473.34 | 545 | 528 | 135.0 |
| D | 8 | 195 | 97904 | 721.5 | 545 | 528 | 135.0 |
| D | 2 | 136 | 19313 | 139.19 | 545 | 528 | 135.0 |
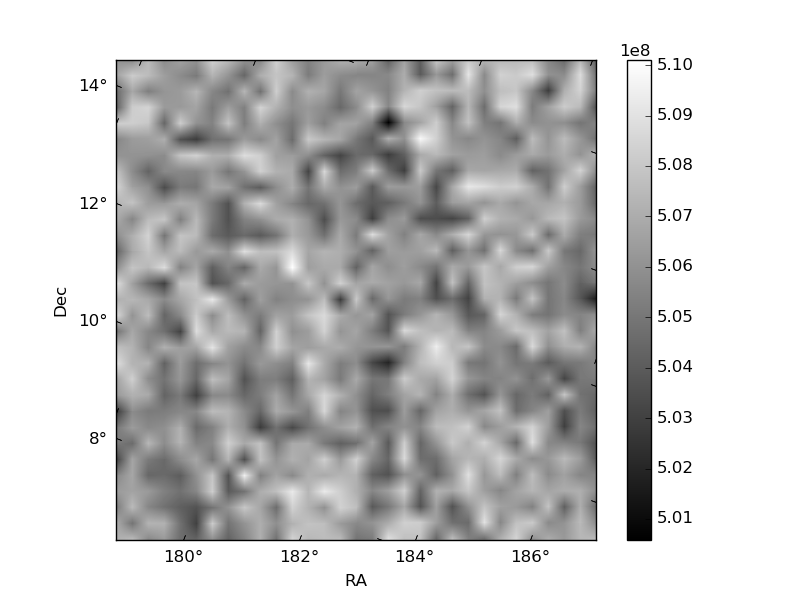
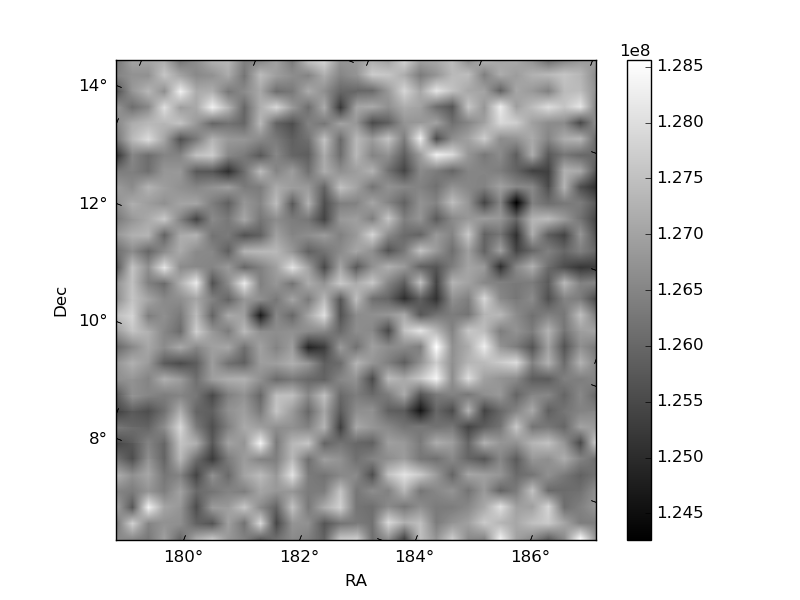
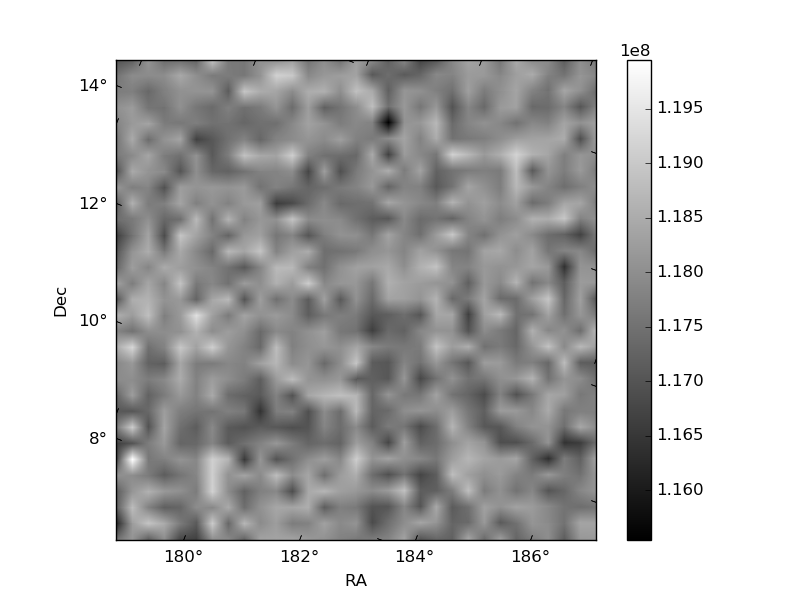
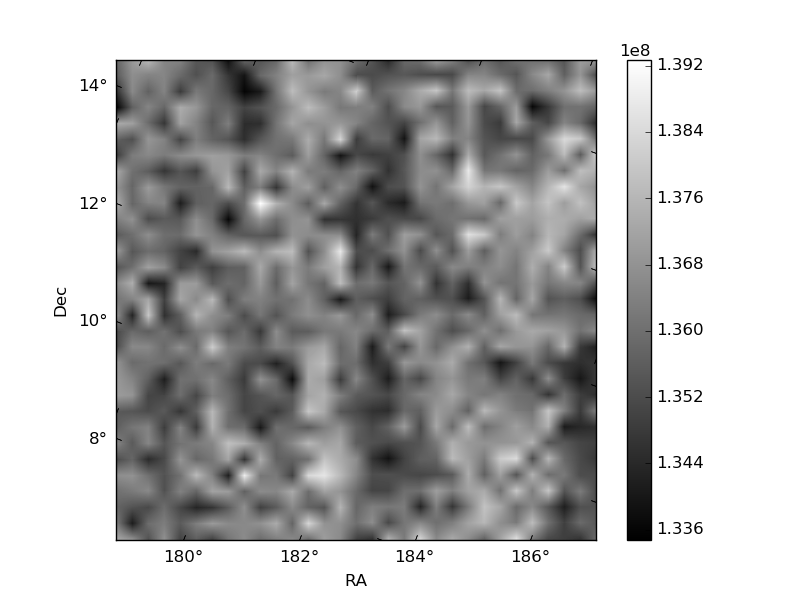
Histogram calculated using DETX and DETY for each event in the final _common_clean file
| Quadrant A | 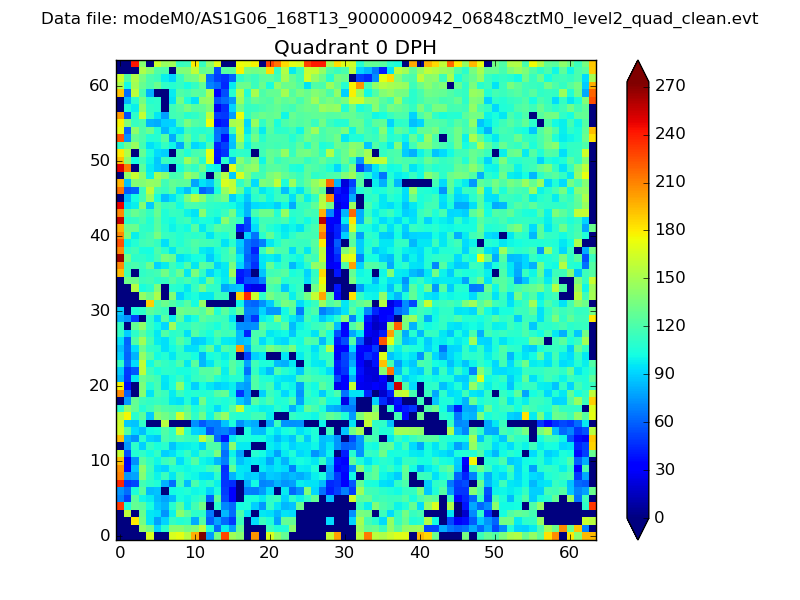 |
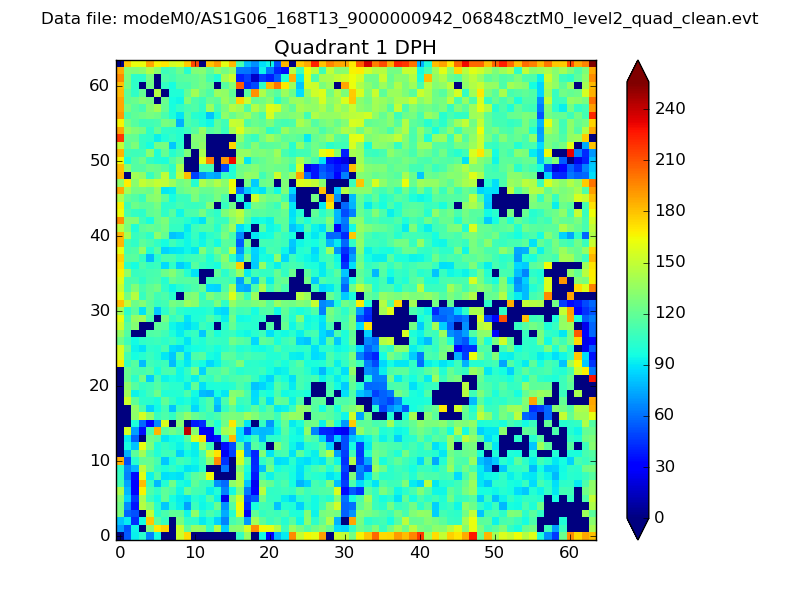 |
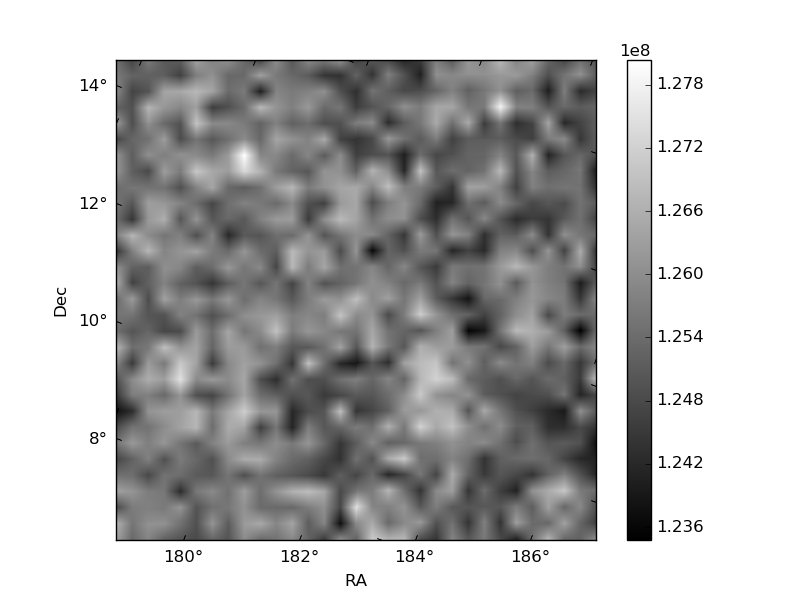
Quadrant B |
|---|---|---|---|
| Quadrant D | 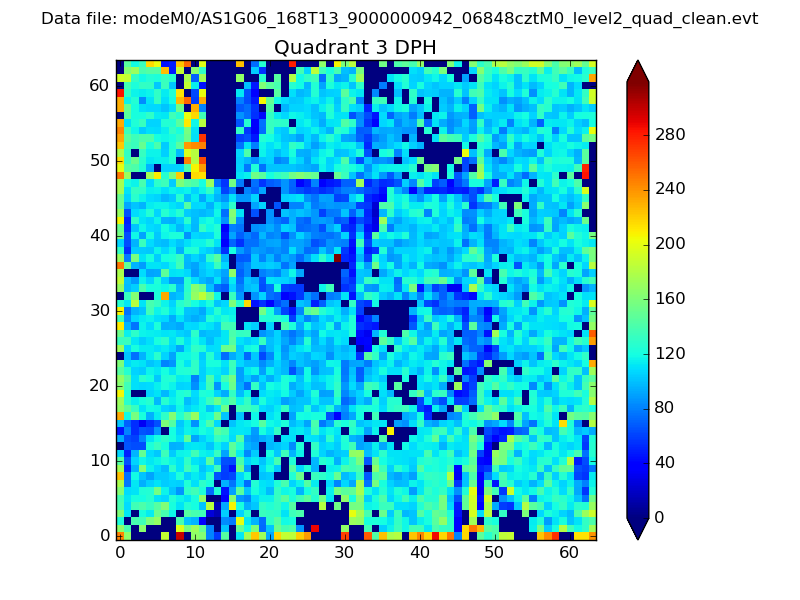 |
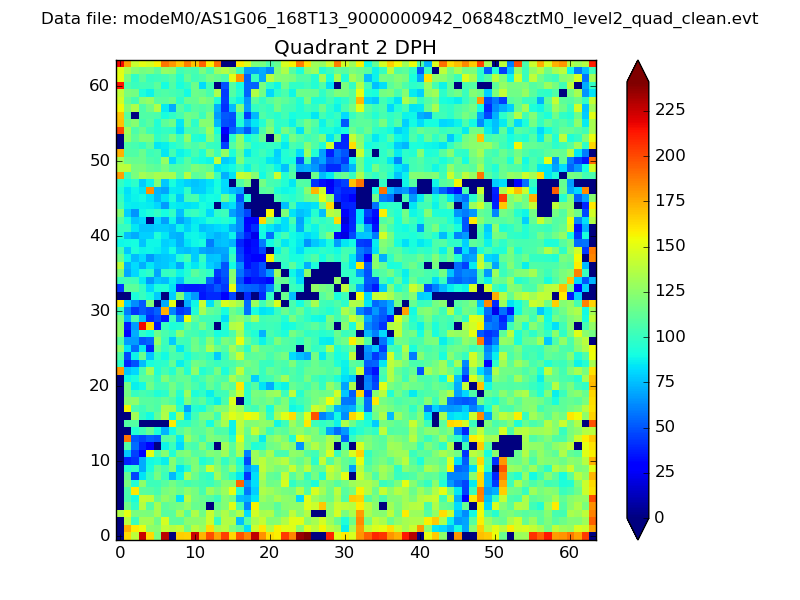 |
Quadrant C |
| Plot type | Count rate plots | Images |
|---|---|---|
| Comparison with Poisson distribution Blue bars denote a histogram of data divided into 1 sec bins. Red curve is a Poisson curve with rate = median count rate of data. |
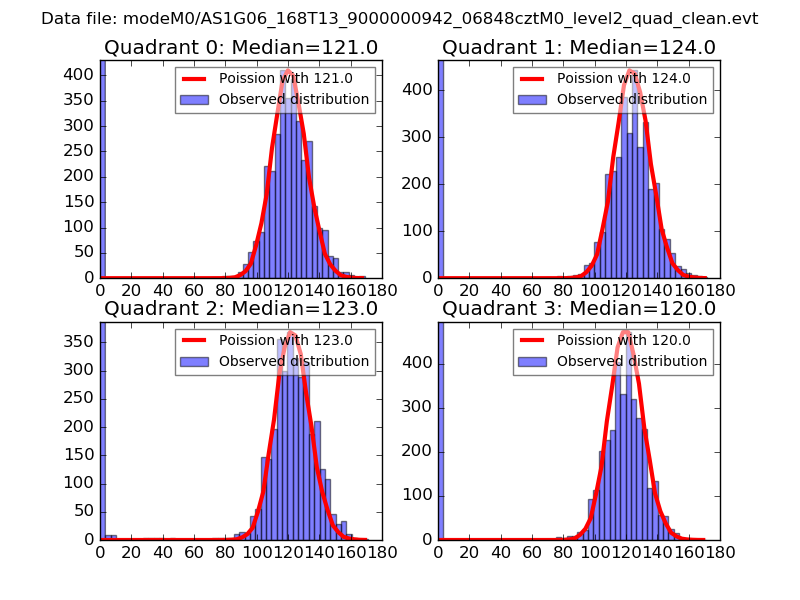 |
 |
| Quadrant-wise count rates Data is divided into 100 sec bins |
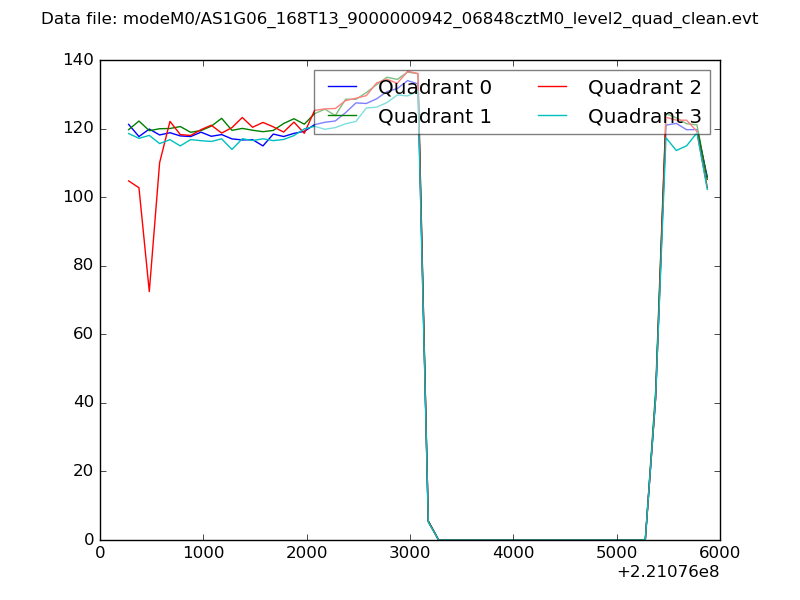 |
|
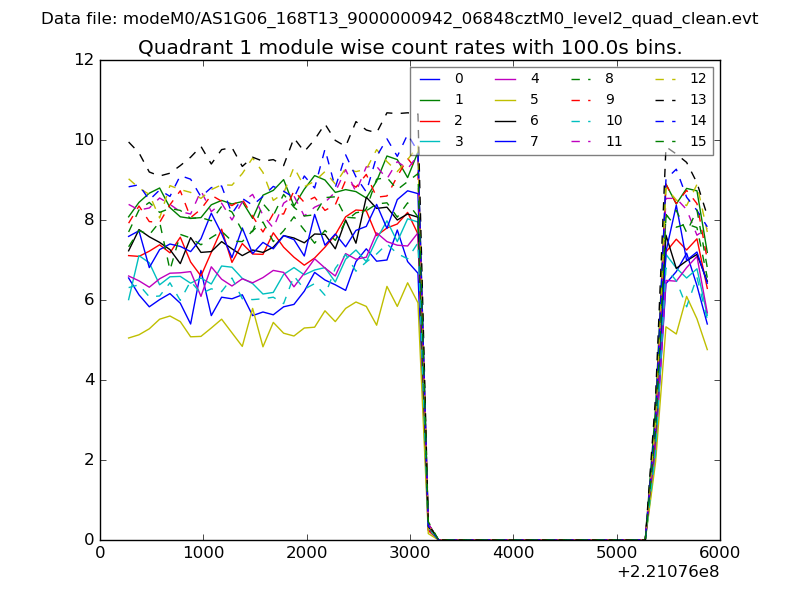
| Module-wise count rates for Quadrant A Data is divided into 100 sec bins |
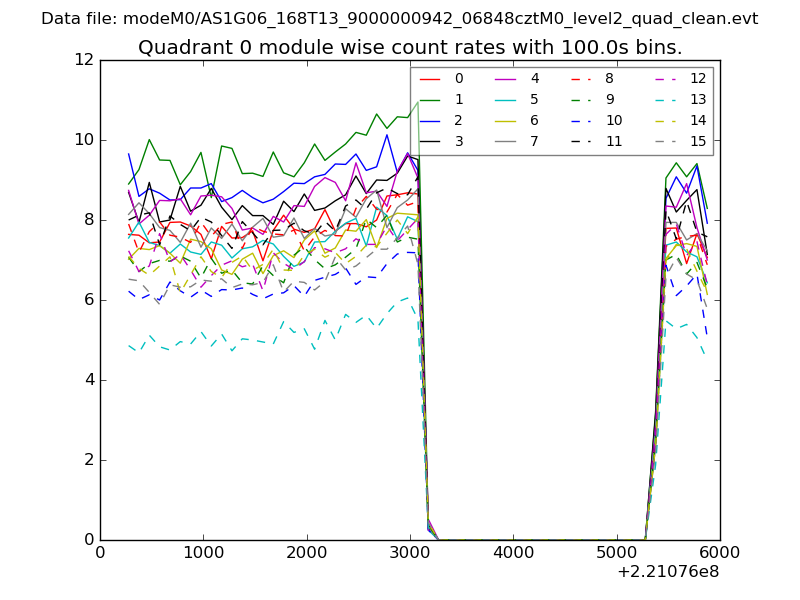 |
 |
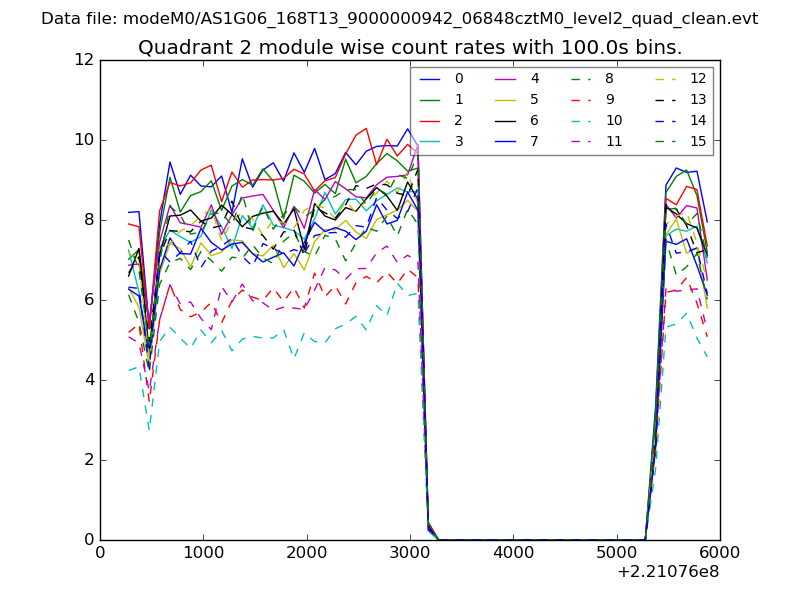
| Module-wise count rates for Quadrant B Data is divided into 100 sec bins |
 |
 |
| Module-wise count rates for Quadrant C Data is divided into 100 sec bins |
 |
 |
| Module-wise count rates for Quadrant D Data is divided into 100 sec bins |
 |
 |
| Parameter | Plot |
|---|---|
| CZT HV Monitor | 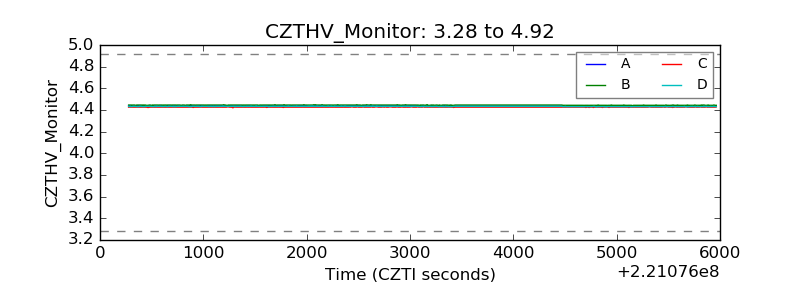 |
| D_VDD | 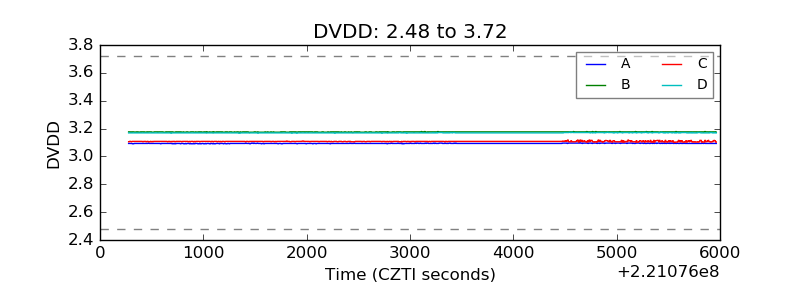 |
| Temperature 1 | 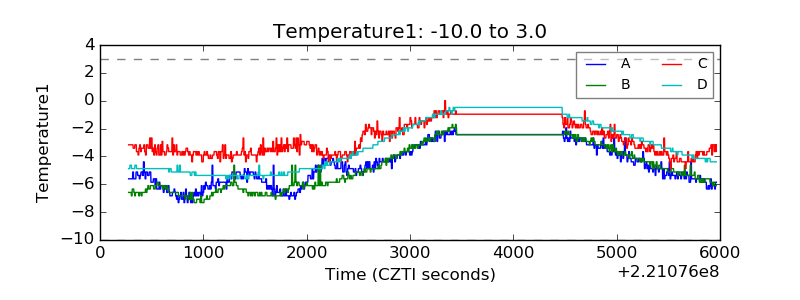 |
| Veto HV Monitor | 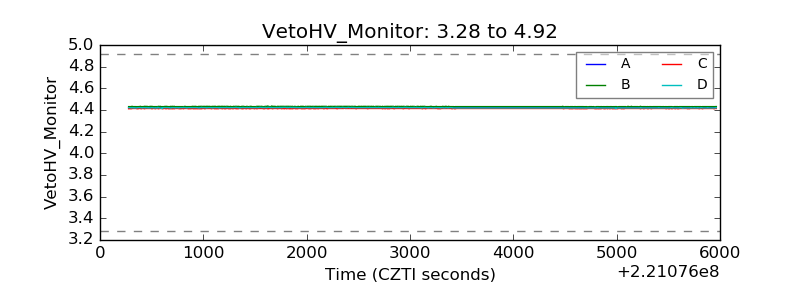 |
| Veto LLD | 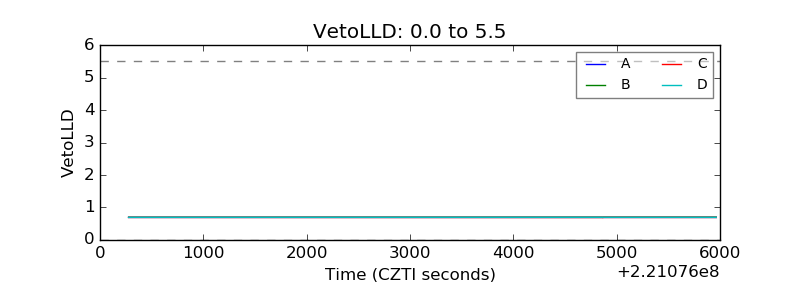 |
| Alpha Counter | 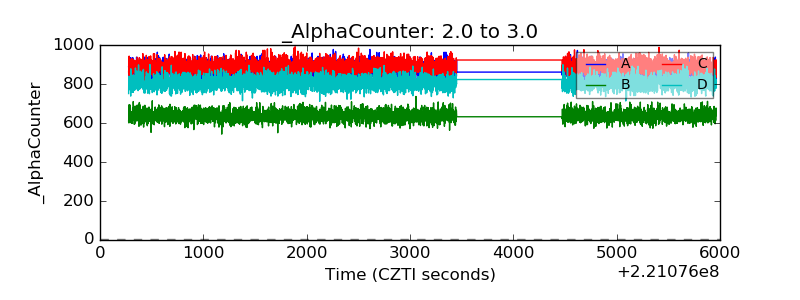 |
| _CPM_Rate | 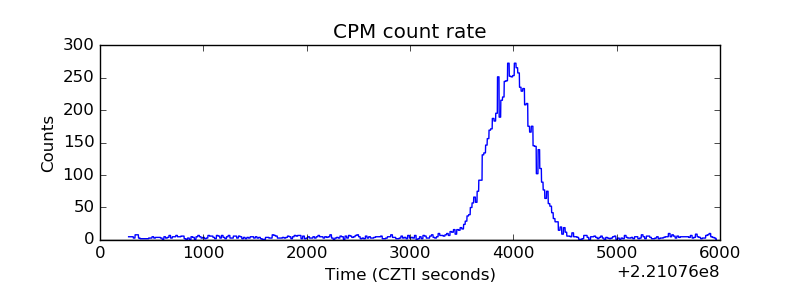 |
| CZT Counter | 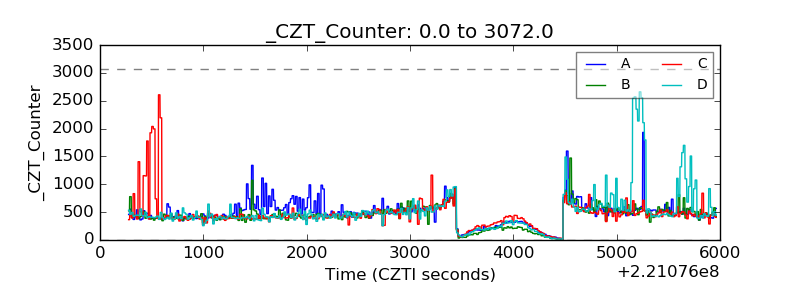 |
| +2.5 Volts monitor |  |
| +5 Volts monitor |  |
| _ROLL_ROT |  |
| _Roll_DEC | 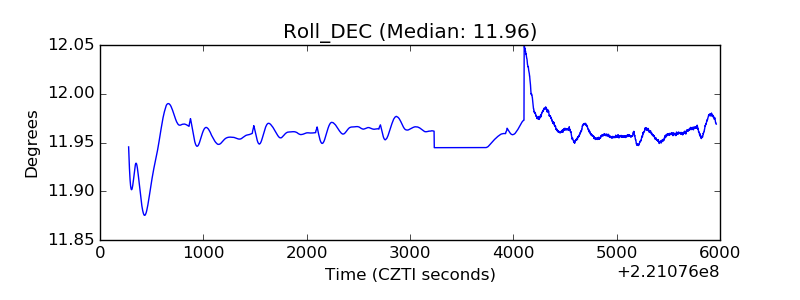 |
| _Roll_RA | 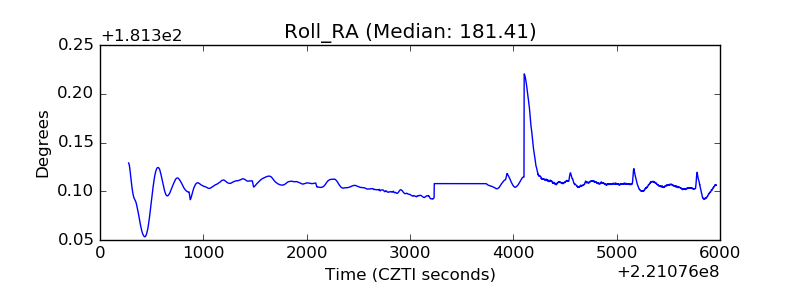 |
| Veto Counter | 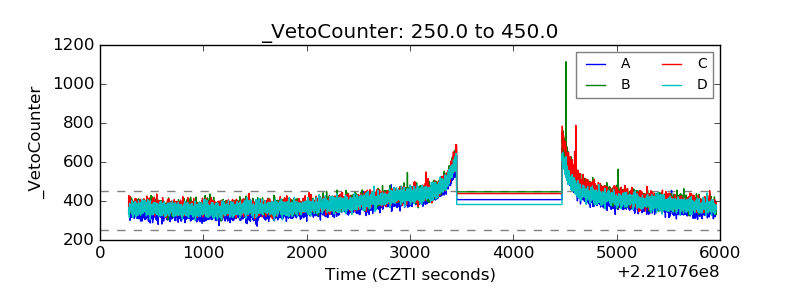 |