| Param | Original file | Final file |
|---|---|---|
| Filename | modeM0/AS1G06_168T13_9000000942_06849cztM0_level2.evt | modeM0/AS1G06_168T13_9000000942_06849cztM0_level2_quad_clean.evt |
| Size (bytes) | 531,063,360 | 89,072,640 |
| Size | 506.5 MB | 84.9 MB |
| Events in quadrant A | 3,758,139 | 543,381 |
| Events in quadrant B | 3,783,551 | 551,212 |
| Events in quadrant C | 3,709,988 | 547,685 |
| Events in quadrant D | 4,319,652 | 530,468 |
| Mode SS | |||
|---|---|---|---|
| Quadrant | BADHDUFLAG | Total packets | Discarded packets |
| A | 0 | 156 | 0 |
| B | 0 | 156 | 0 |
| C | 0 | 156 | 0 |
| D | 0 | 156 | 0 |
| Mode M0 | |||
|---|---|---|---|
| Quadrant | BADHDUFLAG | Total packets | Discarded packets |
| A | 0 | 16159 | 3 |
| B | 0 | 16247 | 2 |
| C | 0 | 16145 | 2 |
| D | 0 | 18205 | 2 |
| Mode M9 | |||
|---|---|---|---|
| Quadrant | BADHDUFLAG | Total packets | Discarded packets |
| A | 0 | 16 | 0 |
| B | 0 | 16 | 0 |
| C | 0 | 16 | 0 |
| D | 0 | 16 | 0 |
| Quadrant | Total seconds | Saturated seconds | Saturation percentage |
|---|---|---|---|
| A | 7535 | 102 | 1.353683% |
| B | 7535 | 136 | 1.804910% |
| C | 7535 | 64 | 0.849370% |
| D | 7535 | 272 | 3.609821% |
Noise dominated data is calculated using 1-second bins in cleaned event files. If a bin has >2000 counts, and if more than 50% of those come from <1% of pixels, then it is considered to be noise-dominated and hence unusable.
| Quadrant | # 1 sec bins | Bins with >0 counts | Bins with >2000 counts | High rate bins dominated by noise | Noise dominated (total time) | Noise dominated (detector-on time) | Marked lightcurve |
|---|---|---|---|---|---|---|---|
| A | 9140 | 7537 | 1 | 1 | 0.01% | 0.01% | 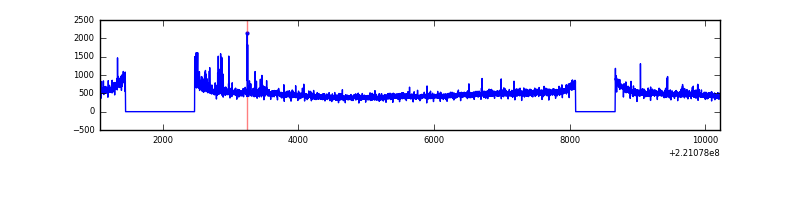 |
| B | 9140 | 7537 | 4 | 4 | 0.04% | 0.05% | 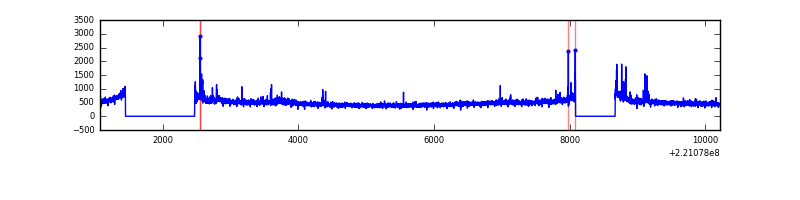 |
| C | 9140 | 7537 | 4 | 4 | 0.04% | 0.05% | 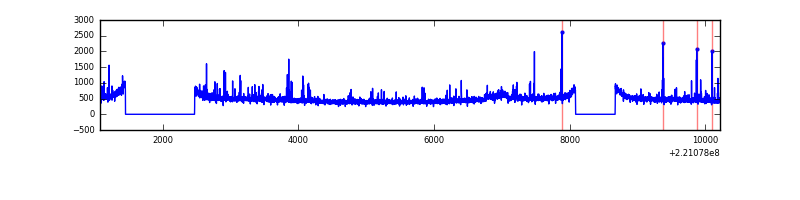 |
| D | 9140 | 7537 | 171 | 171 | 1.87% | 2.27% | 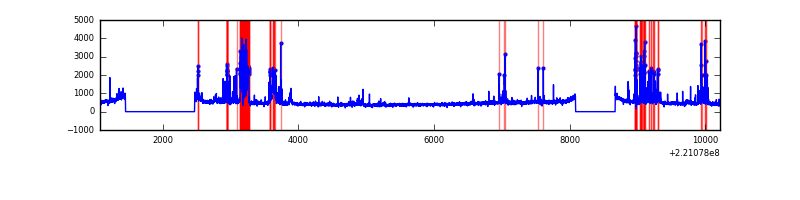 |
Top three noisy pixels from each quadrant. If the there are fewer than three noisy pixels in the level2.evt file, extra rows are filled as -1
| Pixel properties | Quadrant properties | ||||||
|---|---|---|---|---|---|---|---|
| Quadrant | DetID | PixID | Counts | Sigma | Mean | Median | Sigma |
| A | 8 | 15 | 102597 | 537.03 | 921 | 900 | 189.4 |
| A | 15 | 239 | 85273 | 445.54 | 921 | 900 | 189.4 |
| A | 13 | 248 | 17887 | 89.7 | 921 | 900 | 189.4 |
| B | 4 | 48 | 47186 | 256.29 | 927 | 903 | 180.6 |
| B | 0 | 219 | 37595 | 203.18 | 927 | 903 | 180.6 |
| B | 0 | 214 | 22401 | 119.05 | 927 | 903 | 180.6 |
| C | 9 | 68 | 75710 | 356.42 | 900 | 905 | 209.9 |
| C | 10 | 22 | 49861 | 233.26 | 900 | 905 | 209.9 |
| C | 3 | 9 | 26525 | 122.07 | 900 | 905 | 209.9 |
| D | 2 | 33 | 683522 | 3122.71 | 890 | 862 | 218.6 |
| D | 14 | 34 | 83986 | 380.24 | 890 | 862 | 218.6 |
| D | 8 | 195 | 60028 | 270.64 | 890 | 862 | 218.6 |
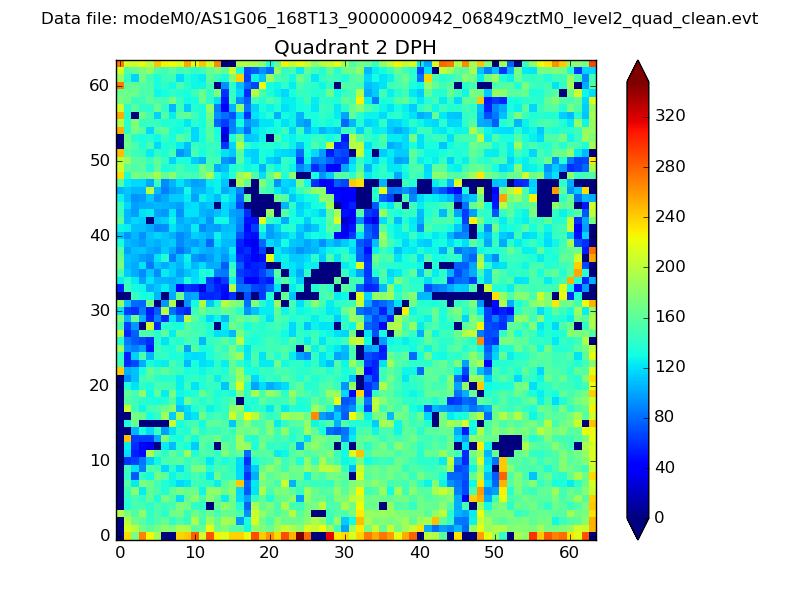
Histogram calculated using DETX and DETY for each event in the final _common_clean file
| Quadrant A | 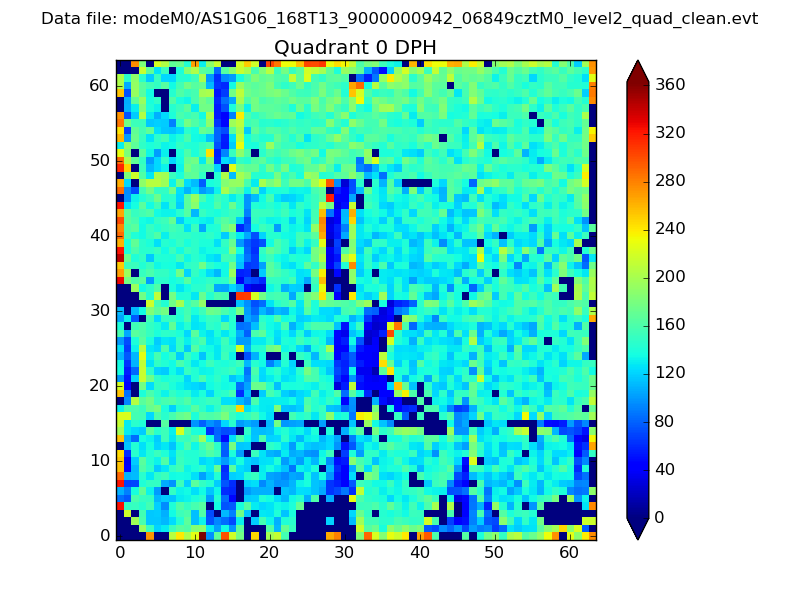 |
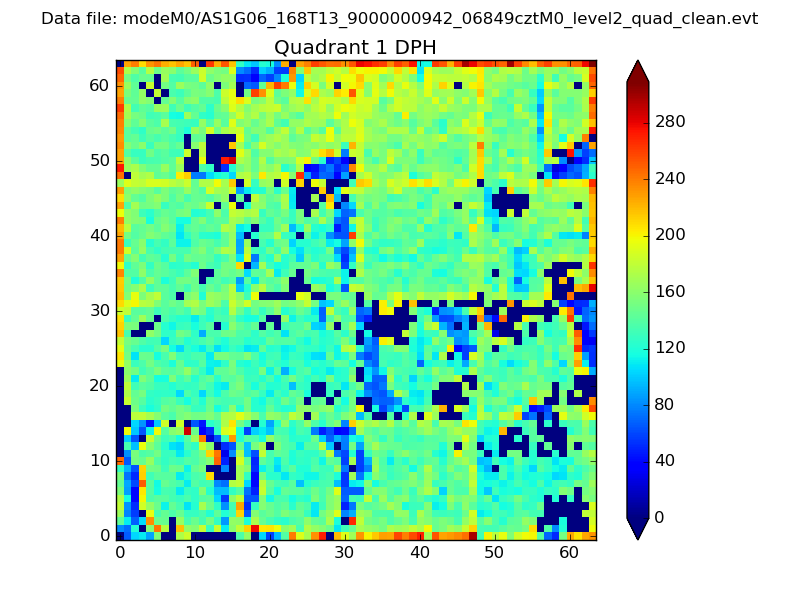 |
Quadrant B |
|---|---|---|---|
| Quadrant D | 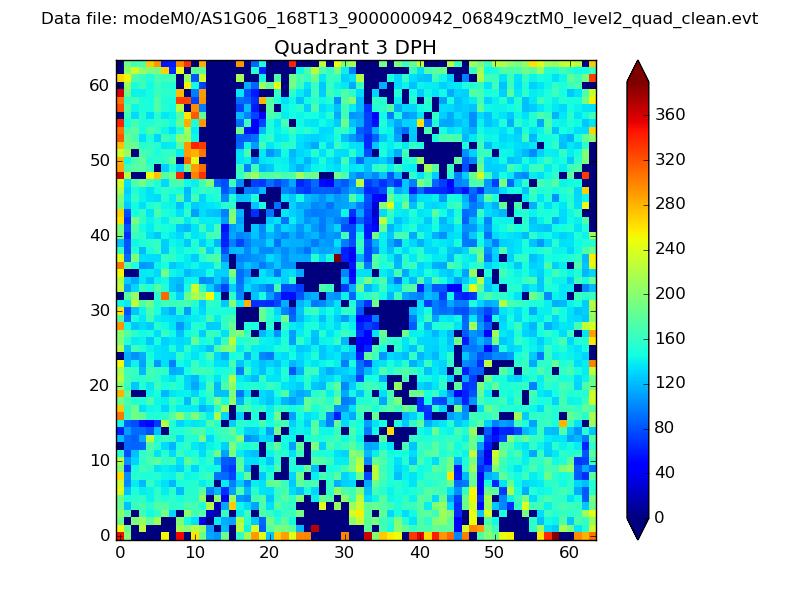 |
 |
Quadrant C |
| Plot type | Count rate plots | Images |
|---|---|---|
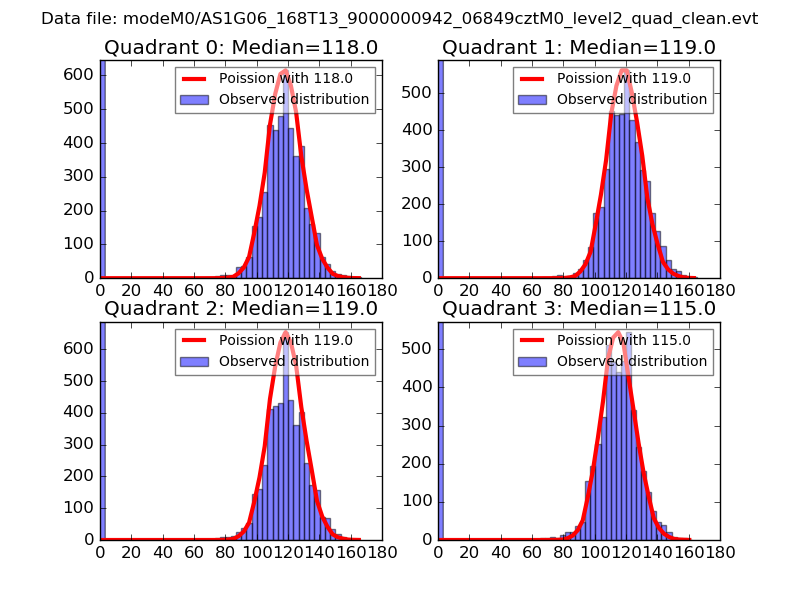
| Comparison with Poisson distribution Blue bars denote a histogram of data divided into 1 sec bins. Red curve is a Poisson curve with rate = median count rate of data. |
 |
 |
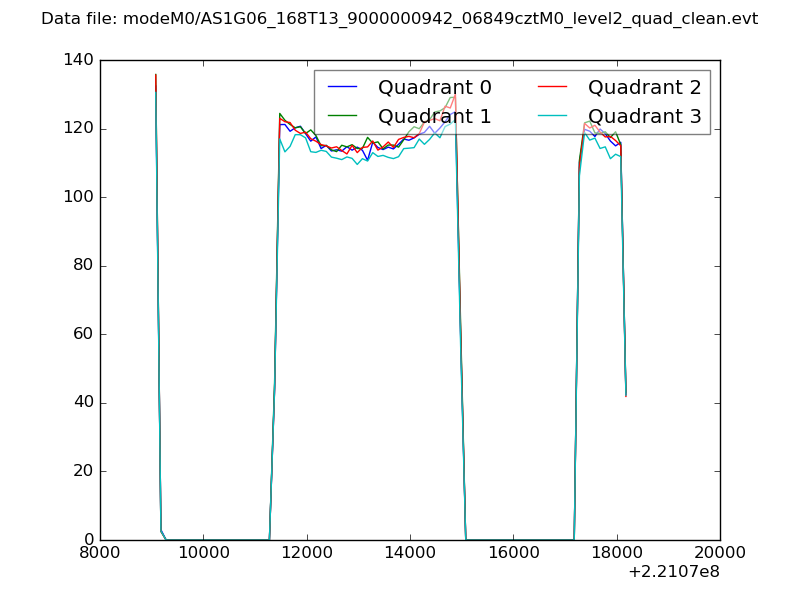
| Quadrant-wise count rates Data is divided into 100 sec bins |
 |
|
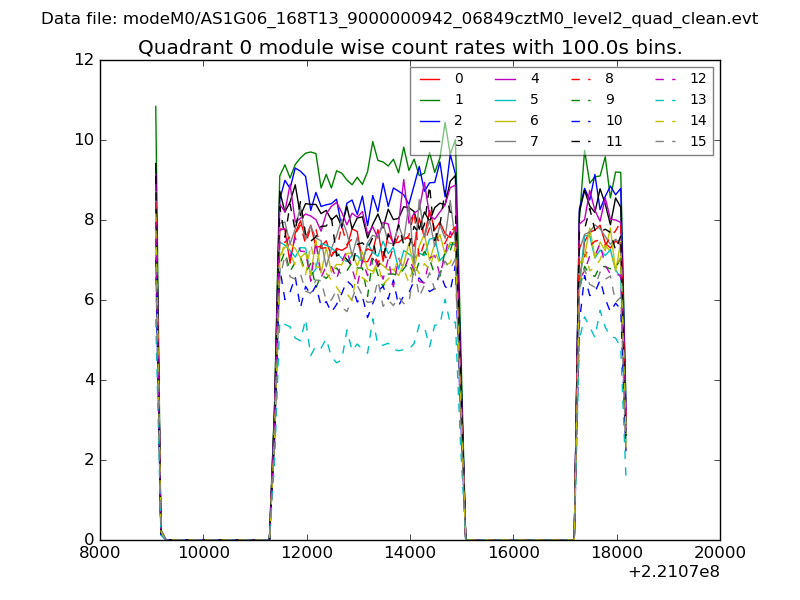
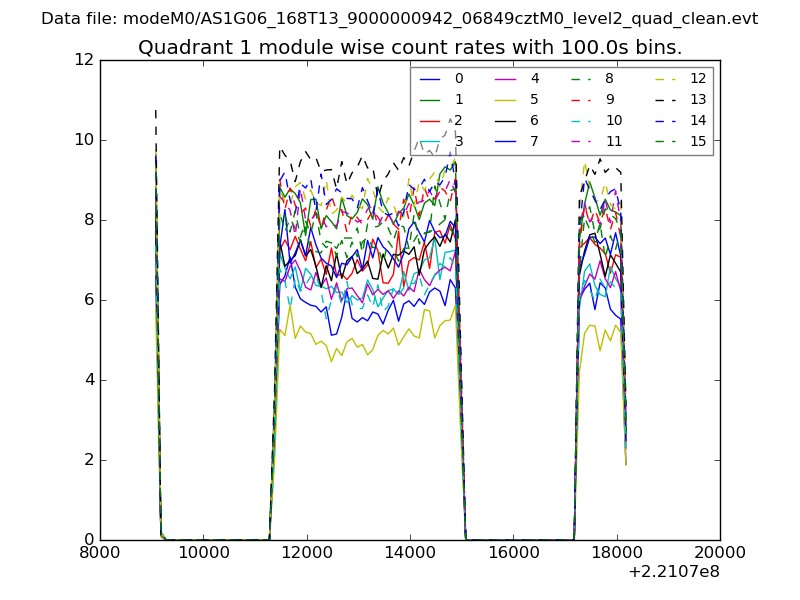
| Module-wise count rates for Quadrant A Data is divided into 100 sec bins |
 |
 |
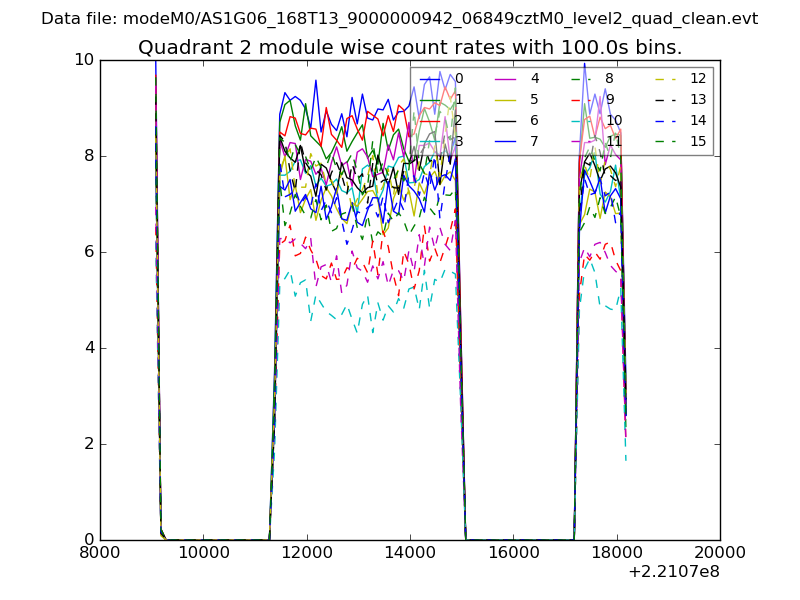
| Module-wise count rates for Quadrant B Data is divided into 100 sec bins |
 |
 |
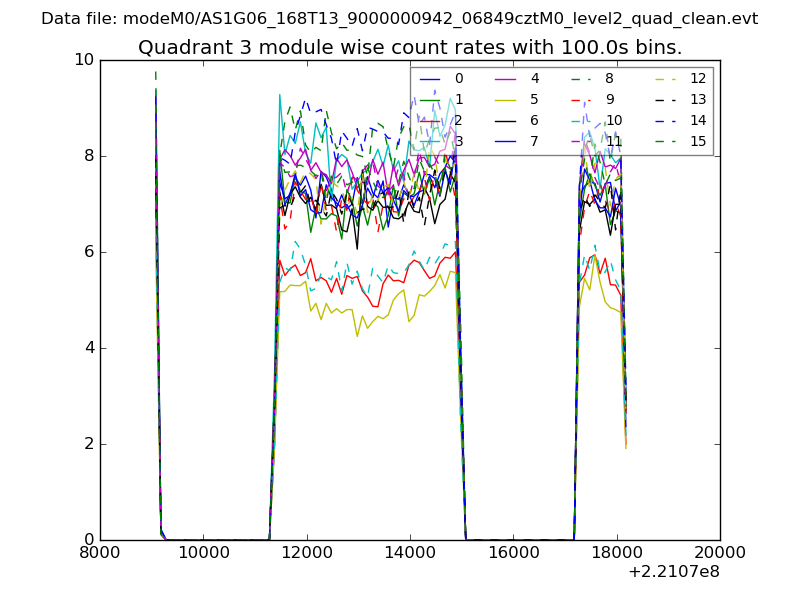
| Module-wise count rates for Quadrant C Data is divided into 100 sec bins |
 |
 |
| Module-wise count rates for Quadrant D Data is divided into 100 sec bins |
 |
 |
| Parameter | Plot |
|---|---|
| CZT HV Monitor | 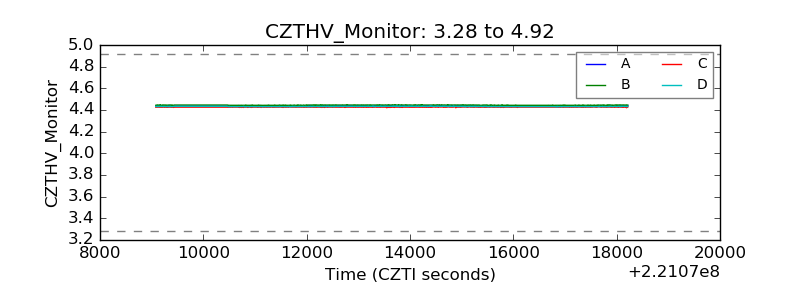 |
| D_VDD | 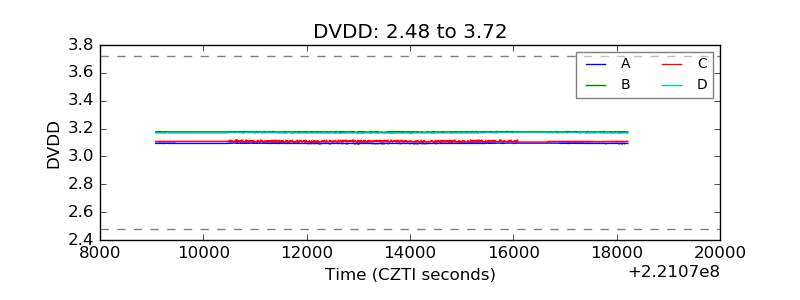 |
| Temperature 1 | 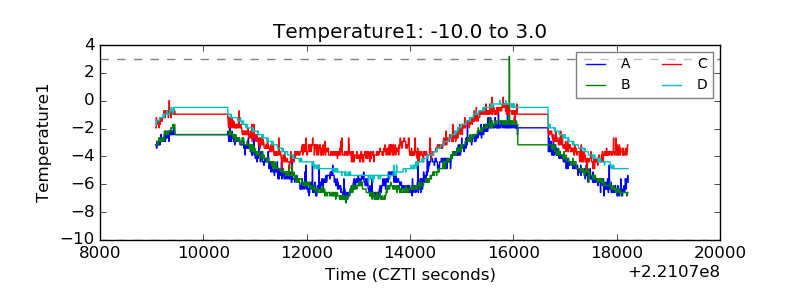 |
| Veto HV Monitor | 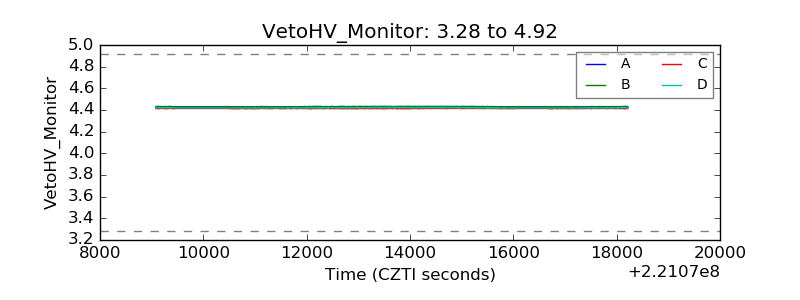 |
| Veto LLD | 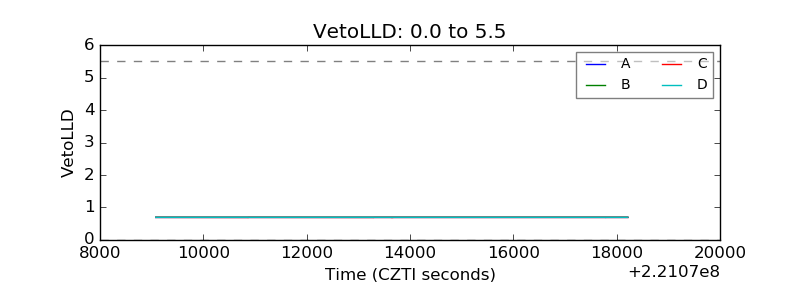 |
| Alpha Counter | 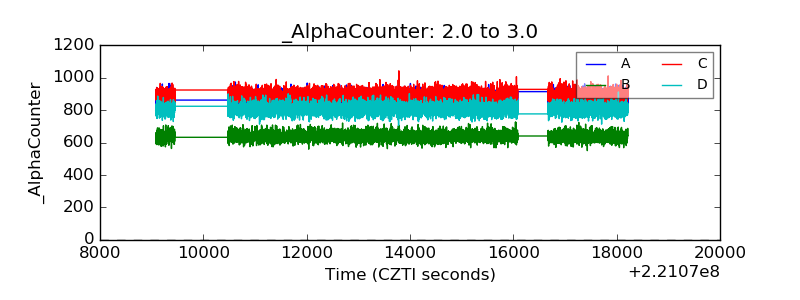 |
| _CPM_Rate | 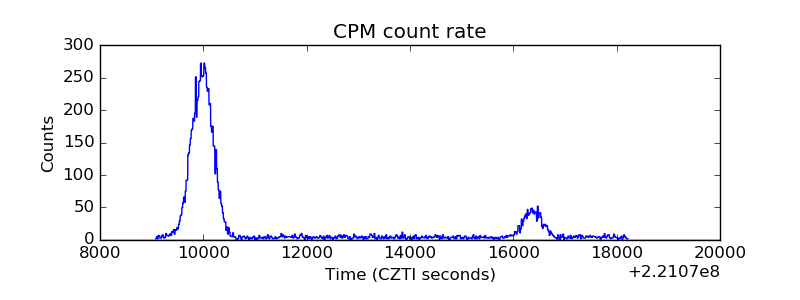 |
| CZT Counter | 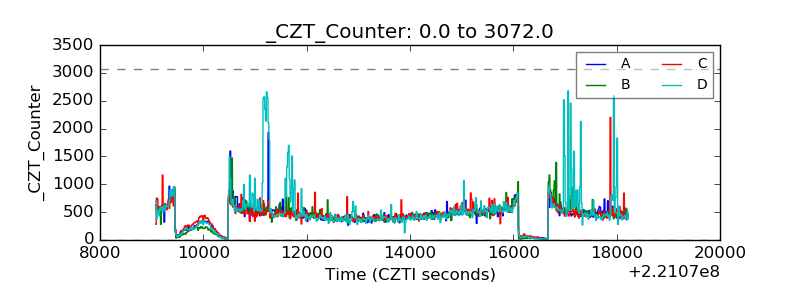 |
| +2.5 Volts monitor |  |
| +5 Volts monitor |  |
| _ROLL_ROT | 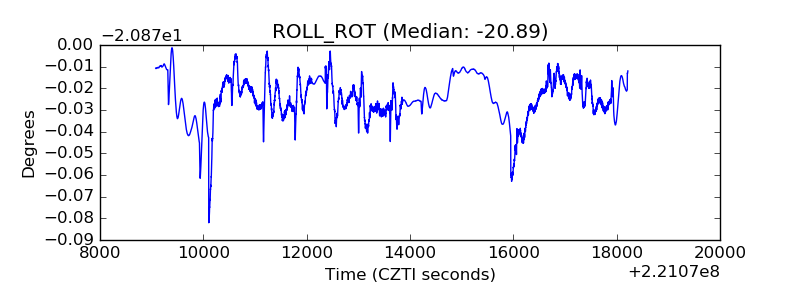 |
| _Roll_DEC | 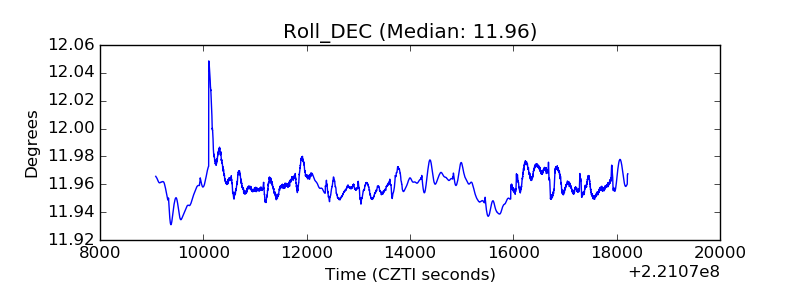 |
| _Roll_RA | 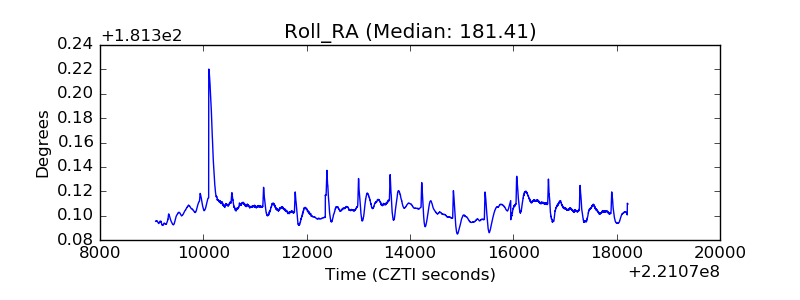 |
| Veto Counter | 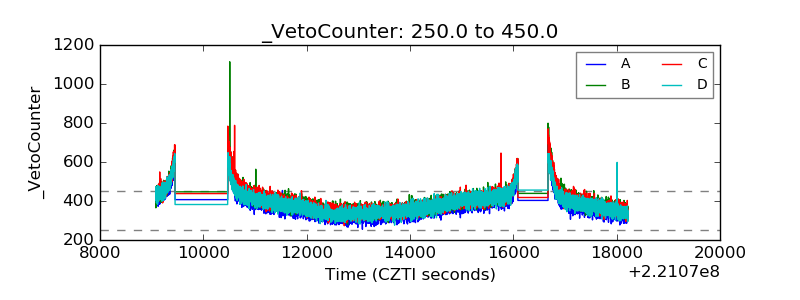 |