| Param | Original file | Final file |
|---|---|---|
| Filename | modeM0/AS1G06_168T13_9000000942_06850cztM0_level2.evt | modeM0/AS1G06_168T13_9000000942_06850cztM0_level2_quad_clean.evt |
| Size (bytes) | 160,824,960 | 24,796,800 |
| Size | 153.4 MB | 23.6 MB |
| Events in quadrant A | 1,102,417 | 148,980 |
| Events in quadrant B | 1,158,642 | 150,538 |
| Events in quadrant C | 1,113,215 | 149,409 |
| Events in quadrant D | 1,346,158 | 144,120 |
| Mode SS | |||
|---|---|---|---|
| Quadrant | BADHDUFLAG | Total packets | Discarded packets |
| A | 0 | 44 | 0 |
| B | 0 | 44 | 0 |
| C | 0 | 44 | 0 |
| D | 0 | 44 | 0 |
| Mode M0 | |||
|---|---|---|---|
| Quadrant | BADHDUFLAG | Total packets | Discarded packets |
| A | 0 | 4705 | 1 |
| B | 0 | 4850 | 1 |
| C | 0 | 4762 | 1 |
| D | 0 | 5507 | 1 |
| Mode M9 | |||
|---|---|---|---|
| Quadrant | BADHDUFLAG | Total packets | Discarded packets |
| A | 0 | 6 | 0 |
| B | 0 | 6 | 0 |
| C | 0 | 6 | 0 |
| D | 0 | 6 | 0 |
| Quadrant | Total seconds | Saturated seconds | Saturation percentage |
|---|---|---|---|
| A | 2179 | 43 | 1.973382% |
| B | 2179 | 66 | 3.028912% |
| C | 2179 | 26 | 1.193208% |
| D | 2179 | 88 | 4.038550% |
Noise dominated data is calculated using 1-second bins in cleaned event files. If a bin has >2000 counts, and if more than 50% of those come from <1% of pixels, then it is considered to be noise-dominated and hence unusable.
| Quadrant | # 1 sec bins | Bins with >0 counts | Bins with >2000 counts | High rate bins dominated by noise | Noise dominated (total time) | Noise dominated (detector-on time) | Marked lightcurve |
|---|---|---|---|---|---|---|---|
| A | 2764 | 2180 | 0 | 0 | 0.00% | 0.00% | 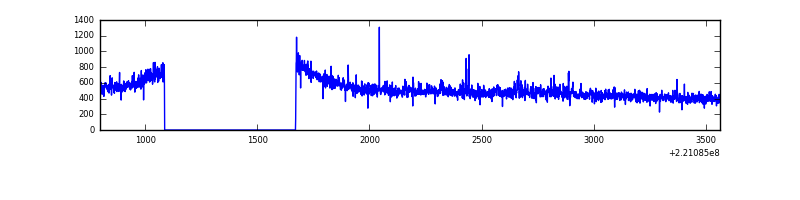 |
| B | 2764 | 2180 | 2 | 2 | 0.07% | 0.09% | 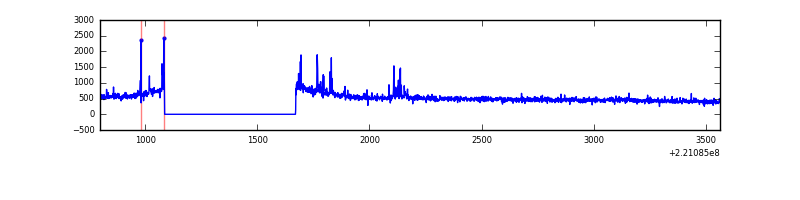 |
| C | 2764 | 2180 | 4 | 4 | 0.14% | 0.18% | 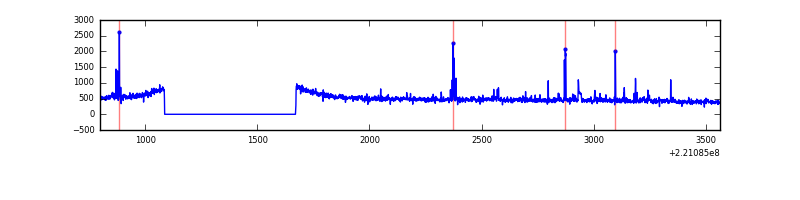 |
| D | 2764 | 2180 | 51 | 51 | 1.85% | 2.34% | 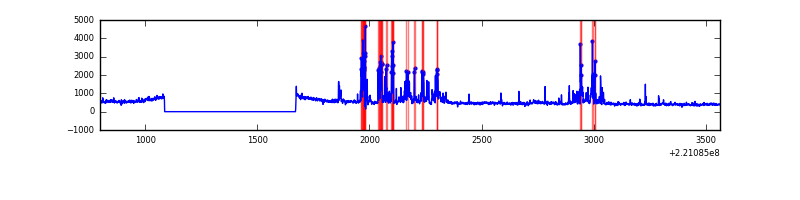 |
Top three noisy pixels from each quadrant. If the there are fewer than three noisy pixels in the level2.evt file, extra rows are filled as -1
| Pixel properties | Quadrant properties | ||||||
|---|---|---|---|---|---|---|---|
| Quadrant | DetID | PixID | Counts | Sigma | Mean | Median | Sigma |
| A | 15 | 239 | 21838 | 365.46 | 274 | 268 | 59.0 |
| A | 8 | 15 | 20936 | 350.18 | 274 | 268 | 59.0 |
| A | 0 | 226 | 2658 | 40.49 | 274 | 268 | 59.0 |
| B | 4 | 48 | 18505 | 325.41 | 279 | 271 | 56.0 |
| B | 0 | 219 | 13707 | 239.78 | 279 | 271 | 56.0 |
| B | 0 | 214 | 12001 | 209.34 | 279 | 271 | 56.0 |
| C | 10 | 22 | 30164 | 460.17 | 270 | 270 | 65.0 |
| C | 9 | 68 | 20070 | 304.78 | 270 | 270 | 65.0 |
| C | 9 | 247 | 6856 | 101.37 | 270 | 270 | 65.0 |
| D | 2 | 33 | 214133 | 3172.48 | 266 | 256 | 67.4 |
| D | 14 | 34 | 72327 | 1069.04 | 266 | 256 | 67.4 |
| D | 5 | 81 | 18611 | 272.26 | 266 | 256 | 67.4 |
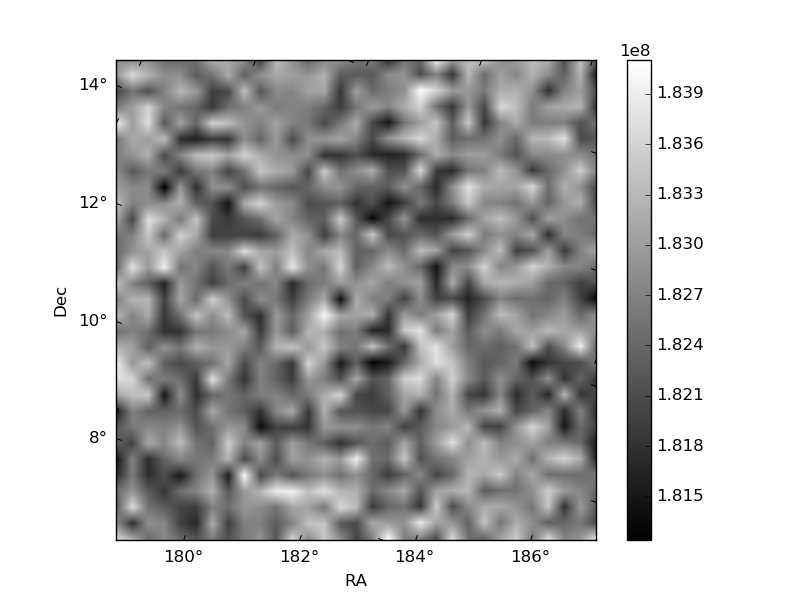
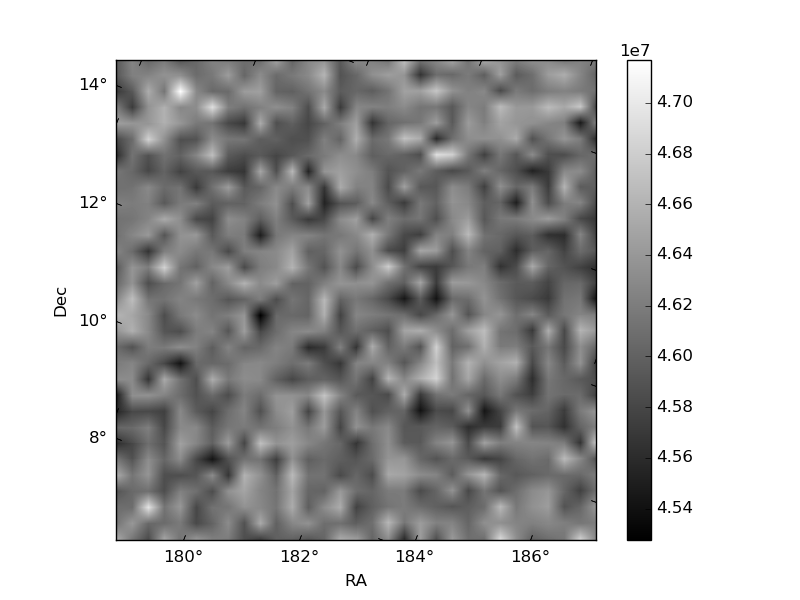
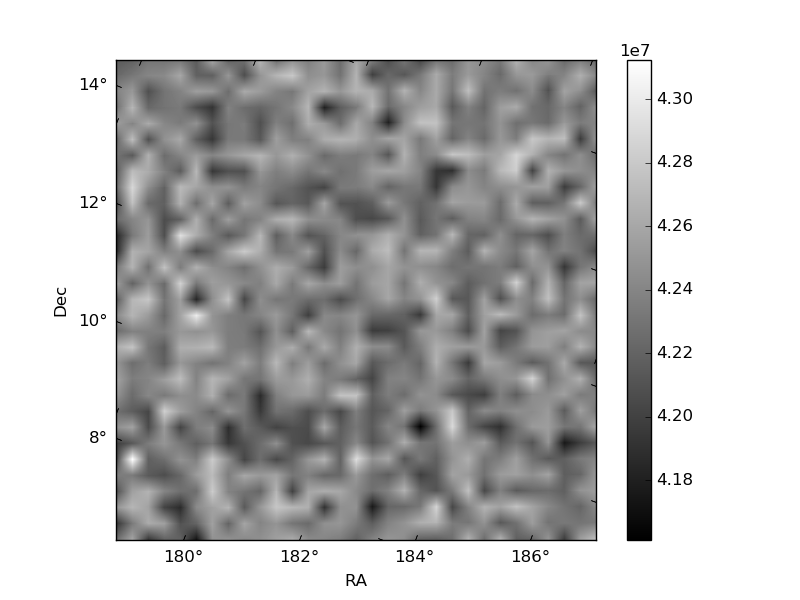
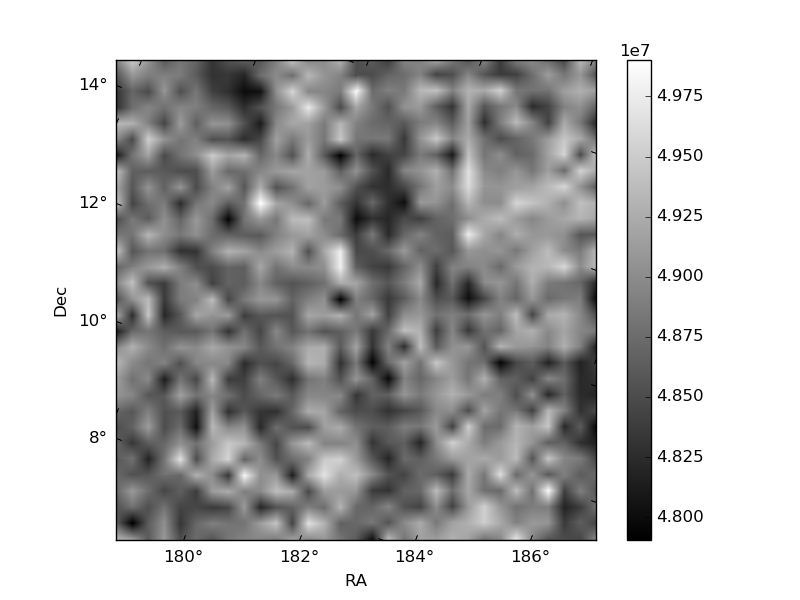
Histogram calculated using DETX and DETY for each event in the final _common_clean file
| Quadrant A | 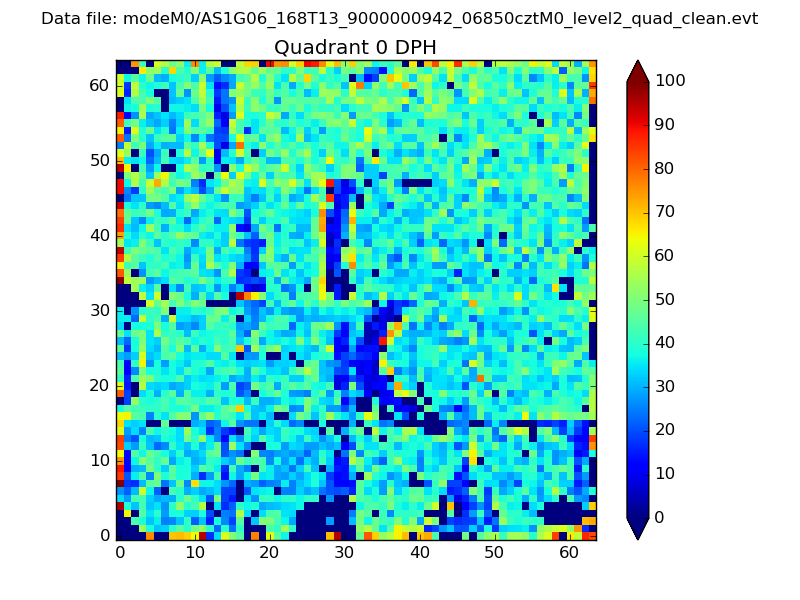 |
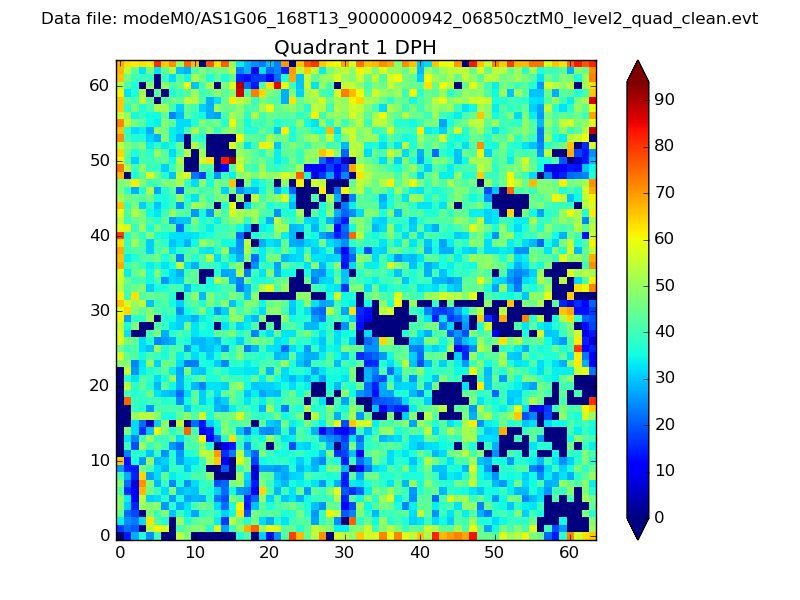 |
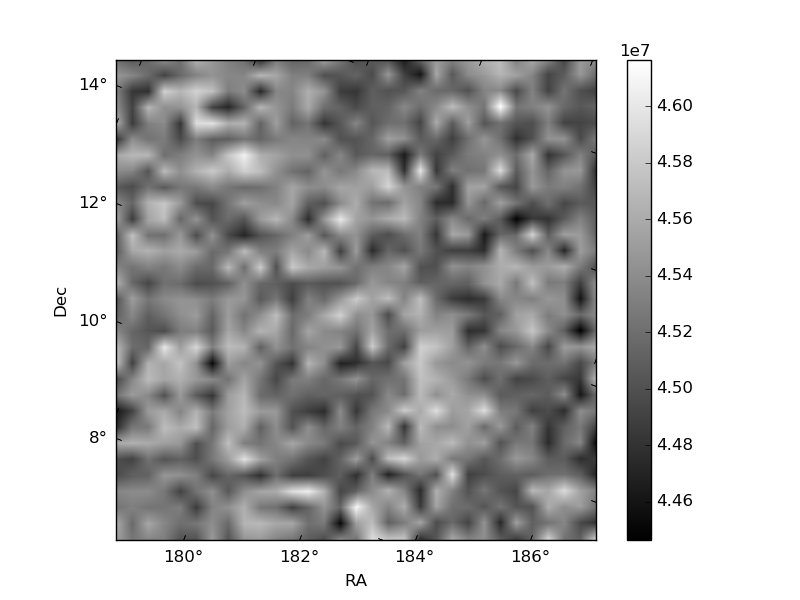
Quadrant B |
|---|---|---|---|
| Quadrant D | 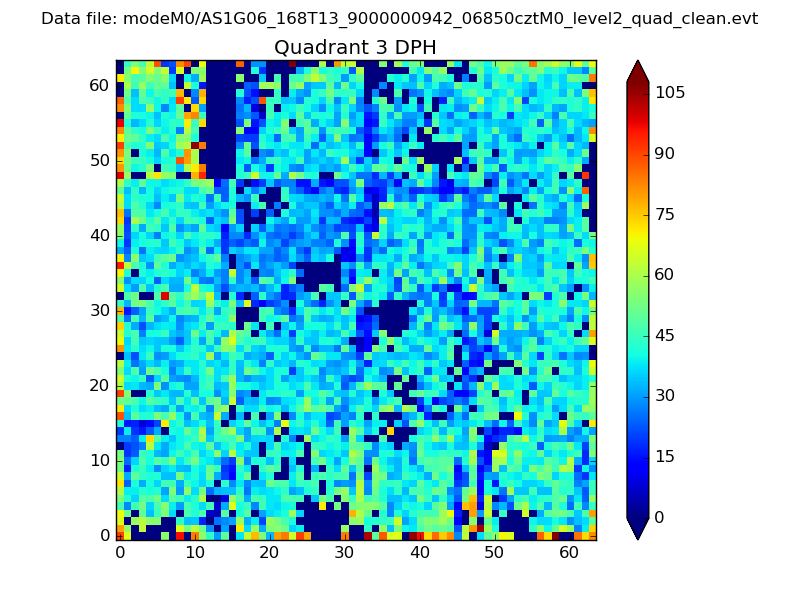 |
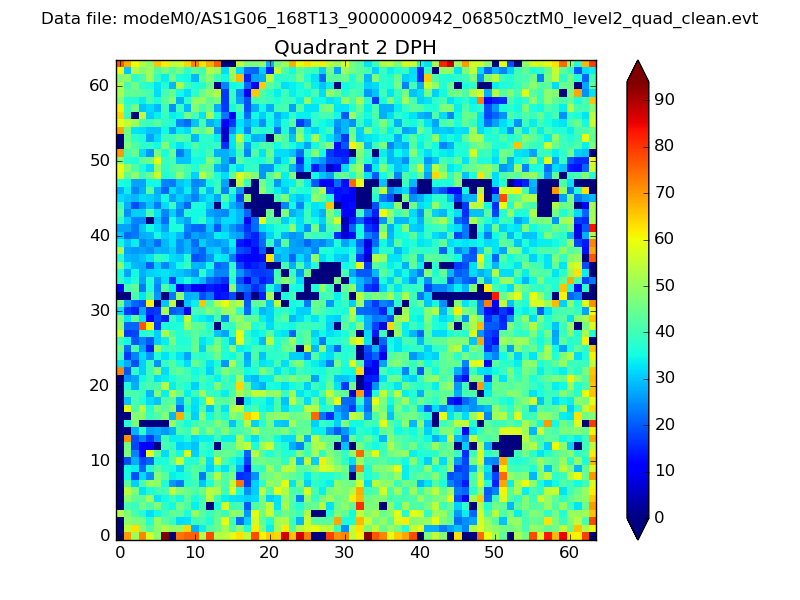 |
Quadrant C |
| Plot type | Count rate plots | Images |
|---|---|---|
| Comparison with Poisson distribution Blue bars denote a histogram of data divided into 1 sec bins. Red curve is a Poisson curve with rate = median count rate of data. |
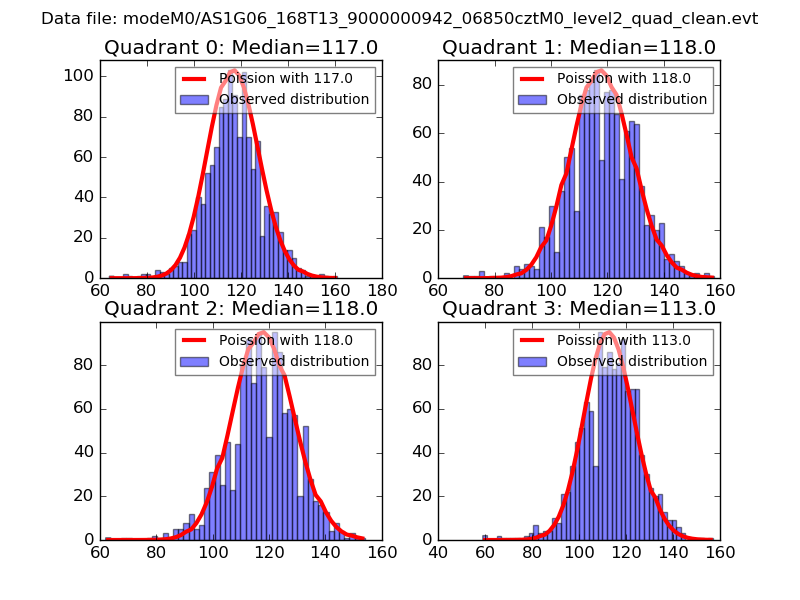 |
 |
| Quadrant-wise count rates Data is divided into 100 sec bins |
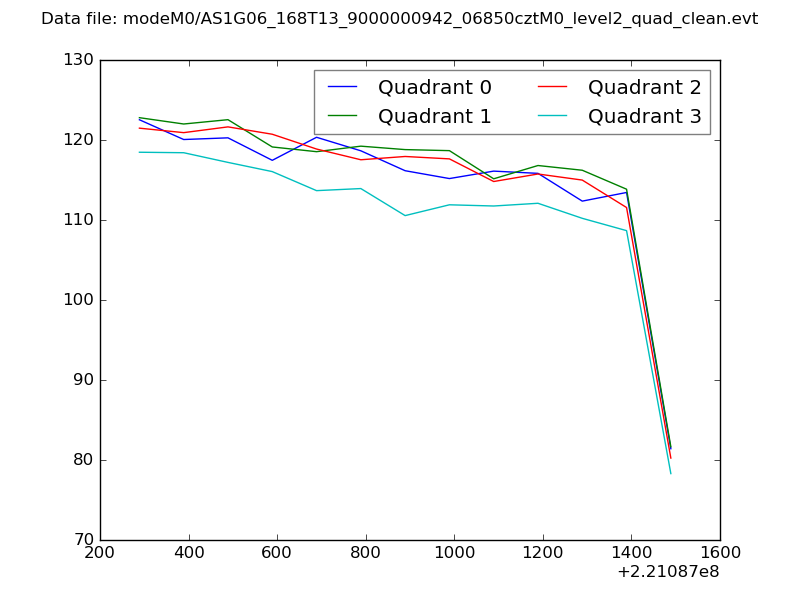 |
|
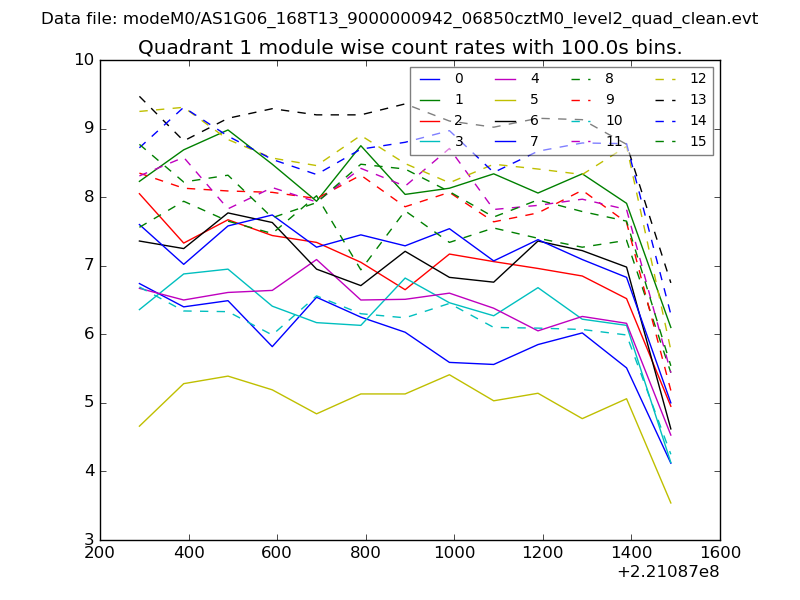
| Module-wise count rates for Quadrant A Data is divided into 100 sec bins |
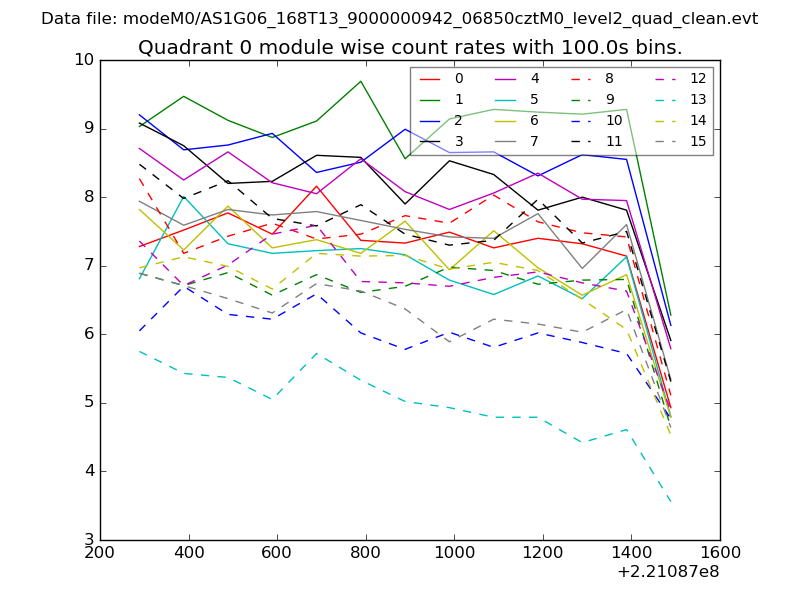 |
 |
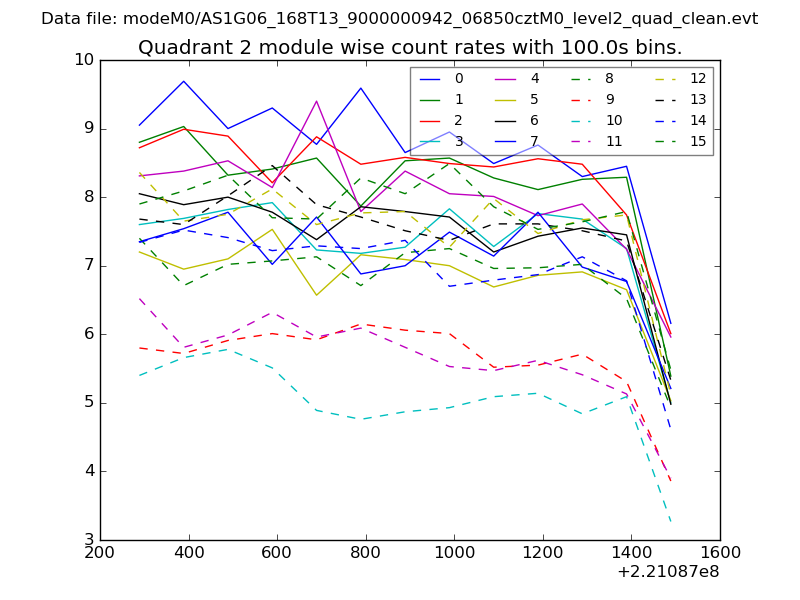
| Module-wise count rates for Quadrant B Data is divided into 100 sec bins |
 |
 |
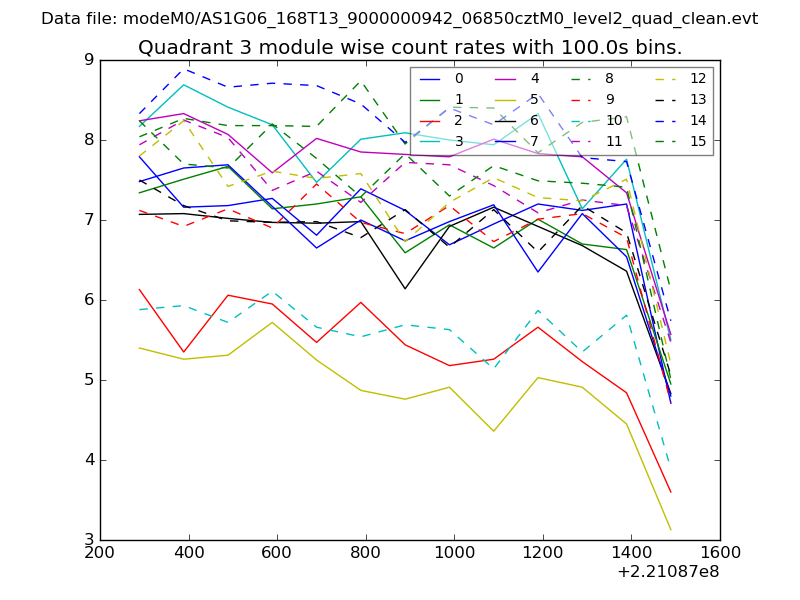
| Module-wise count rates for Quadrant C Data is divided into 100 sec bins |
 |
 |
| Module-wise count rates for Quadrant D Data is divided into 100 sec bins |
 |
 |
| Parameter | Plot |
|---|---|
| CZT HV Monitor | 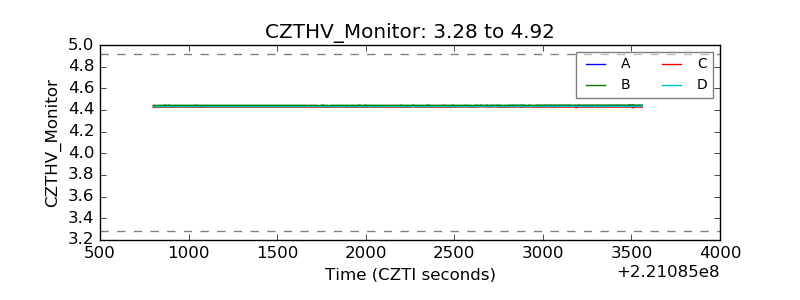 |
| D_VDD | 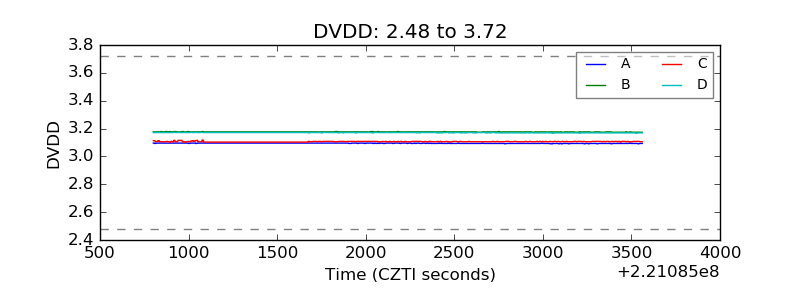 |
| Temperature 1 | 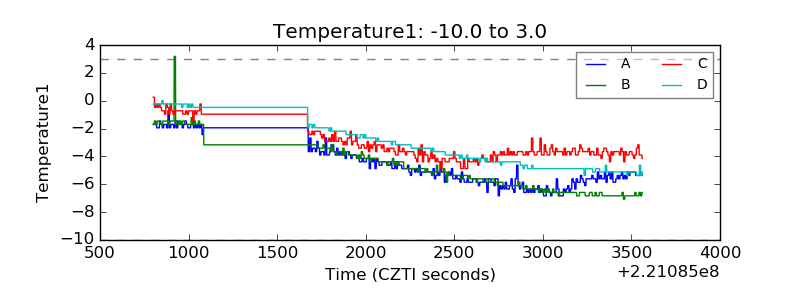 |
| Veto HV Monitor | 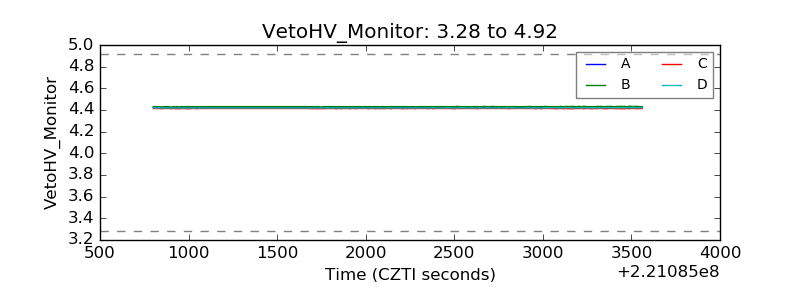 |
| Veto LLD | 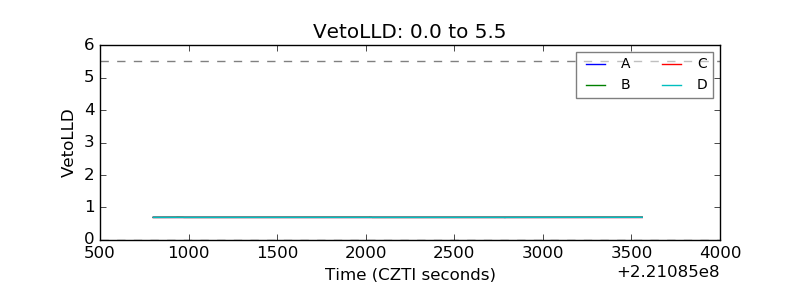 |
| Alpha Counter | 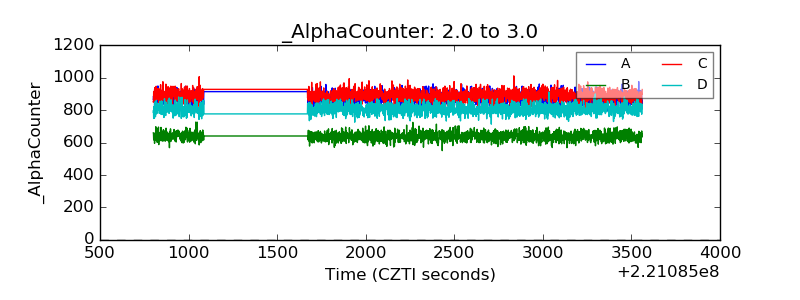 |
| _CPM_Rate | 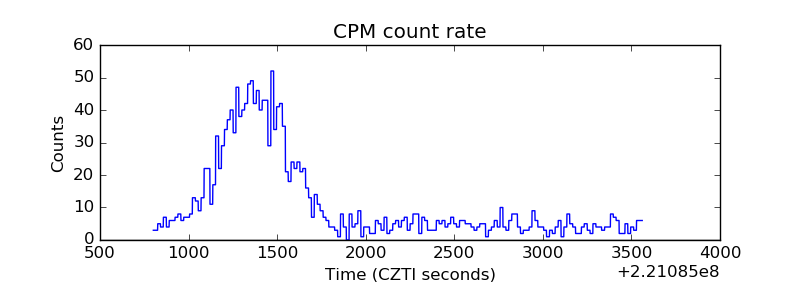 |
| CZT Counter | 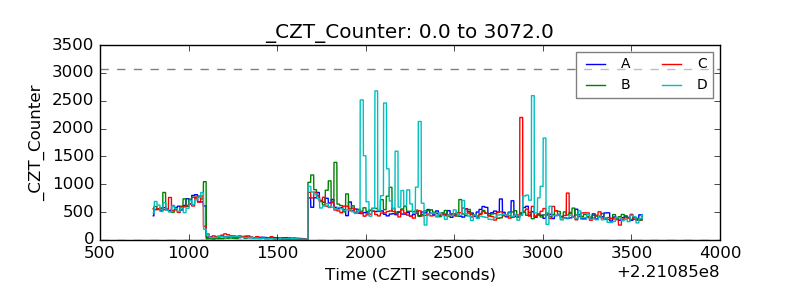 |
| +2.5 Volts monitor |  |
| +5 Volts monitor |  |
| _ROLL_ROT | 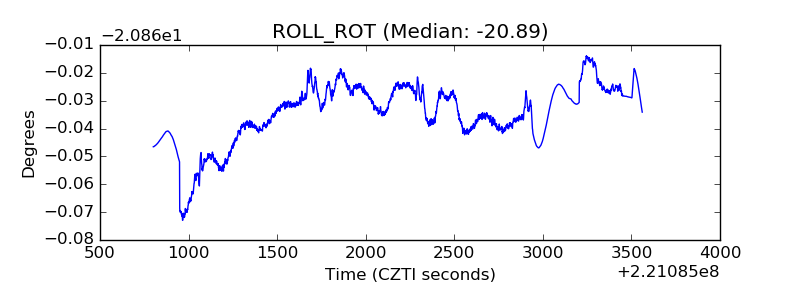 |
| _Roll_DEC | 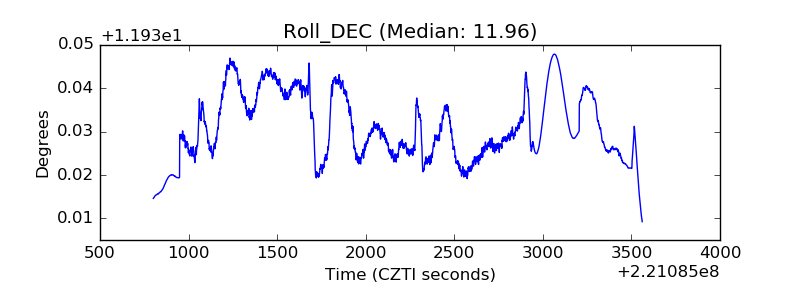 |
| _Roll_RA | 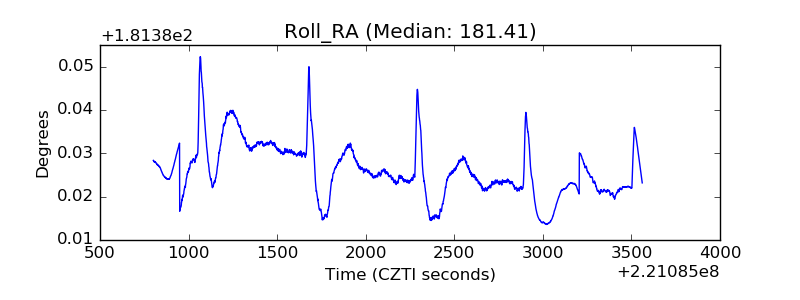 |
| Veto Counter | 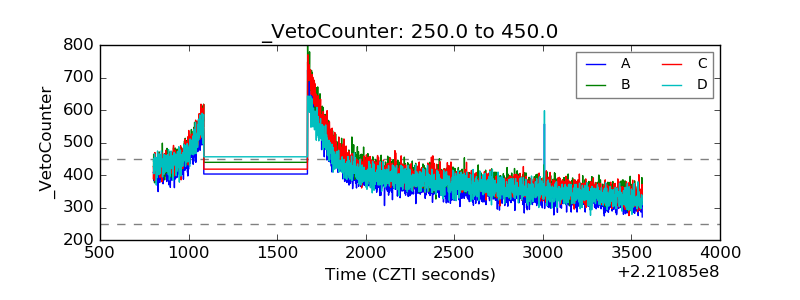 |