| Param | Original file | Final file |
|---|---|---|
| Filename | modeM0/AS1A02_005T01_9000000948cztM0_level2.fits | modeM0/AS1A02_005T01_9000000948cztM0_level2_quad_clean.evt |
| Size (bytes) | 29,672,640 | 12,496,320 |
| Size | 28.3 MB | 11.9 MB |
| Events in quadrant A | 181,542 | 44,619 |
| Events in quadrant B | 175,990 | 45,567 |
| Events in quadrant C | 181,626 | 43,800 |
| Events in quadrant D | 156,436 | 40,036 |
| Mode SS | |||
|---|---|---|---|
| Quadrant | BADHDUFLAG | Total packets | Discarded packets |
| A | 0 | 60 | 0 |
| B | 0 | 60 | 0 |
| C | 0 | 60 | 0 |
| D | 0 | 60 | 0 |
| Mode M0 | |||
|---|---|---|---|
| Quadrant | BADHDUFLAG | Total packets | Discarded packets |
| A | 0 | 5991 | 0 |
| B | 0 | 6344 | 0 |
| C | 0 | 6233 | 0 |
| D | 0 | 6393 | 0 |
| Mode M9 | |||
|---|---|---|---|
| Quadrant | BADHDUFLAG | Total packets | Discarded packets |
| A | 0 | 13 | 0 |
| B | 0 | 13 | 0 |
| C | 0 | 13 | 0 |
| D | 0 | 13 | 0 |
| Quadrant | Total seconds | Saturated seconds | Saturation percentage |
|---|---|---|---|
| A | 2841 | 27 | 0.950370% |
| B | 2841 | 27 | 0.950370% |
| C | 2841 | 24 | 0.844773% |
| D | 2841 | 56 | 1.971137% |
Noise dominated data is calculated using 1-second bins in cleaned event files. If a bin has >2000 counts, and if more than 50% of those come from <1% of pixels, then it is considered to be noise-dominated and hence unusable.
| Quadrant | # 1 sec bins | Bins with >0 counts | Bins with >2000 counts | High rate bins dominated by noise | Noise dominated (total time) | Noise dominated (detector-on time) | Marked lightcurve |
|---|---|---|---|---|---|---|---|
| A | 4136 | 2841 | 0 | 0 | 0.00% | 0.00% |  |
| B | 4136 | 2841 | 0 | 0 | 0.00% | 0.00% |  |
| C | 4136 | 2841 | 0 | 0 | 0.00% | 0.00% |  |
| D | 4136 | 2841 | 0 | 0 | 0.00% | 0.00% |  |
Top three noisy pixels from each quadrant. If the there are fewer than three noisy pixels in the level2.evt file, extra rows are filled as -1
| Pixel properties | Quadrant properties | ||||||
|---|---|---|---|---|---|---|---|
| Quadrant | DetID | PixID | Counts | Sigma | Mean | Median | Sigma |
| A | 0 | 29 | 200 | 11.41 | 47 | 44 | 13.7 |
| A | 0 | 30 | 163 | 8.7 | 47 | 44 | 13.7 |
| A | 7 | 110 | 150 | 7.75 | 47 | 44 | 13.7 |
| B | 2 | 9 | 155 | 9.51 | 46 | 44 | 11.7 |
| B | 3 | 17 | 139 | 8.14 | 46 | 44 | 11.7 |
| B | 3 | 16 | 128 | 7.19 | 46 | 44 | 11.7 |
| C | 1 | 80 | 148 | 7.25 | 47 | 45 | 14.2 |
| C | 1 | 81 | 146 | 7.11 | 47 | 45 | 14.2 |
| C | 3 | 158 | 140 | 6.69 | 47 | 45 | 14.2 |
| D | 6 | 231 | 123 | 6.25 | 44 | 40 | 13.3 |
| D | 3 | 31 | 121 | 6.1 | 44 | 40 | 13.3 |
| D | 4 | 160 | 119 | 5.95 | 44 | 40 | 13.3 |
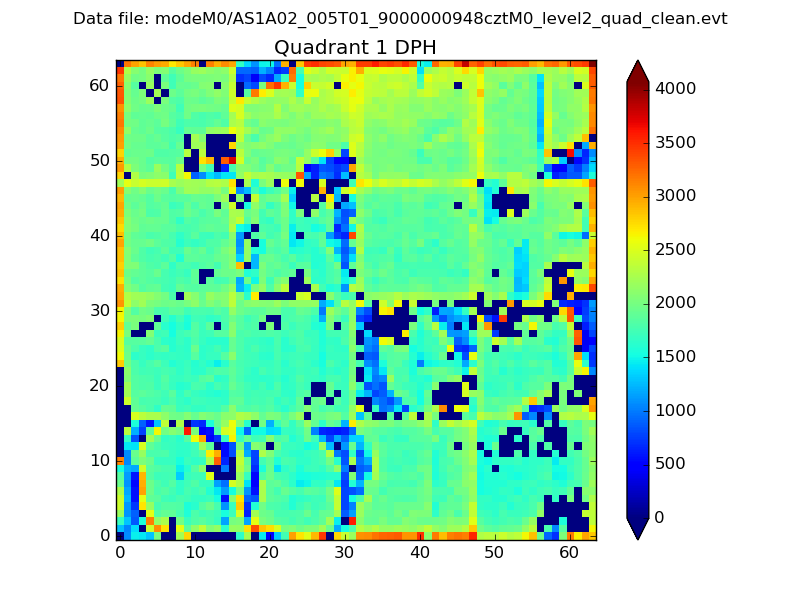
Histogram calculated using DETX and DETY for each event in the final _common_clean file
| Quadrant A |  |
 |
Quadrant B |
|---|---|---|---|
| Quadrant D |  |
 |
Quadrant C |
| Plot type | Count rate plots | Images |
|---|---|---|
| Comparison with Poisson distribution Blue bars denote a histogram of data divided into 1 sec bins. Red curve is a Poisson curve with rate = median count rate of data. |
 |
 |
| Quadrant-wise count rates Data is divided into 100 sec bins |
 |
|
| Module-wise count rates for Quadrant A Data is divided into 100 sec bins |
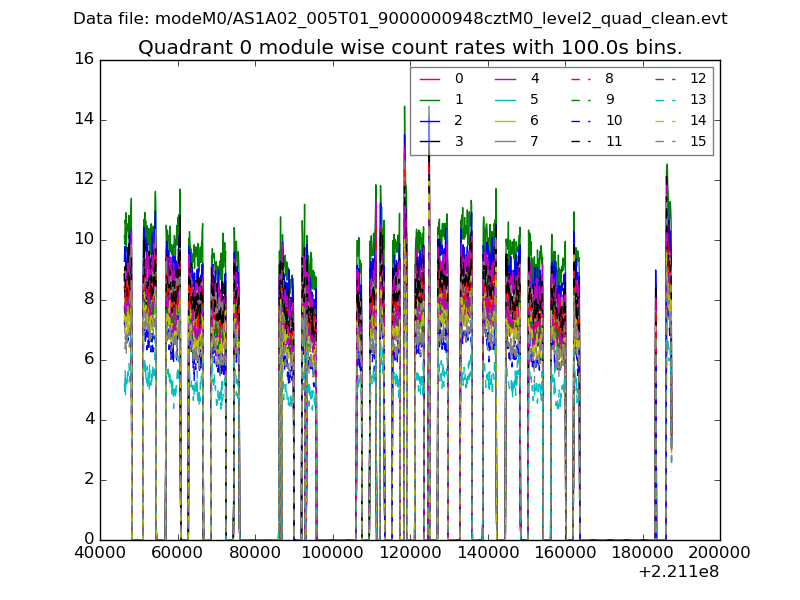 |
 |
| Module-wise count rates for Quadrant B Data is divided into 100 sec bins |
 |
 |
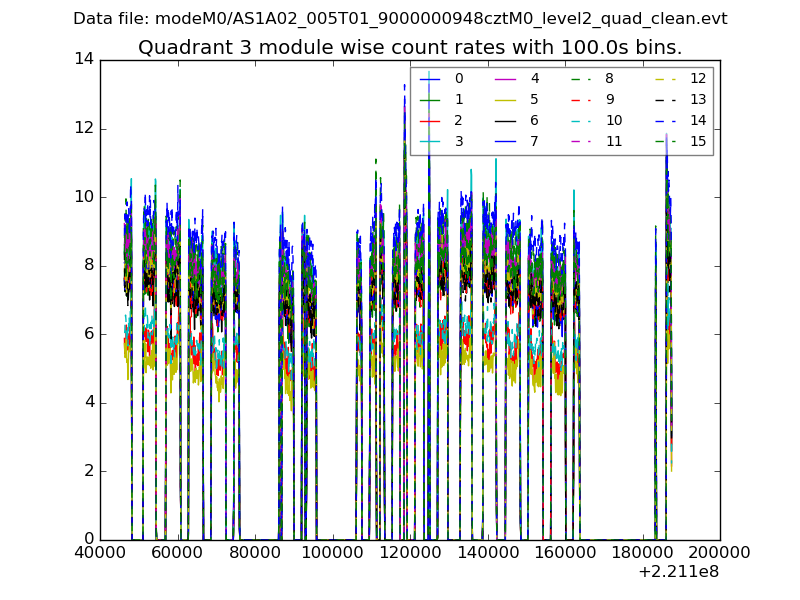
| Module-wise count rates for Quadrant C Data is divided into 100 sec bins |
 |
 |
| Module-wise count rates for Quadrant D Data is divided into 100 sec bins |
 |
 |
| Parameter | Plot |
|---|---|
| CZT HV Monitor |  |
| D_VDD |  |
| Temperature 1 |  |
| Veto HV Monitor |  |
| Veto LLD |  |
| Alpha Counter |  |
| _CPM_Rate |  |
| CZT Counter |  |
| +2.5 Volts monitor |  |
| +5 Volts monitor |  |
| _ROLL_ROT |  |
| _Roll_DEC | 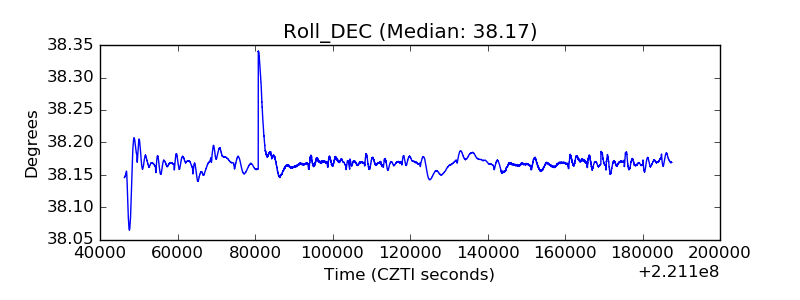 |
| _Roll_RA |  |
| Veto Counter |  |