| Param | Original file | Final file |
|---|---|---|
| Filename | modeM0/AS1A02_005T01_9000000948_06860cztM0_level2.evt | modeM0/AS1A02_005T01_9000000948_06860cztM0_level2_quad_clean.evt |
| Size (bytes) | 250,977,600 | 40,988,160 |
| Size | 239.4 MB | 39.1 MB |
| Events in quadrant A | 1,757,405 | 250,858 |
| Events in quadrant B | 1,809,134 | 254,323 |
| Events in quadrant C | 1,774,671 | 251,940 |
| Events in quadrant D | 2,028,577 | 243,842 |
| Mode SS | |||
|---|---|---|---|
| Quadrant | BADHDUFLAG | Total packets | Discarded packets |
| A | 0 | 72 | 0 |
| B | 0 | 72 | 0 |
| C | 0 | 72 | 0 |
| D | 0 | 72 | 0 |
| Mode M0 | |||
|---|---|---|---|
| Quadrant | BADHDUFLAG | Total packets | Discarded packets |
| A | 0 | 7387 | 2 |
| B | 0 | 7574 | 1 |
| C | 0 | 7352 | 1 |
| D | 0 | 8258 | 1 |
| Mode M9 | |||
|---|---|---|---|
| Quadrant | BADHDUFLAG | Total packets | Discarded packets |
| A | 0 | 13 | 0 |
| B | 0 | 13 | 0 |
| C | 0 | 13 | 0 |
| D | 0 | 13 | 0 |
| Quadrant | Total seconds | Saturated seconds | Saturation percentage |
|---|---|---|---|
| A | 3371 | 52 | 1.542569% |
| B | 3371 | 58 | 1.720558% |
| C | 3371 | 60 | 1.779887% |
| D | 3371 | 72 | 2.135865% |
Noise dominated data is calculated using 1-second bins in cleaned event files. If a bin has >2000 counts, and if more than 50% of those come from <1% of pixels, then it is considered to be noise-dominated and hence unusable.
| Quadrant | # 1 sec bins | Bins with >0 counts | Bins with >2000 counts | High rate bins dominated by noise | Noise dominated (total time) | Noise dominated (detector-on time) | Marked lightcurve |
|---|---|---|---|---|---|---|---|
| A | 4726 | 3372 | 2 | 2 | 0.04% | 0.06% | 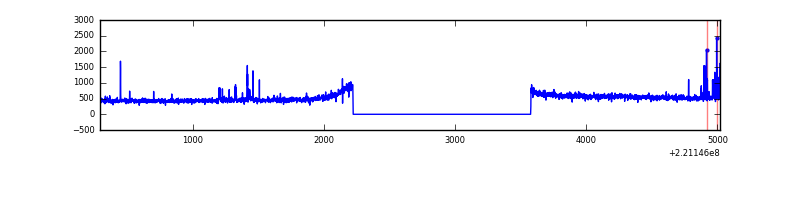 |
| B | 4726 | 3372 | 4 | 4 | 0.08% | 0.12% | 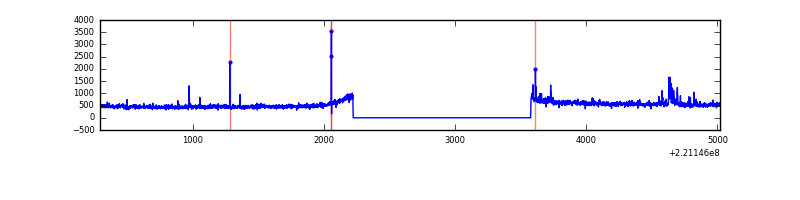 |
| C | 4726 | 3372 | 4 | 4 | 0.08% | 0.12% | 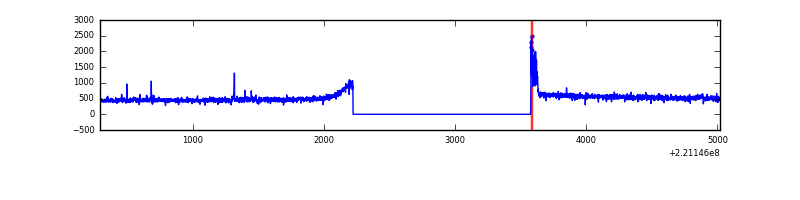 |
| D | 4726 | 3372 | 16 | 16 | 0.34% | 0.47% | 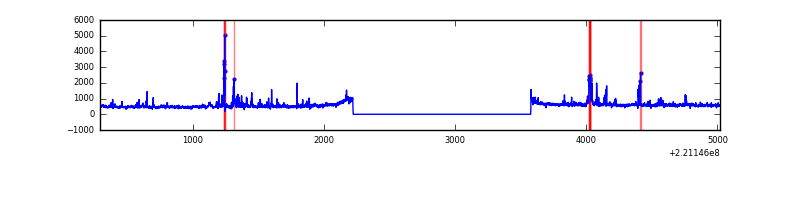 |
Top three noisy pixels from each quadrant. If the there are fewer than three noisy pixels in the level2.evt file, extra rows are filled as -1
| Pixel properties | Quadrant properties | ||||||
|---|---|---|---|---|---|---|---|
| Quadrant | DetID | PixID | Counts | Sigma | Mean | Median | Sigma |
| A | 13 | 251 | 52545 | 576.96 | 440 | 431 | 90.3 |
| A | 3 | 1 | 6307 | 65.05 | 440 | 431 | 90.3 |
| A | 13 | 248 | 5402 | 55.03 | 440 | 431 | 90.3 |
| B | 0 | 228 | 34492 | 400.56 | 442 | 434 | 85.0 |
| B | 0 | 219 | 27473 | 318.01 | 442 | 434 | 85.0 |
| B | 15 | 204 | 15416 | 176.2 | 442 | 434 | 85.0 |
| C | 9 | 16 | 45842 | 454.19 | 430 | 431 | 100.0 |
| C | 9 | 247 | 38113 | 376.88 | 430 | 431 | 100.0 |
| C | 9 | 68 | 7039 | 66.09 | 430 | 431 | 100.0 |
| D | 8 | 195 | 176946 | 1665.76 | 430 | 417 | 106.0 |
| D | 2 | 152 | 109812 | 1032.27 | 430 | 417 | 106.0 |
| D | 2 | 16 | 67658 | 634.5 | 430 | 417 | 106.0 |
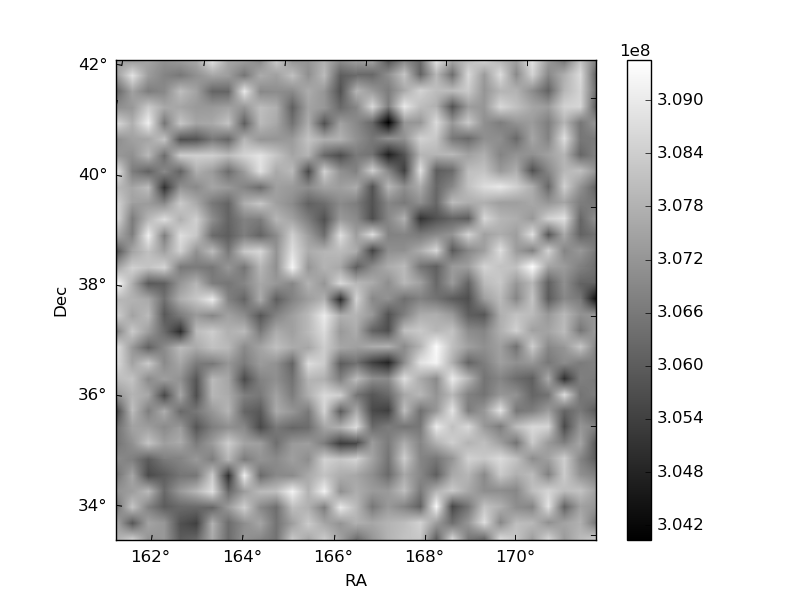
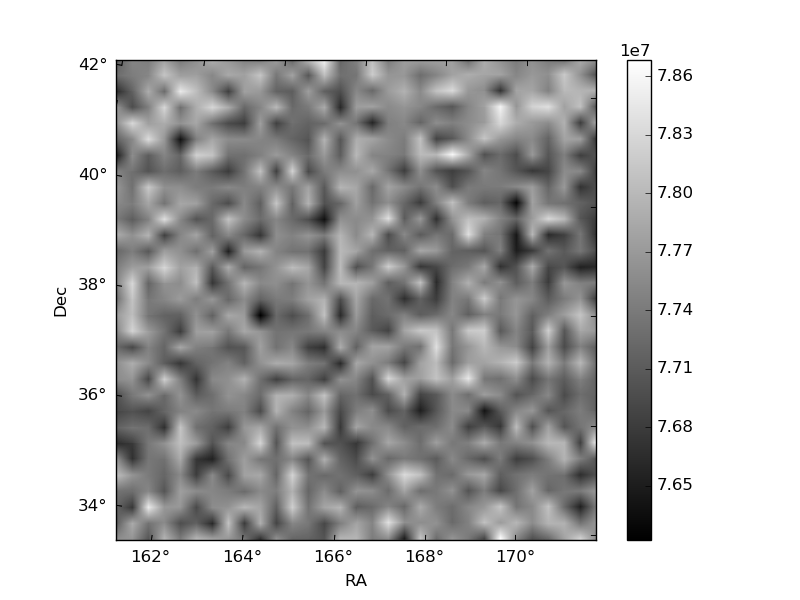
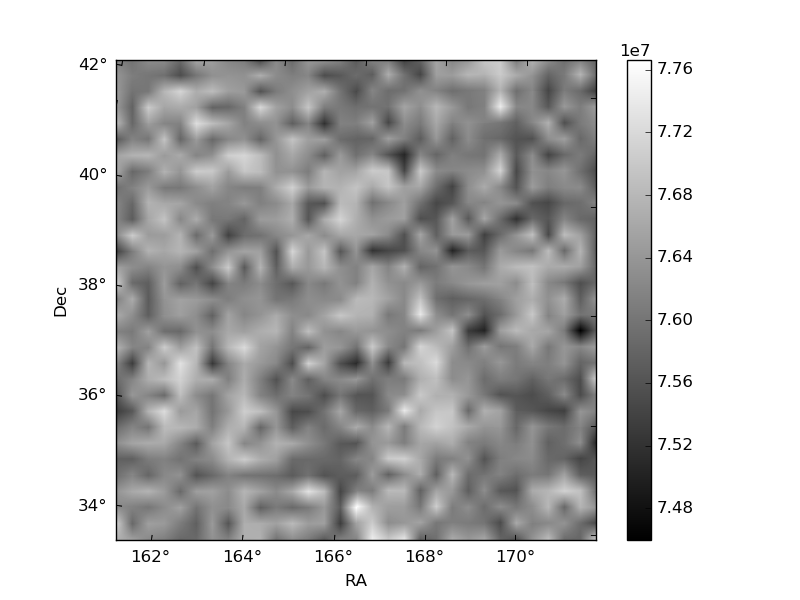
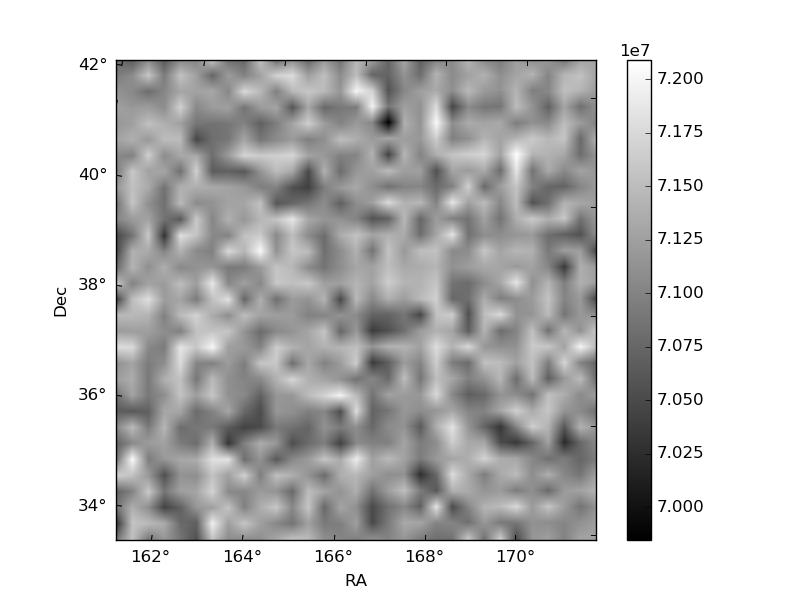
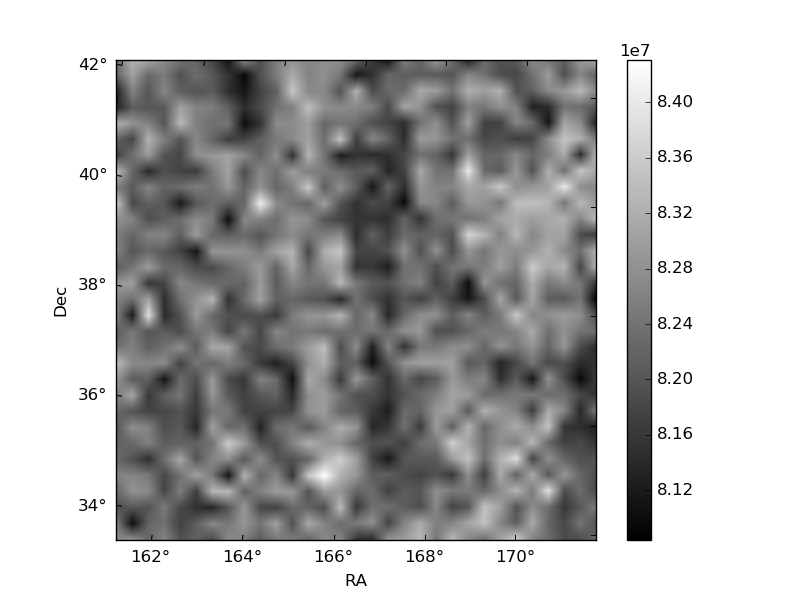
Histogram calculated using DETX and DETY for each event in the final _common_clean file
| Quadrant A | 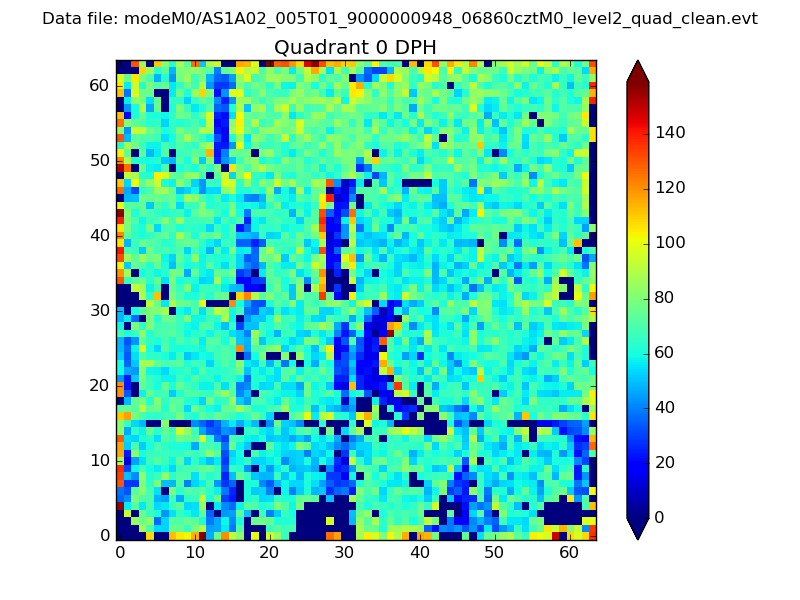 |
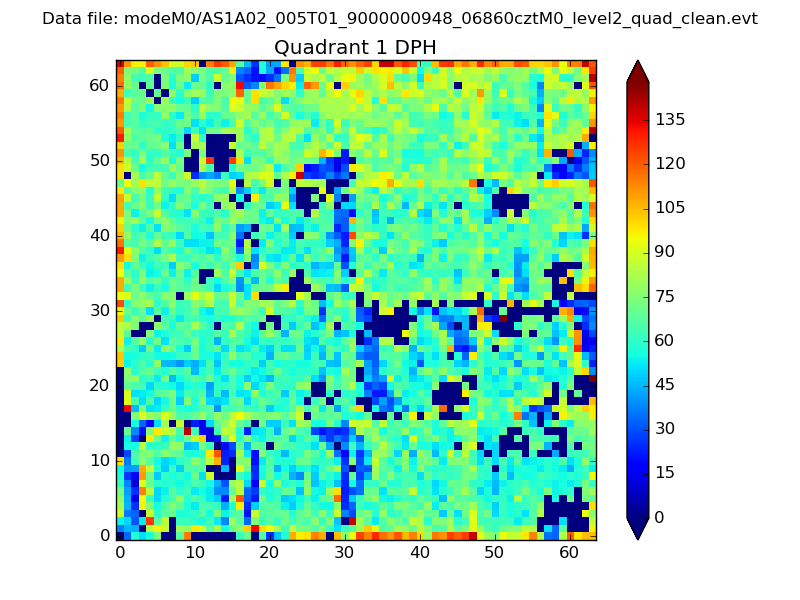 |
Quadrant B |
|---|---|---|---|
| Quadrant D | 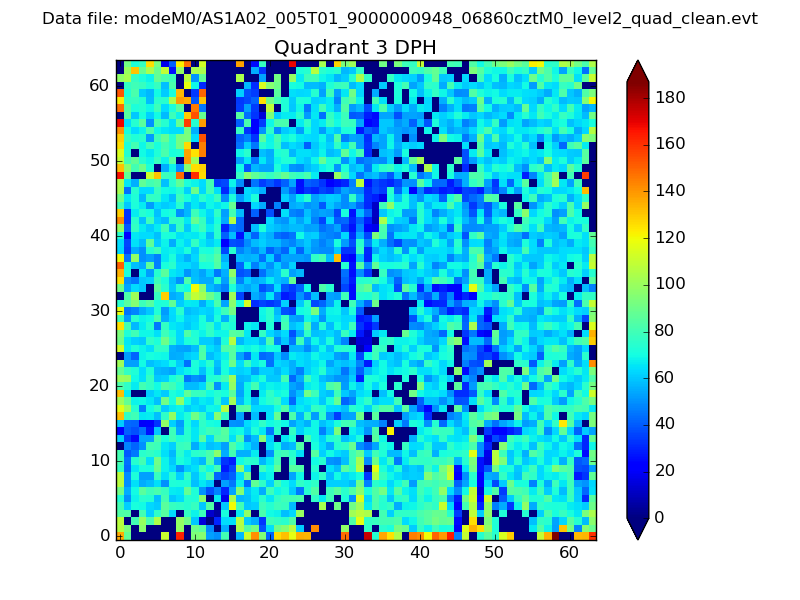 |
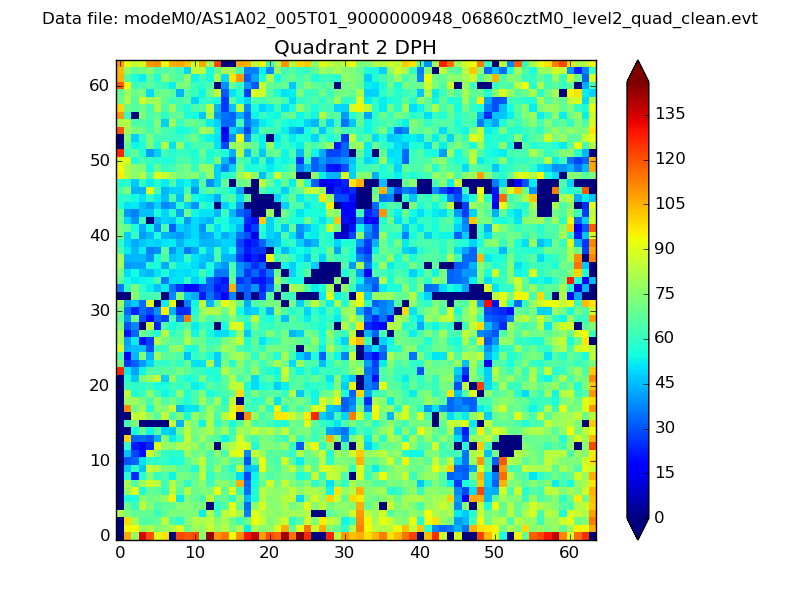 |
Quadrant C |
| Plot type | Count rate plots | Images |
|---|---|---|
| Comparison with Poisson distribution Blue bars denote a histogram of data divided into 1 sec bins. Red curve is a Poisson curve with rate = median count rate of data. |
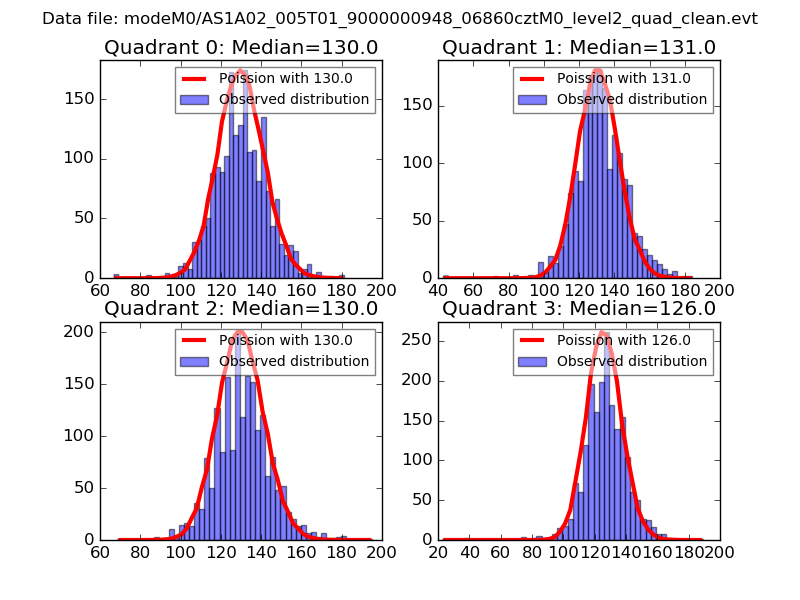 |
 |
| Quadrant-wise count rates Data is divided into 100 sec bins |
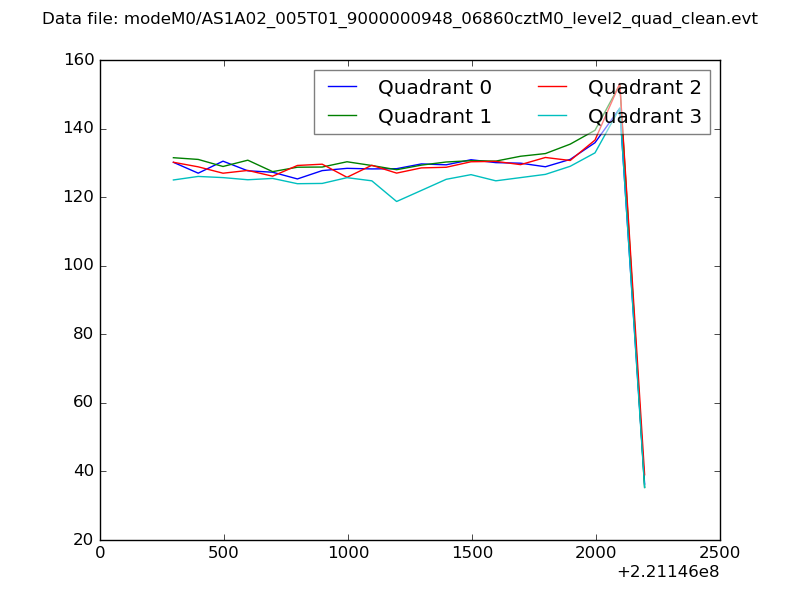 |
|
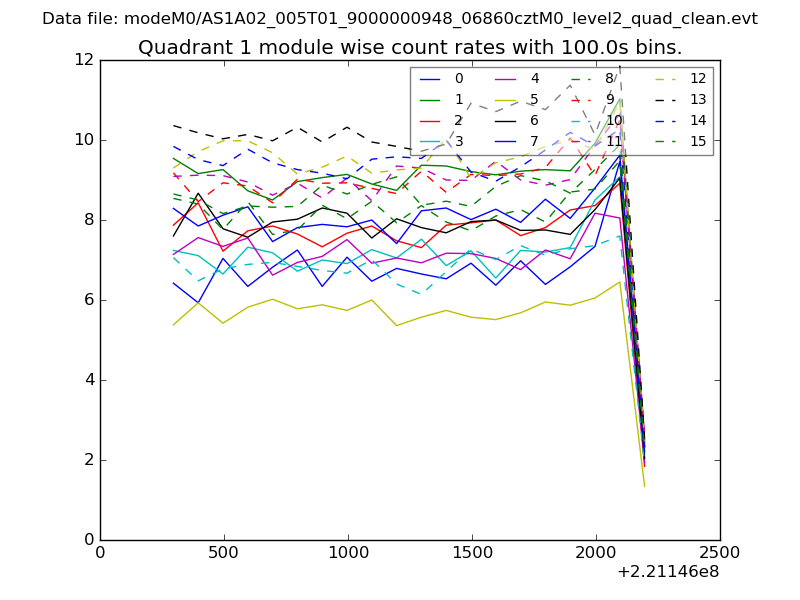
| Module-wise count rates for Quadrant A Data is divided into 100 sec bins |
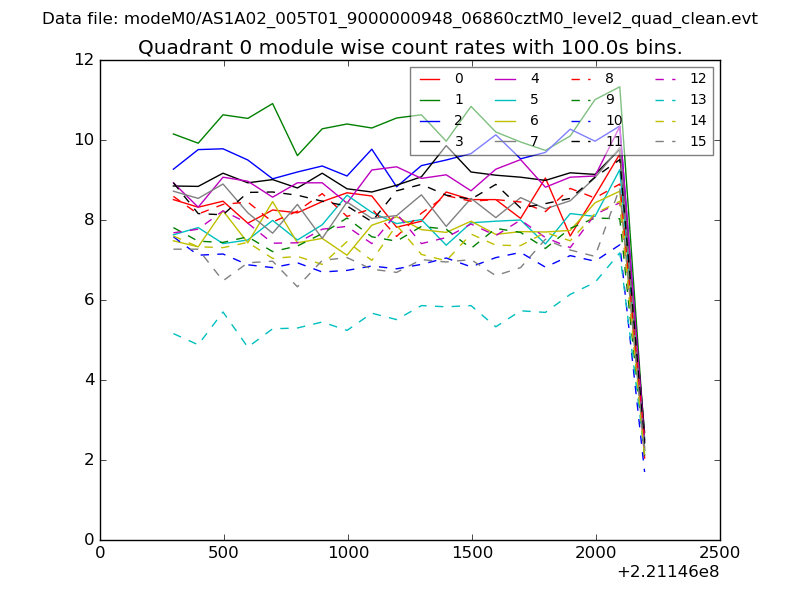 |
 |
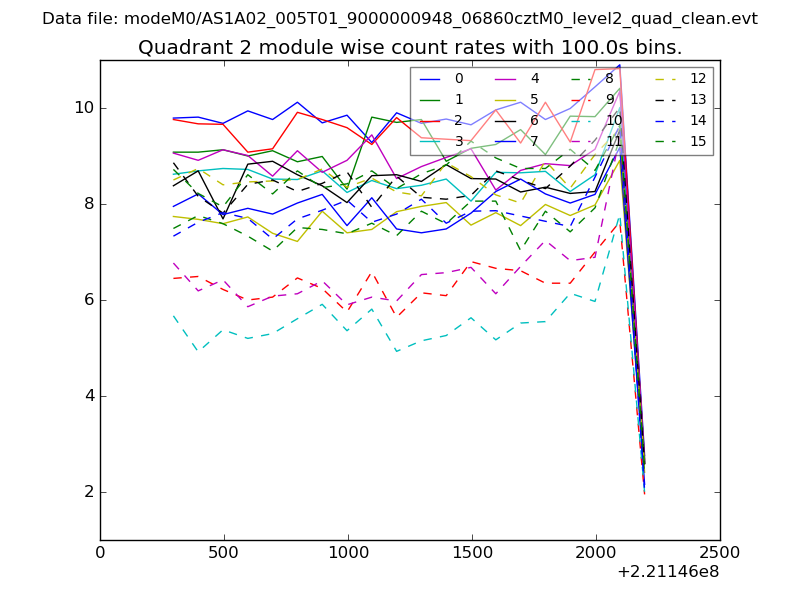
| Module-wise count rates for Quadrant B Data is divided into 100 sec bins |
 |
 |
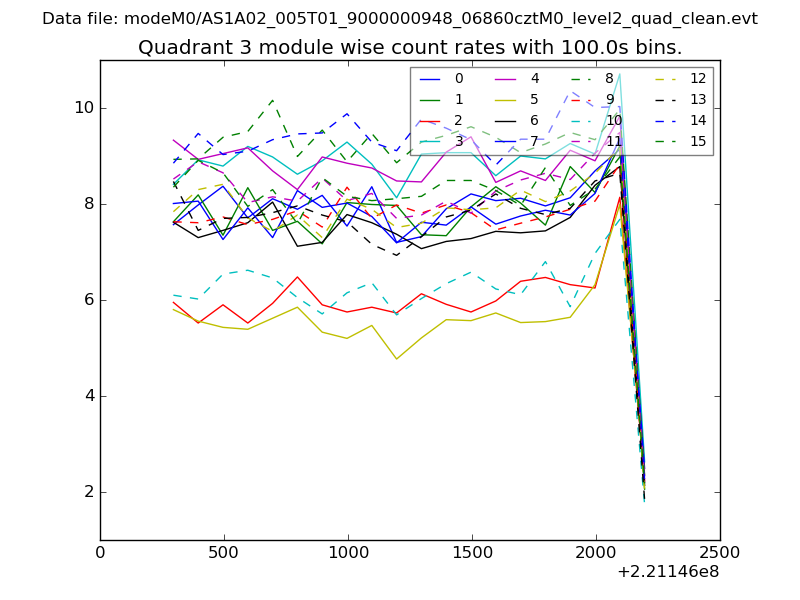
| Module-wise count rates for Quadrant C Data is divided into 100 sec bins |
 |
 |
| Module-wise count rates for Quadrant D Data is divided into 100 sec bins |
 |
 |
| Parameter | Plot |
|---|---|
| CZT HV Monitor | 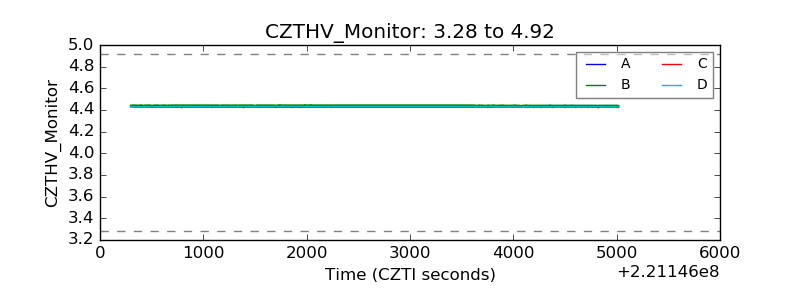 |
| D_VDD | 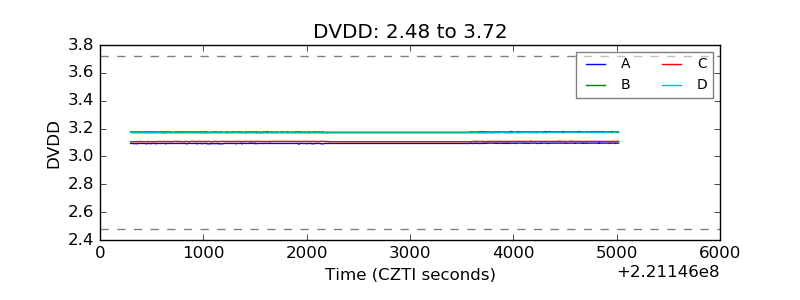 |
| Temperature 1 | 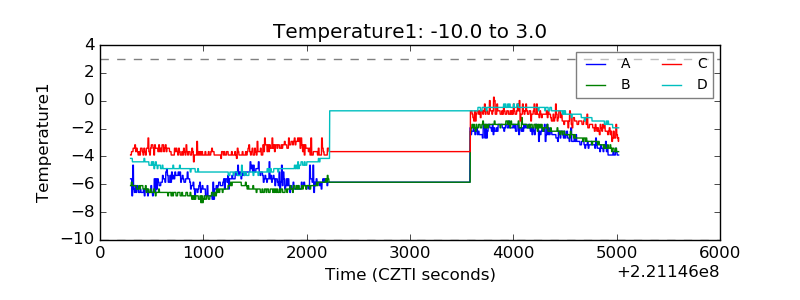 |
| Veto HV Monitor | 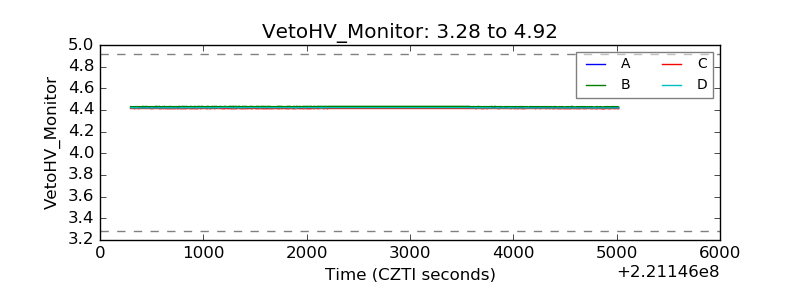 |
| Veto LLD | 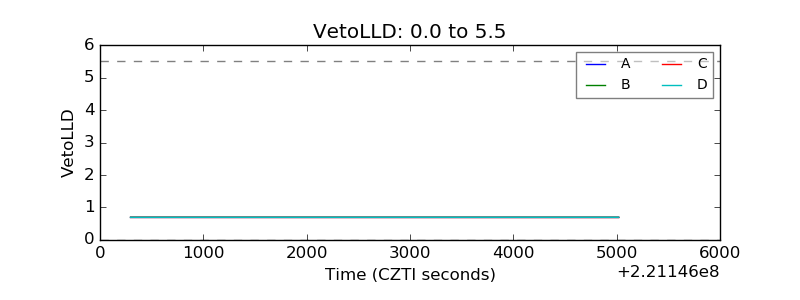 |
| Alpha Counter | 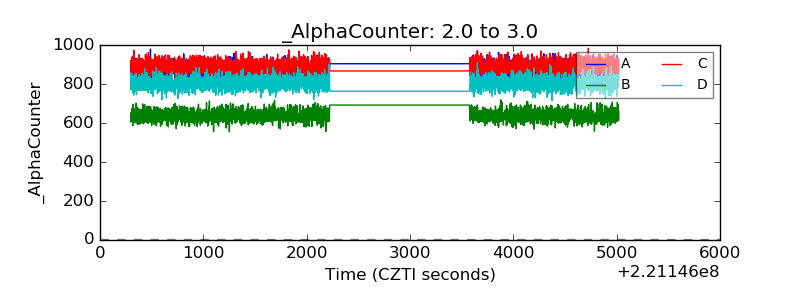 |
| _CPM_Rate | 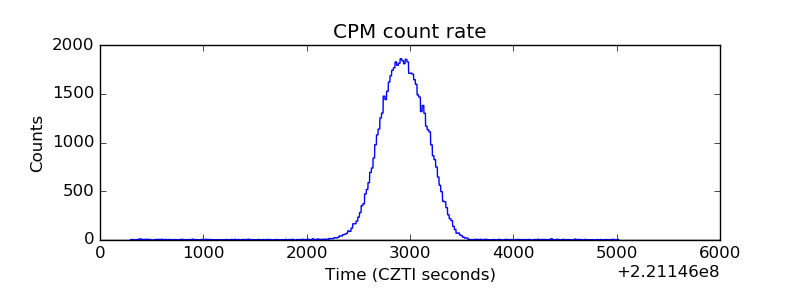 |
| CZT Counter | 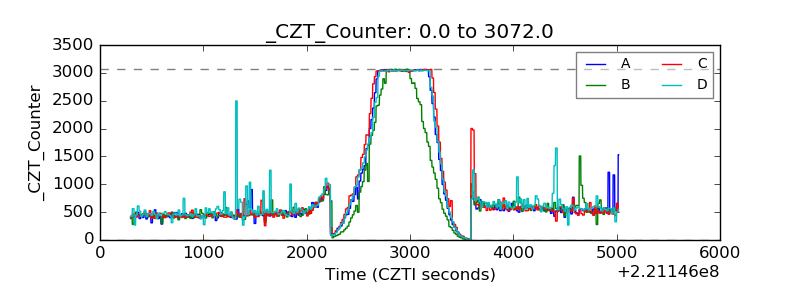 |
| +2.5 Volts monitor |  |
| +5 Volts monitor | 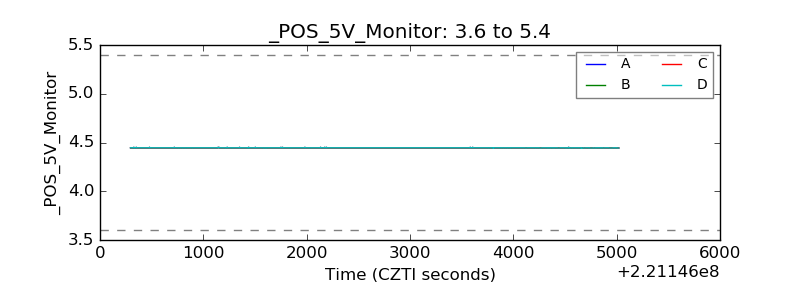 |
| _ROLL_ROT | 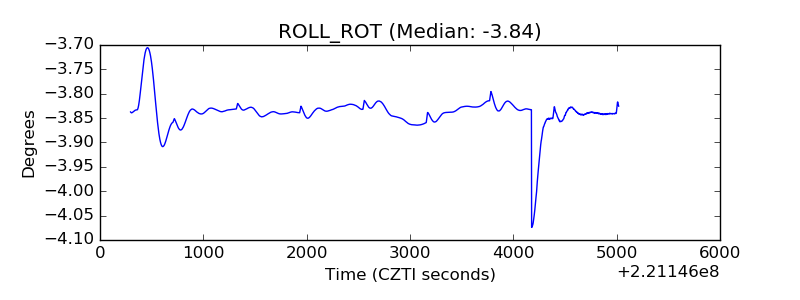 |
| _Roll_DEC | 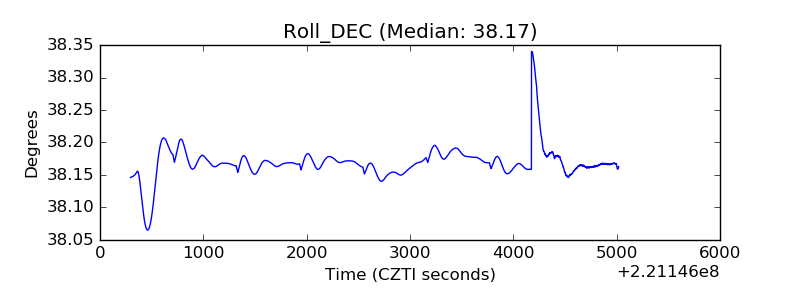 |
| _Roll_RA | 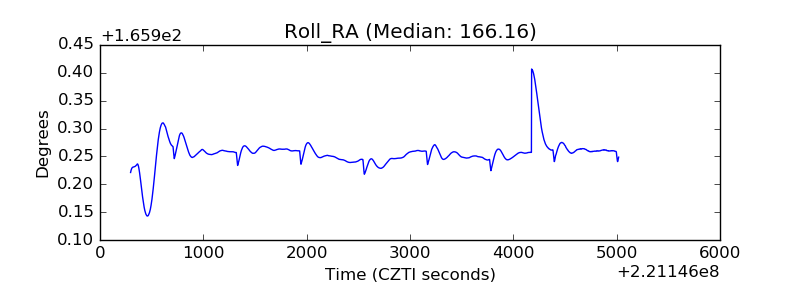 |
| Veto Counter | 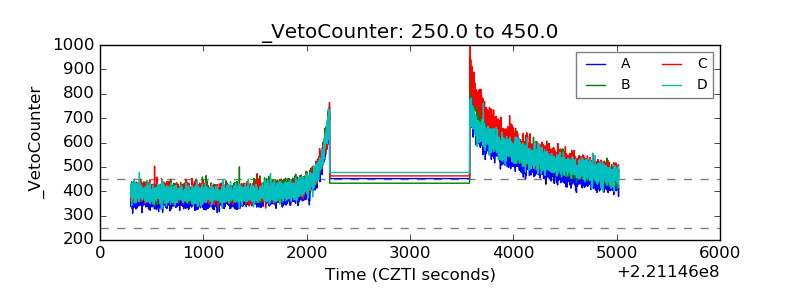 |