| Param | Original file | Final file |
|---|---|---|
| Filename | modeM0/AS1A02_005T01_9000000948_06861cztM0_level2.evt | modeM0/AS1A02_005T01_9000000948_06861cztM0_level2_quad_clean.evt |
| Size (bytes) | 450,043,200 | 72,950,400 |
| Size | 429.2 MB | 69.6 MB |
| Events in quadrant A | 3,175,130 | 444,982 |
| Events in quadrant B | 3,312,302 | 451,397 |
| Events in quadrant C | 3,235,106 | 448,895 |
| Events in quadrant D | 3,486,164 | 431,031 |
| Mode SS | |||
|---|---|---|---|
| Quadrant | BADHDUFLAG | Total packets | Discarded packets |
| A | 0 | 126 | 0 |
| B | 0 | 126 | 0 |
| C | 0 | 126 | 0 |
| D | 0 | 126 | 0 |
| Mode M0 | |||
|---|---|---|---|
| Quadrant | BADHDUFLAG | Total packets | Discarded packets |
| A | 0 | 13400 | 2 |
| B | 0 | 13887 | 1 |
| C | 0 | 13484 | 1 |
| D | 0 | 14356 | 1 |
| Mode M9 | |||
|---|---|---|---|
| Quadrant | BADHDUFLAG | Total packets | Discarded packets |
| A | 0 | 13 | 0 |
| B | 0 | 13 | 0 |
| C | 0 | 13 | 0 |
| D | 0 | 13 | 0 |
| Quadrant | Total seconds | Saturated seconds | Saturation percentage |
|---|---|---|---|
| A | 6197 | 92 | 1.484589% |
| B | 6197 | 115 | 1.855737% |
| C | 6197 | 111 | 1.791189% |
| D | 6197 | 118 | 1.904147% |
Noise dominated data is calculated using 1-second bins in cleaned event files. If a bin has >2000 counts, and if more than 50% of those come from <1% of pixels, then it is considered to be noise-dominated and hence unusable.
| Quadrant | # 1 sec bins | Bins with >0 counts | Bins with >2000 counts | High rate bins dominated by noise | Noise dominated (total time) | Noise dominated (detector-on time) | Marked lightcurve |
|---|---|---|---|---|---|---|---|
| A | 7512 | 6198 | 5 | 5 | 0.07% | 0.08% | 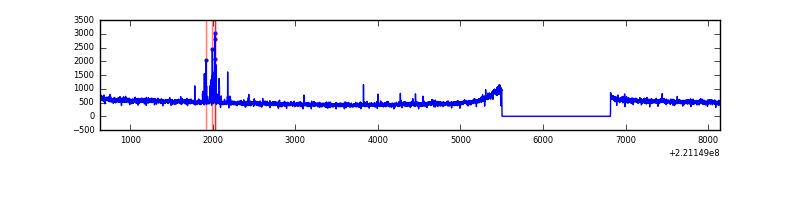 |
| B | 7512 | 6198 | 10 | 10 | 0.13% | 0.16% |  |
| C | 7512 | 6198 | 13 | 13 | 0.17% | 0.21% | 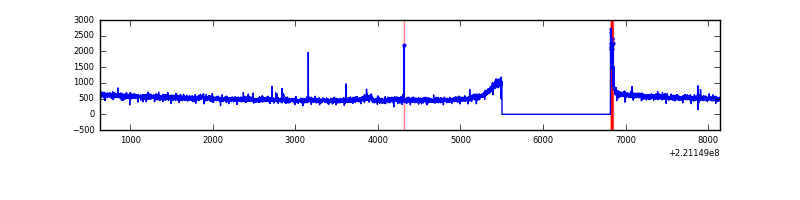 |
| D | 7512 | 6198 | 20 | 20 | 0.27% | 0.32% | 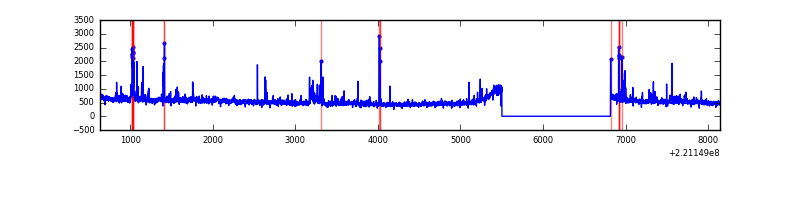 |
Top three noisy pixels from each quadrant. If the there are fewer than three noisy pixels in the level2.evt file, extra rows are filled as -1
| Pixel properties | Quadrant properties | ||||||
|---|---|---|---|---|---|---|---|
| Quadrant | DetID | PixID | Counts | Sigma | Mean | Median | Sigma |
| A | 13 | 251 | 73622 | 447.22 | 800 | 783 | 162.9 |
| A | 3 | 1 | 20717 | 122.39 | 800 | 783 | 162.9 |
| A | 0 | 226 | 7742 | 42.73 | 800 | 783 | 162.9 |
| B | 4 | 48 | 98868 | 650.55 | 804 | 787 | 150.8 |
| B | 0 | 228 | 37370 | 242.64 | 804 | 787 | 150.8 |
| B | 0 | 219 | 25681 | 165.11 | 804 | 787 | 150.8 |
| C | 9 | 247 | 97156 | 532.22 | 786 | 790 | 181.1 |
| C | 9 | 16 | 57131 | 311.17 | 786 | 790 | 181.1 |
| C | 12 | 4 | 10703 | 54.75 | 786 | 790 | 181.1 |
| D | 8 | 195 | 228771 | 1188.64 | 785 | 761 | 191.8 |
| D | 2 | 152 | 116890 | 605.39 | 785 | 761 | 191.8 |
| D | 2 | 16 | 69055 | 356.02 | 785 | 761 | 191.8 |
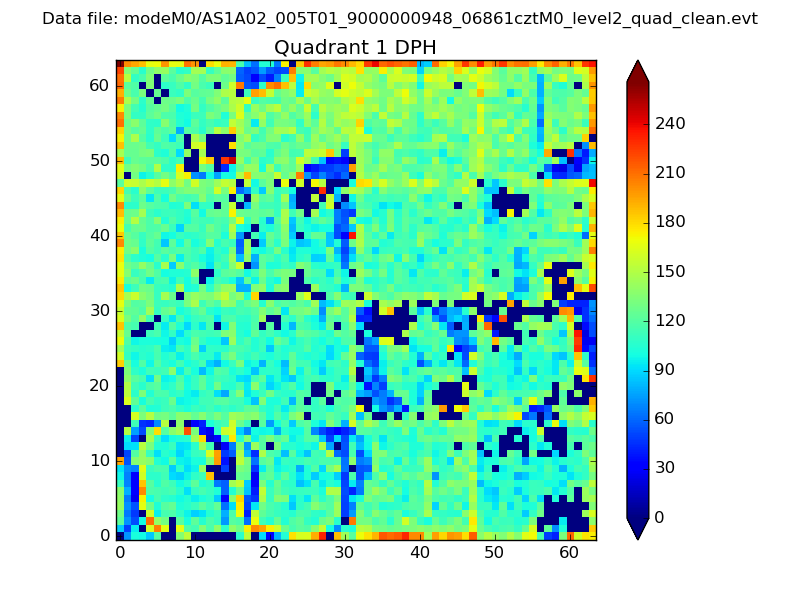
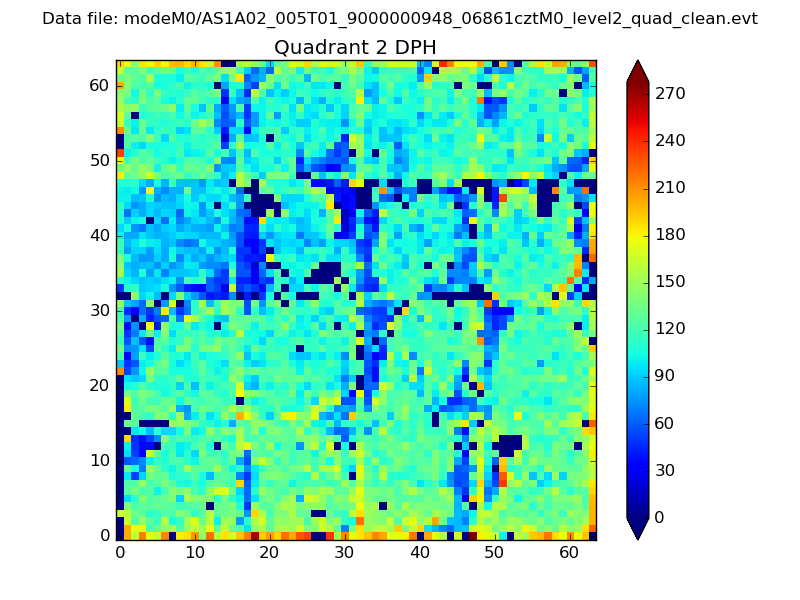
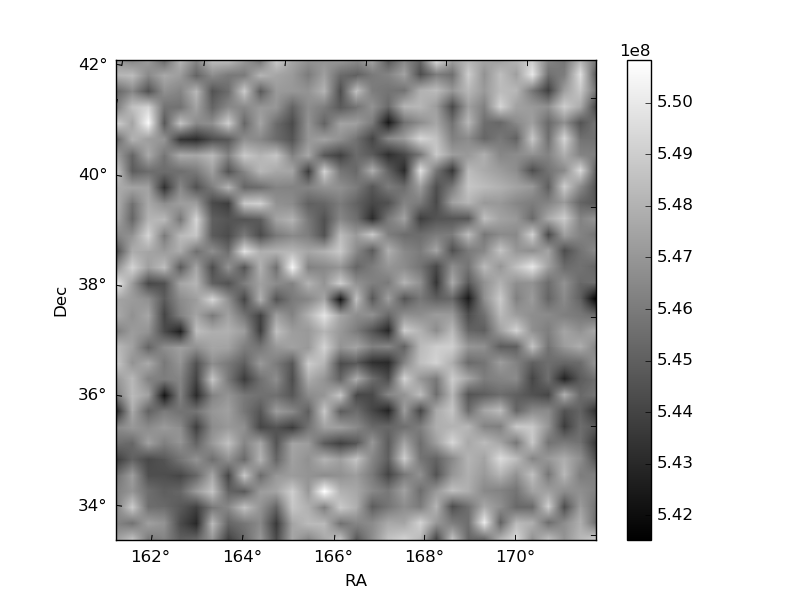
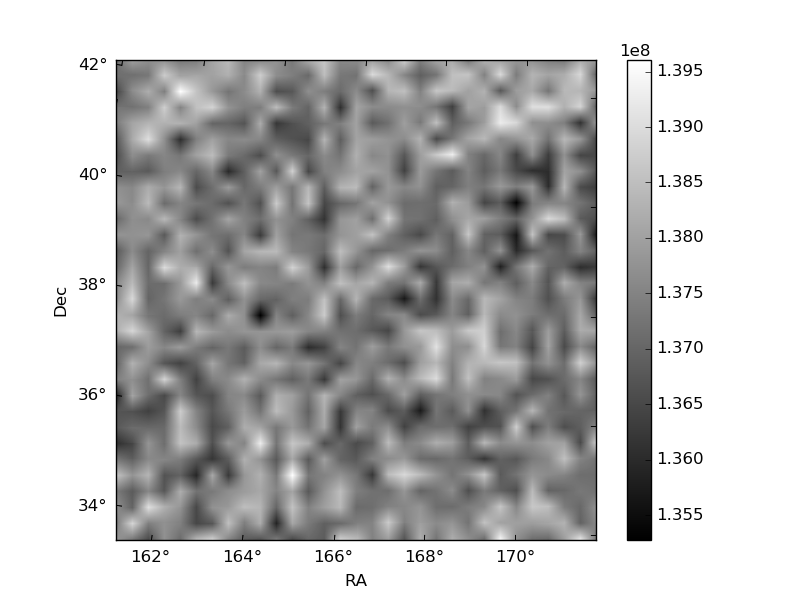
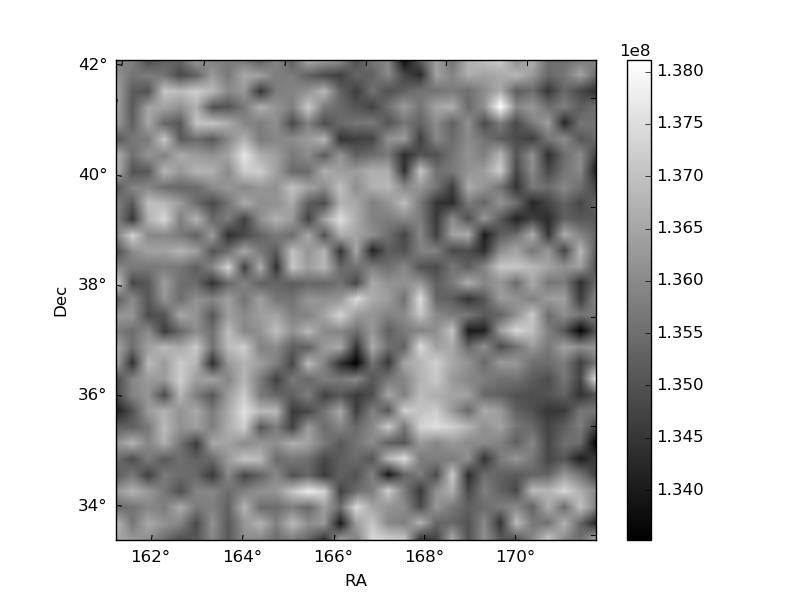
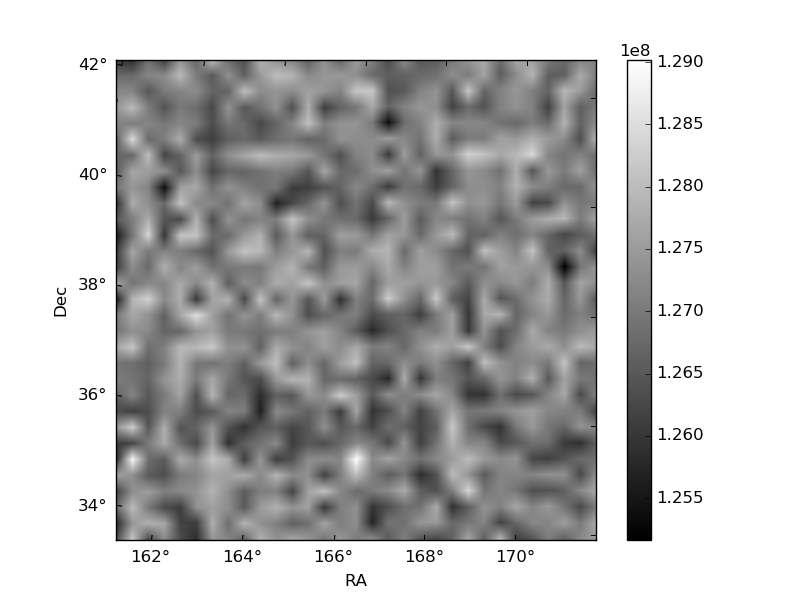
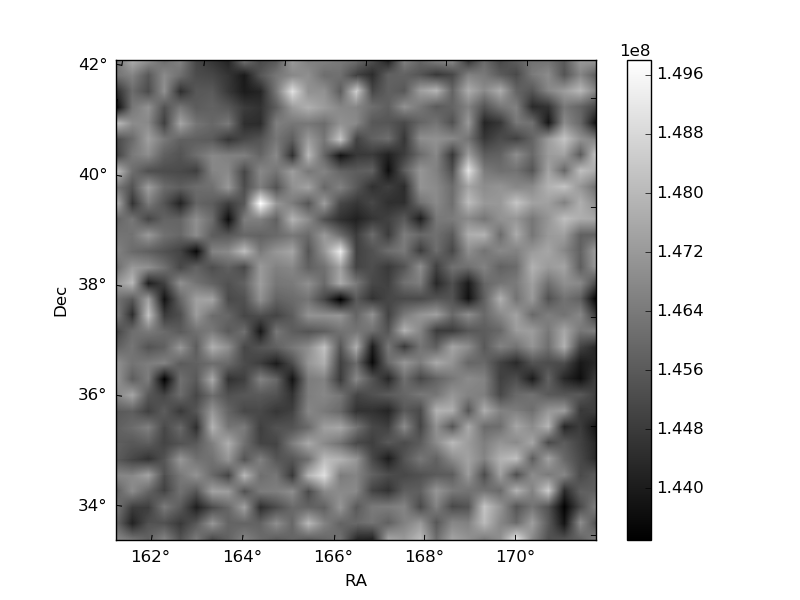
Histogram calculated using DETX and DETY for each event in the final _common_clean file
| Quadrant A | 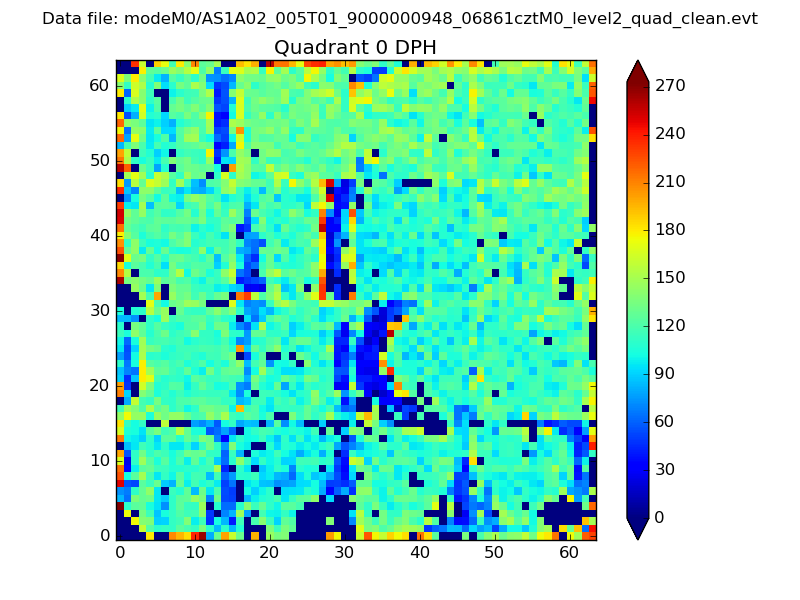 |
 |
Quadrant B |
|---|---|---|---|
| Quadrant D | 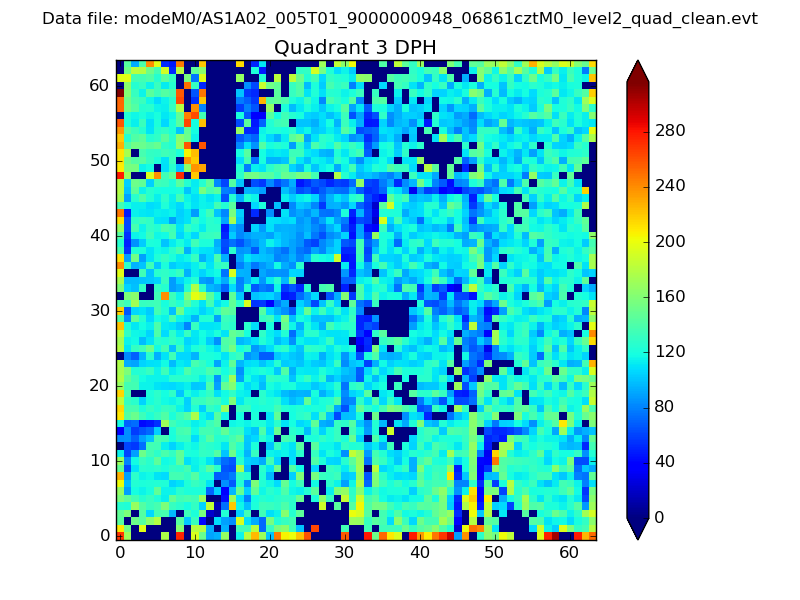 |
 |
Quadrant C |
| Plot type | Count rate plots | Images |
|---|---|---|
| Comparison with Poisson distribution Blue bars denote a histogram of data divided into 1 sec bins. Red curve is a Poisson curve with rate = median count rate of data. |
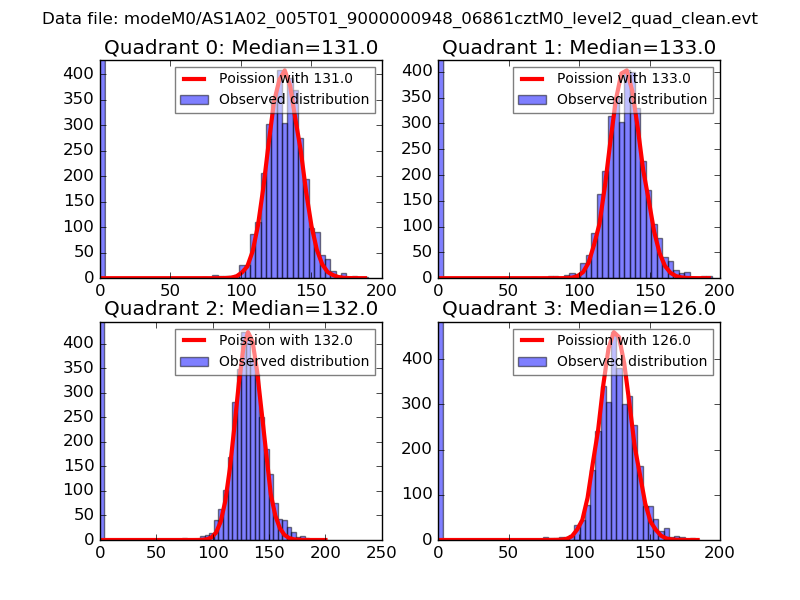 |
 |
| Quadrant-wise count rates Data is divided into 100 sec bins |
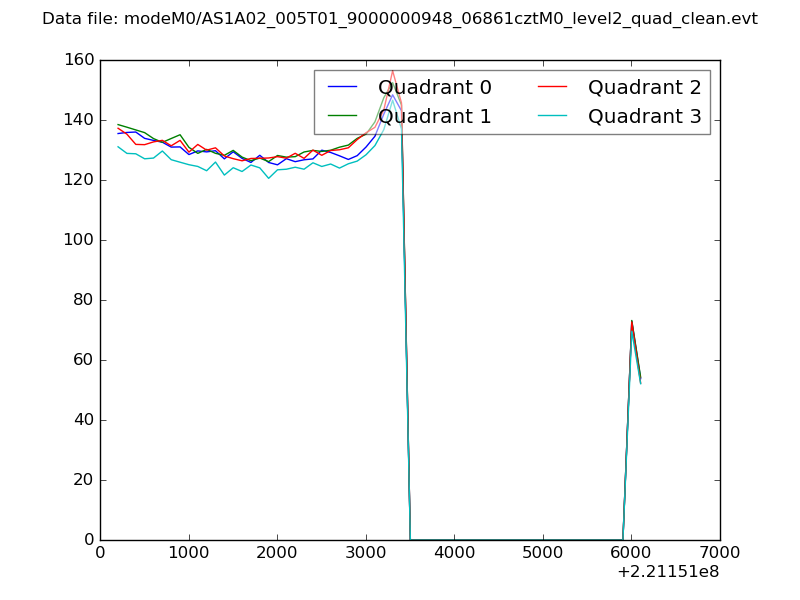 |
|
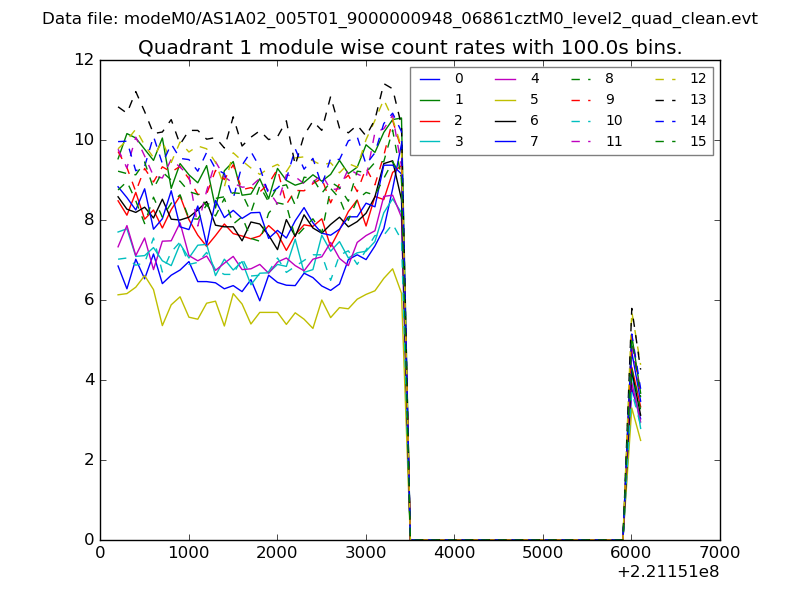
| Module-wise count rates for Quadrant A Data is divided into 100 sec bins |
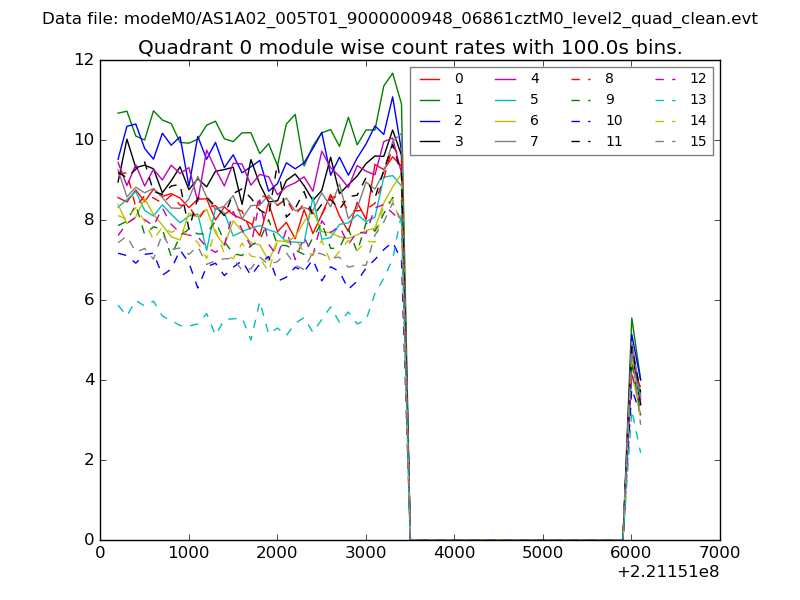 |
 |
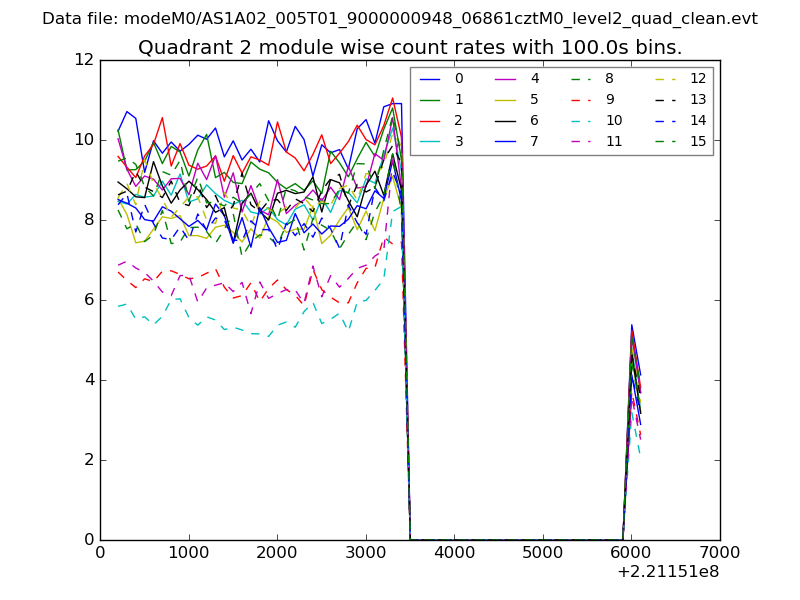
| Module-wise count rates for Quadrant B Data is divided into 100 sec bins |
 |
 |
| Module-wise count rates for Quadrant C Data is divided into 100 sec bins |
 |
 |
| Module-wise count rates for Quadrant D Data is divided into 100 sec bins |
 |
 |
| Parameter | Plot |
|---|---|
| CZT HV Monitor | 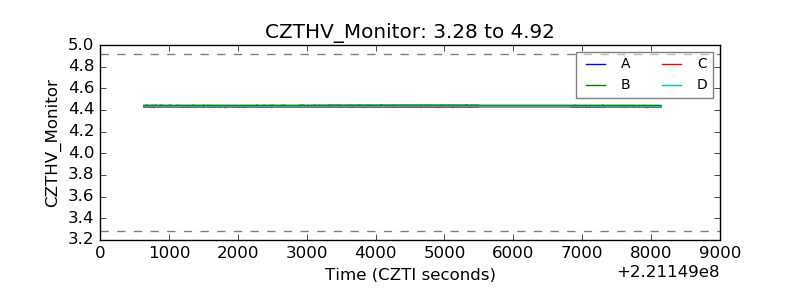 |
| D_VDD | 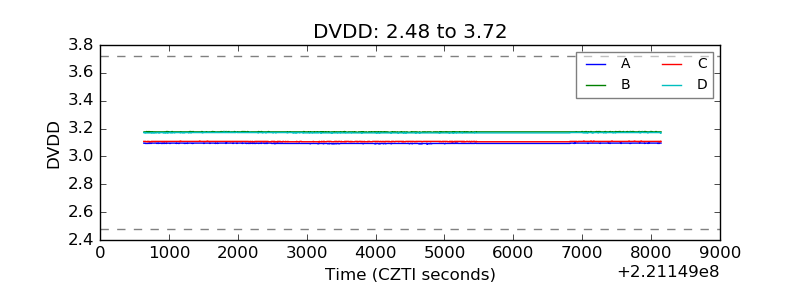 |
| Temperature 1 | 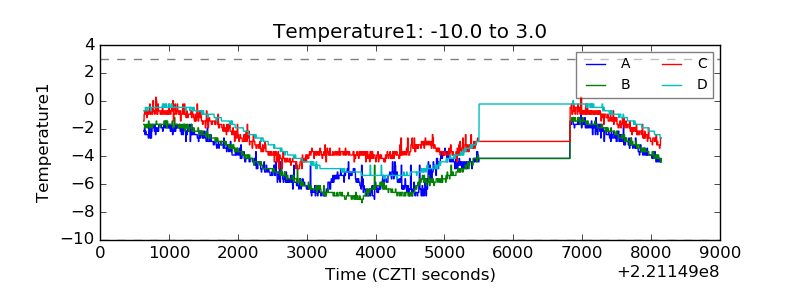 |
| Veto HV Monitor | 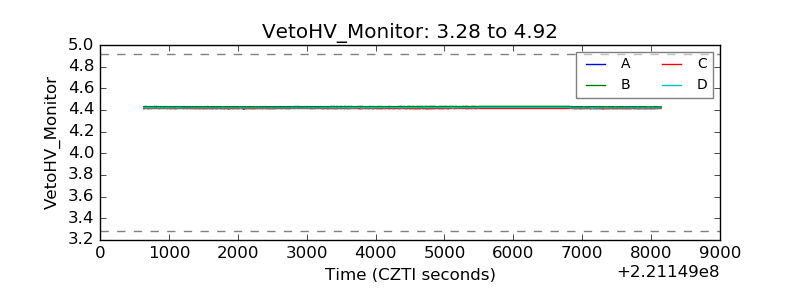 |
| Veto LLD | 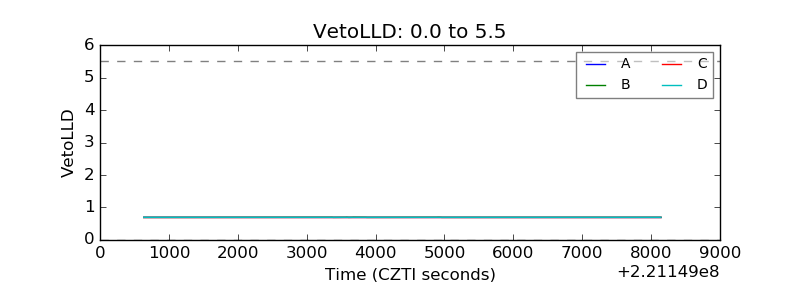 |
| Alpha Counter | 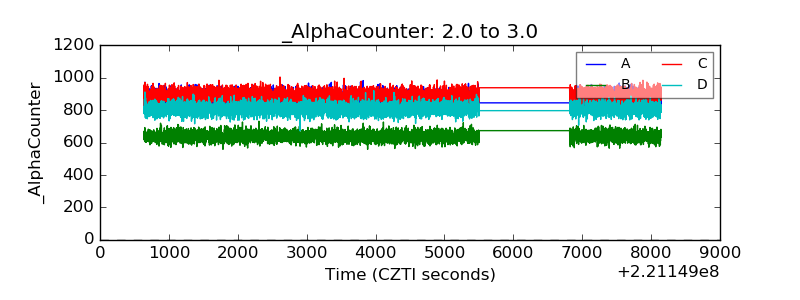 |
| _CPM_Rate | 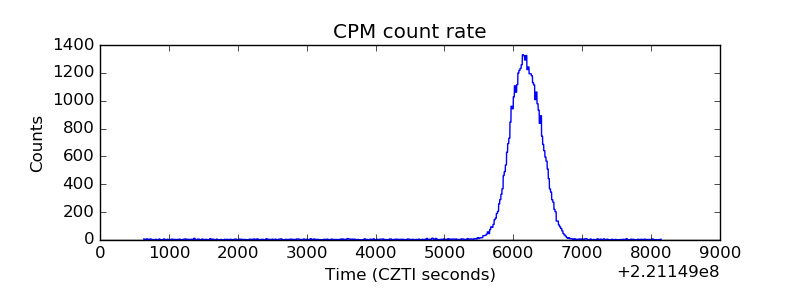 |
| CZT Counter | 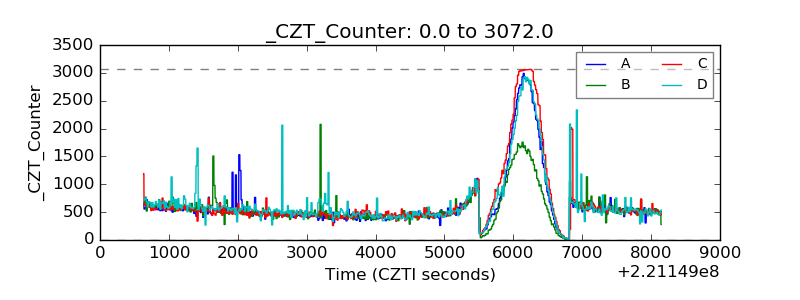 |
| +2.5 Volts monitor | 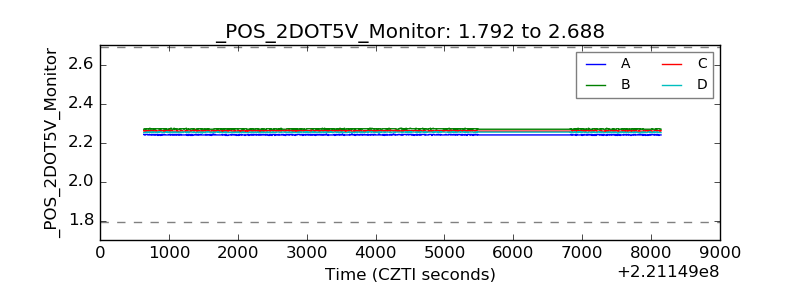 |
| +5 Volts monitor |  |
| _ROLL_ROT | 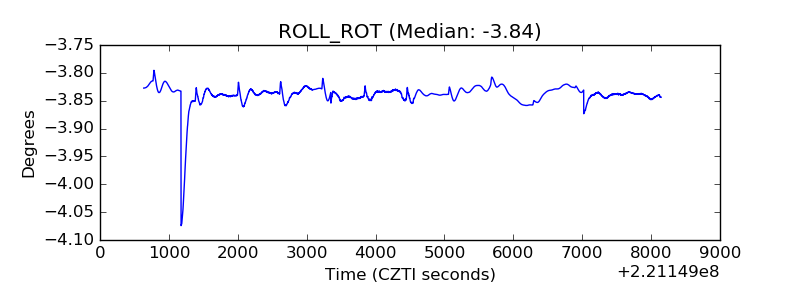 |
| _Roll_DEC | 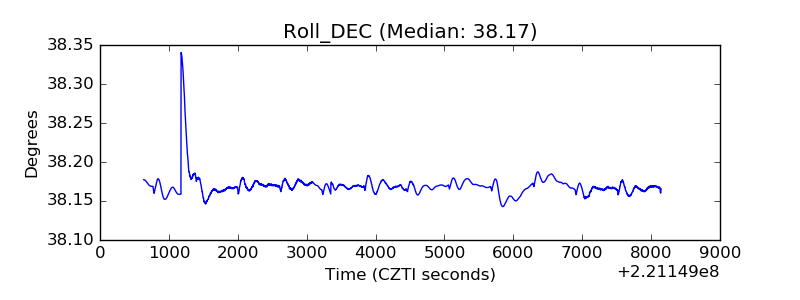 |
| _Roll_RA | 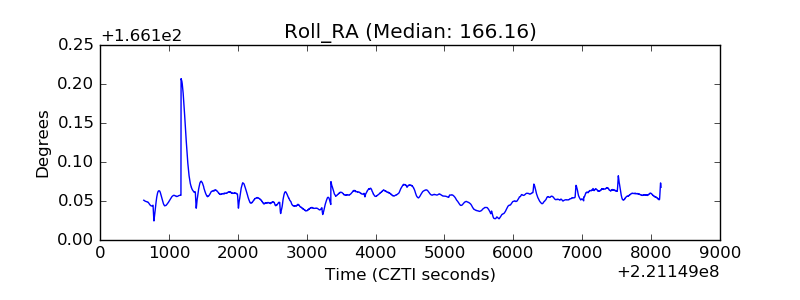 |
| Veto Counter | 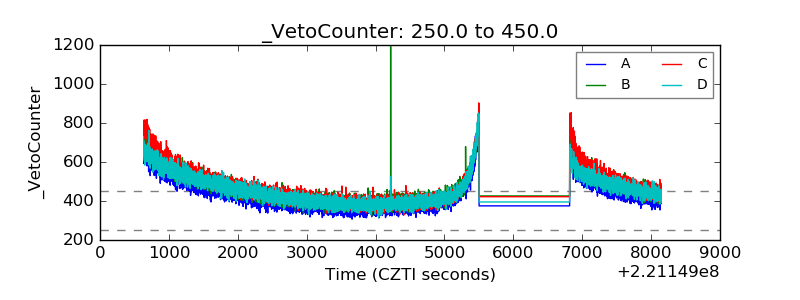 |