| Param | Original file | Final file |
|---|---|---|
| Filename | modeM0/AS1A02_005T01_9000000948_06862cztM0_level2.evt | modeM0/AS1A02_005T01_9000000948_06862cztM0_level2_quad_clean.evt |
| Size (bytes) | 454,095,360 | 86,751,360 |
| Size | 433.1 MB | 82.7 MB |
| Events in quadrant A | 3,121,626 | 547,042 |
| Events in quadrant B | 3,396,916 | 553,921 |
| Events in quadrant C | 3,241,975 | 550,402 |
| Events in quadrant D | 3,553,979 | 526,319 |
| Mode SS | |||
|---|---|---|---|
| Quadrant | BADHDUFLAG | Total packets | Discarded packets |
| A | 0 | 130 | 0 |
| B | 0 | 130 | 0 |
| C | 0 | 130 | 0 |
| D | 0 | 130 | 0 |
| Mode M0 | |||
|---|---|---|---|
| Quadrant | BADHDUFLAG | Total packets | Discarded packets |
| A | 0 | 13543 | 3 |
| B | 0 | 14360 | 2 |
| C | 0 | 13815 | 2 |
| D | 0 | 14847 | 2 |
| Mode M9 | |||
|---|---|---|---|
| Quadrant | BADHDUFLAG | Total packets | Discarded packets |
| A | 0 | 24 | 0 |
| B | 0 | 24 | 0 |
| C | 0 | 24 | 0 |
| D | 0 | 24 | 0 |
| Quadrant | Total seconds | Saturated seconds | Saturation percentage |
|---|---|---|---|
| A | 6444 | 94 | 1.458721% |
| B | 6444 | 118 | 1.831161% |
| C | 6444 | 121 | 1.877716% |
| D | 6444 | 170 | 2.638113% |
Noise dominated data is calculated using 1-second bins in cleaned event files. If a bin has >2000 counts, and if more than 50% of those come from <1% of pixels, then it is considered to be noise-dominated and hence unusable.
| Quadrant | # 1 sec bins | Bins with >0 counts | Bins with >2000 counts | High rate bins dominated by noise | Noise dominated (total time) | Noise dominated (detector-on time) | Marked lightcurve |
|---|---|---|---|---|---|---|---|
| A | 7614 | 6445 | 0 | 0 | 0.00% | 0.00% |  |
| B | 7614 | 6445 | 8 | 8 | 0.11% | 0.12% | 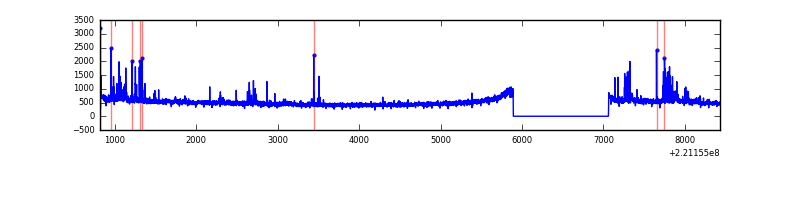 |
| C | 7614 | 6445 | 12 | 12 | 0.16% | 0.19% | 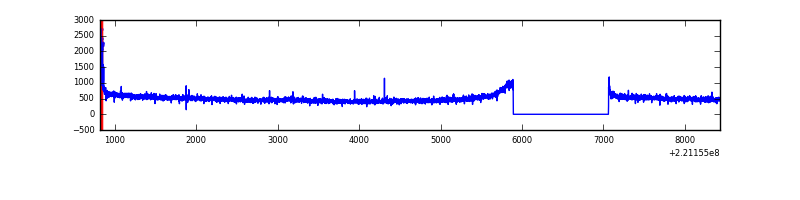 |
| D | 7614 | 6445 | 67 | 67 | 0.88% | 1.04% | 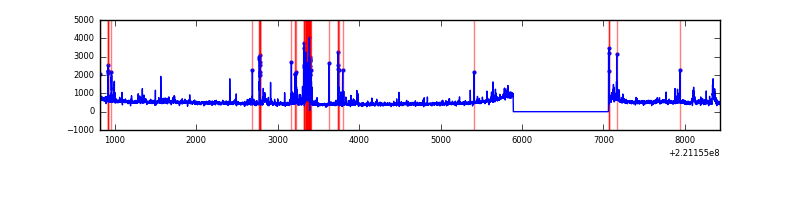 |
Top three noisy pixels from each quadrant. If the there are fewer than three noisy pixels in the level2.evt file, extra rows are filled as -1
| Pixel properties | Quadrant properties | ||||||
|---|---|---|---|---|---|---|---|
| Quadrant | DetID | PixID | Counts | Sigma | Mean | Median | Sigma |
| A | 3 | 1 | 19971 | 117.12 | 804 | 787 | 163.8 |
| A | 0 | 226 | 7740 | 42.45 | 804 | 787 | 163.8 |
| A | 12 | 194 | 7317 | 39.87 | 804 | 787 | 163.8 |
| B | 4 | 48 | 117891 | 759.07 | 811 | 792 | 154.3 |
| B | 4 | 80 | 61358 | 392.61 | 811 | 792 | 154.3 |
| B | 0 | 219 | 27886 | 175.63 | 811 | 792 | 154.3 |
| C | 9 | 247 | 99714 | 541.32 | 789 | 793 | 182.7 |
| C | 9 | 16 | 53685 | 289.44 | 789 | 793 | 182.7 |
| C | 13 | 61 | 6124 | 29.17 | 789 | 793 | 182.7 |
| D | 2 | 216 | 243226 | 1267.77 | 786 | 764 | 191.3 |
| D | 2 | 152 | 136931 | 711.98 | 786 | 764 | 191.3 |
| D | 8 | 195 | 50099 | 257.96 | 786 | 764 | 191.3 |
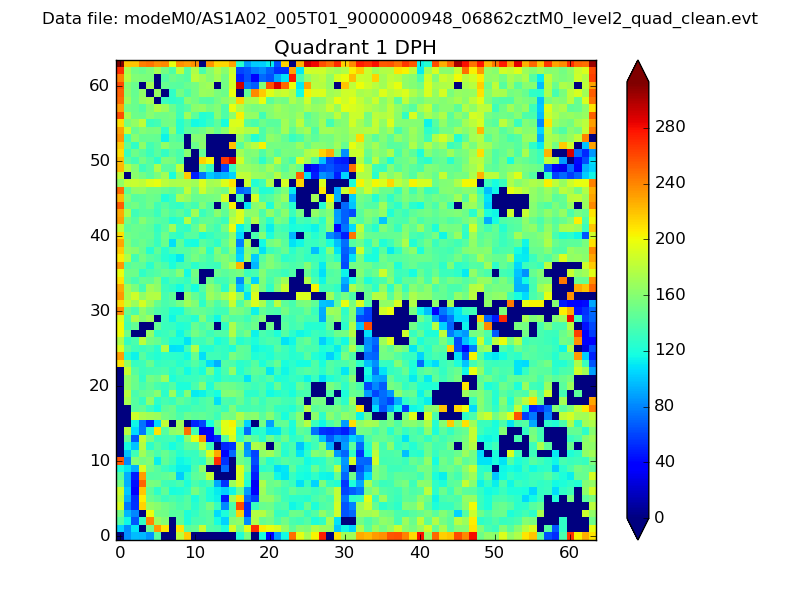
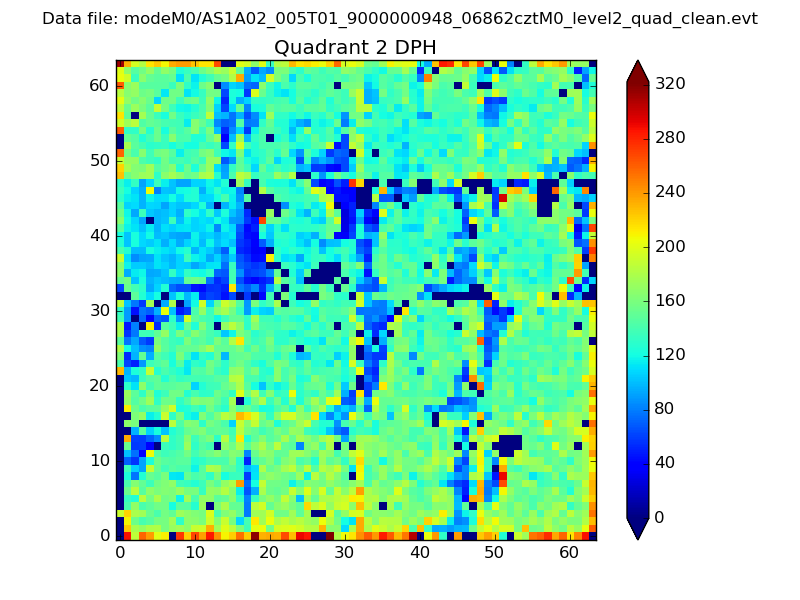
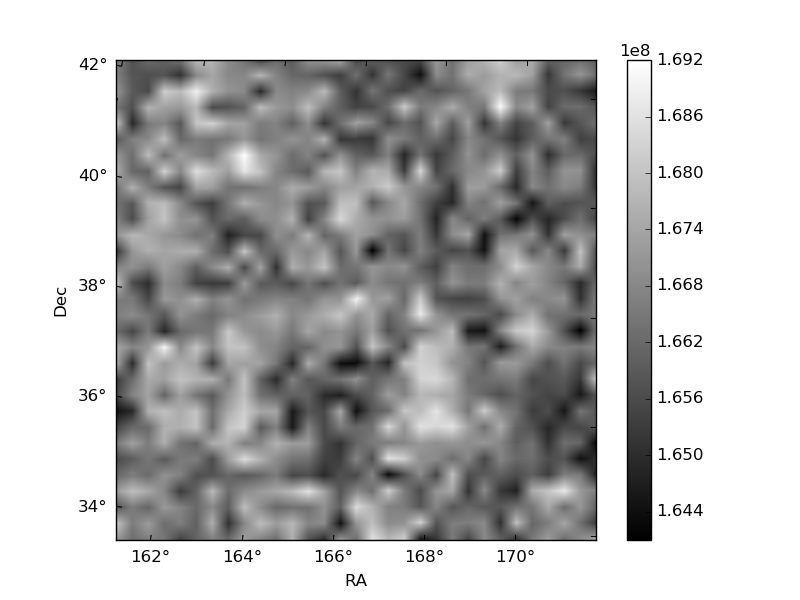
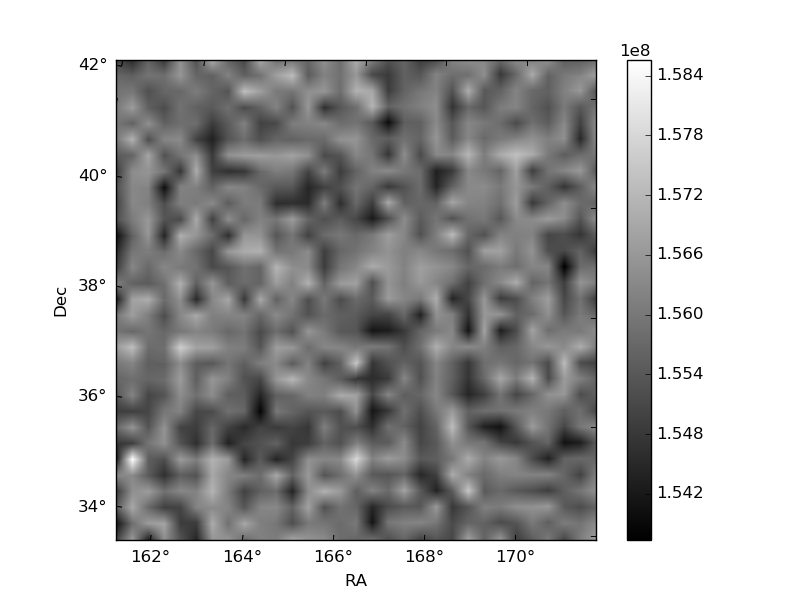
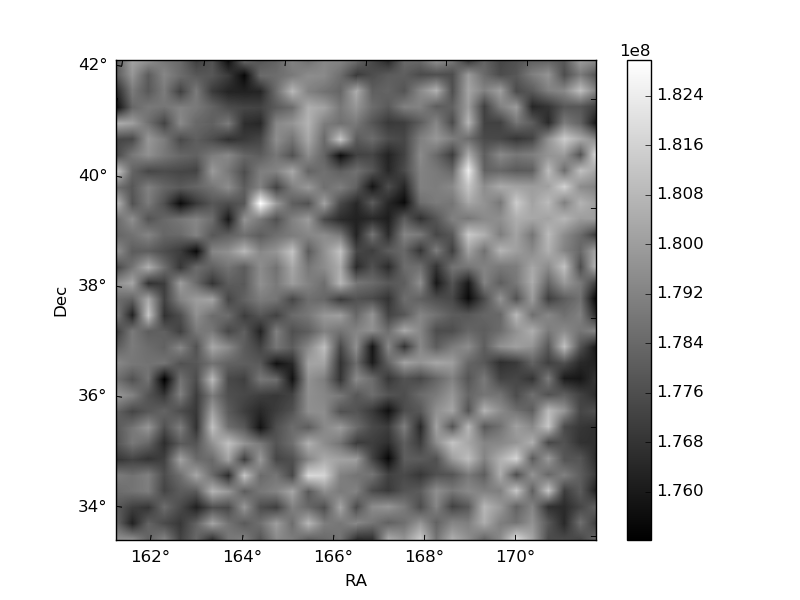
Histogram calculated using DETX and DETY for each event in the final _common_clean file
| Quadrant A | 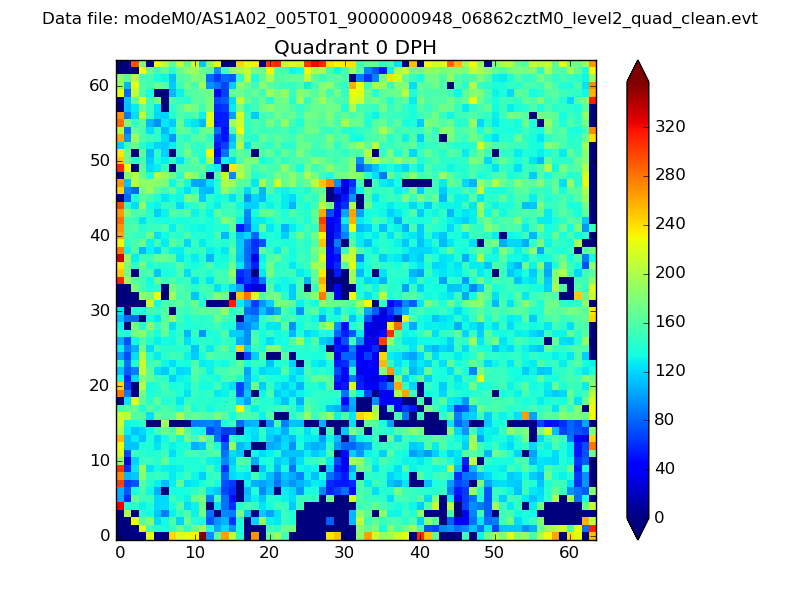 |
 |
Quadrant B |
|---|---|---|---|
| Quadrant D |  |
 |
Quadrant C |
| Plot type | Count rate plots | Images |
|---|---|---|
| Comparison with Poisson distribution Blue bars denote a histogram of data divided into 1 sec bins. Red curve is a Poisson curve with rate = median count rate of data. |
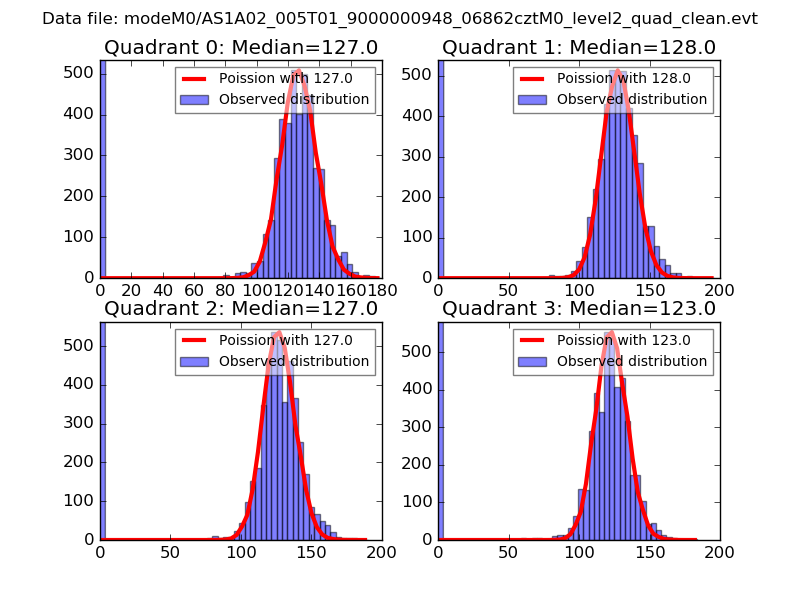 |
 |
| Quadrant-wise count rates Data is divided into 100 sec bins |
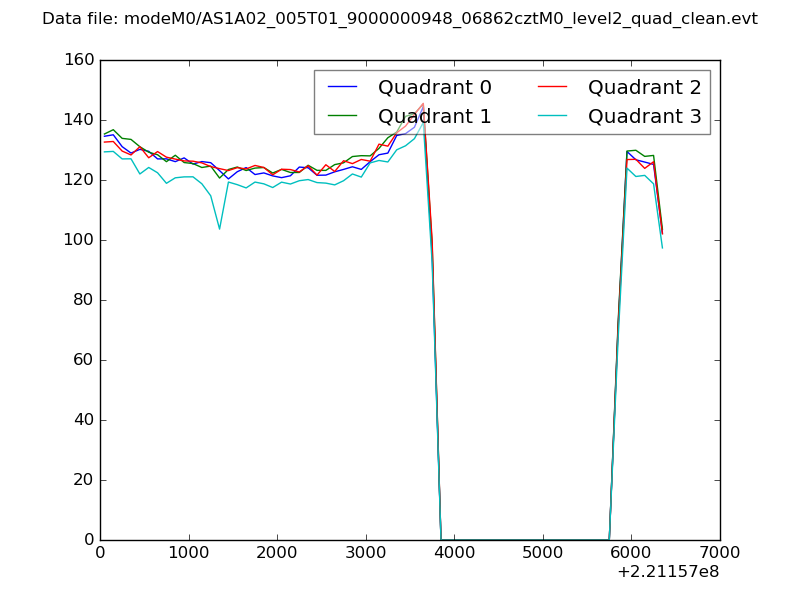 |
|
| Module-wise count rates for Quadrant A Data is divided into 100 sec bins |
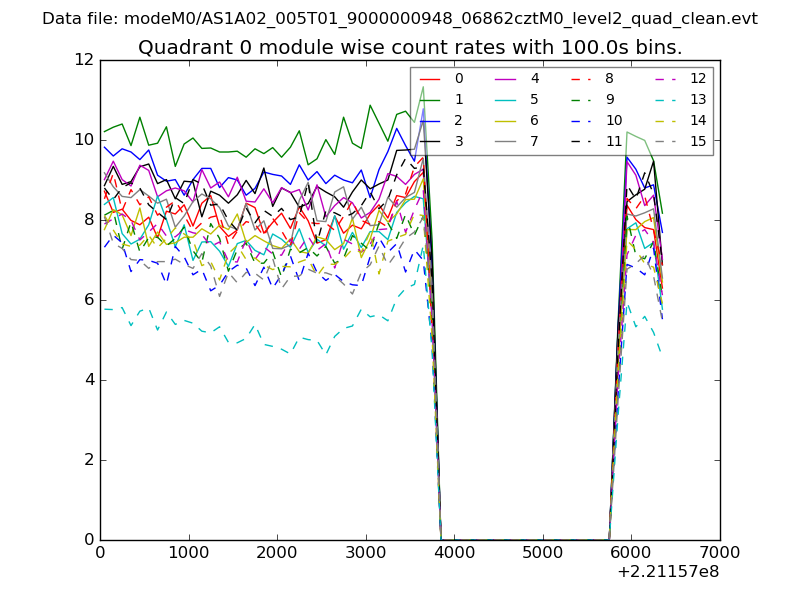 |
 |
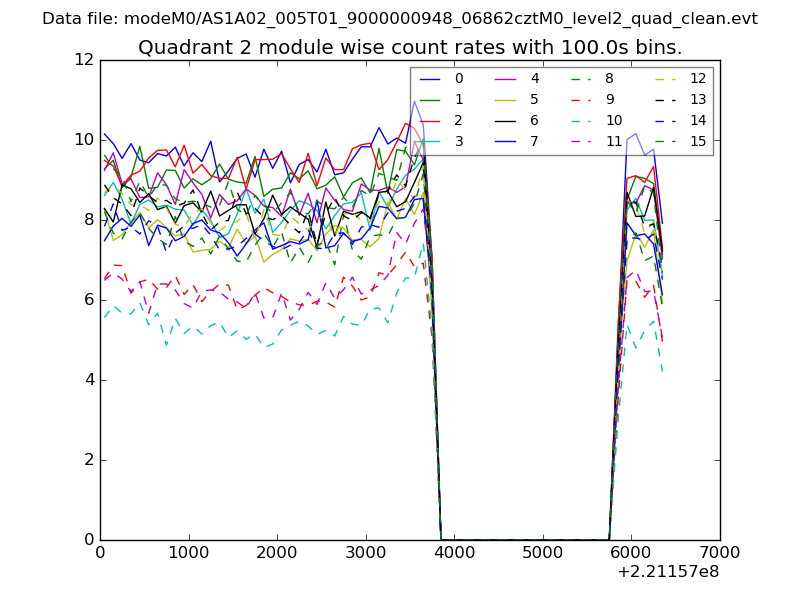
| Module-wise count rates for Quadrant B Data is divided into 100 sec bins |
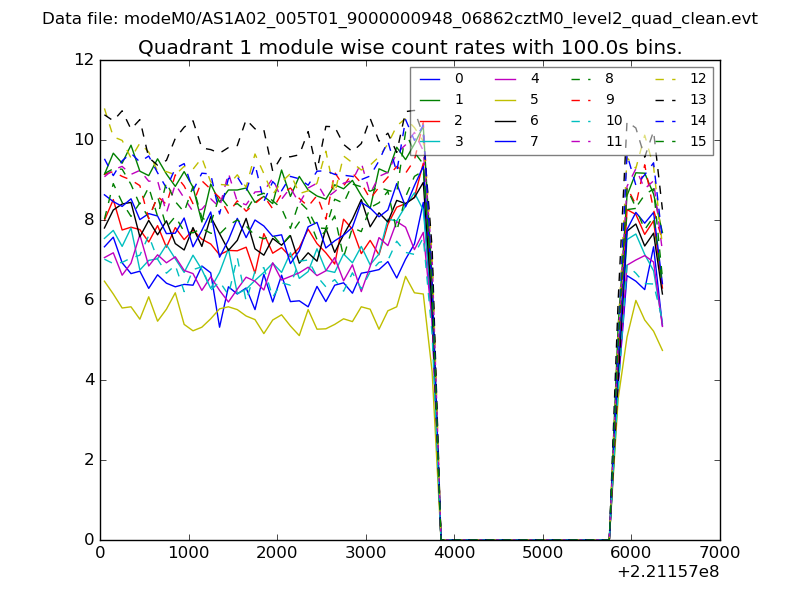 |
 |
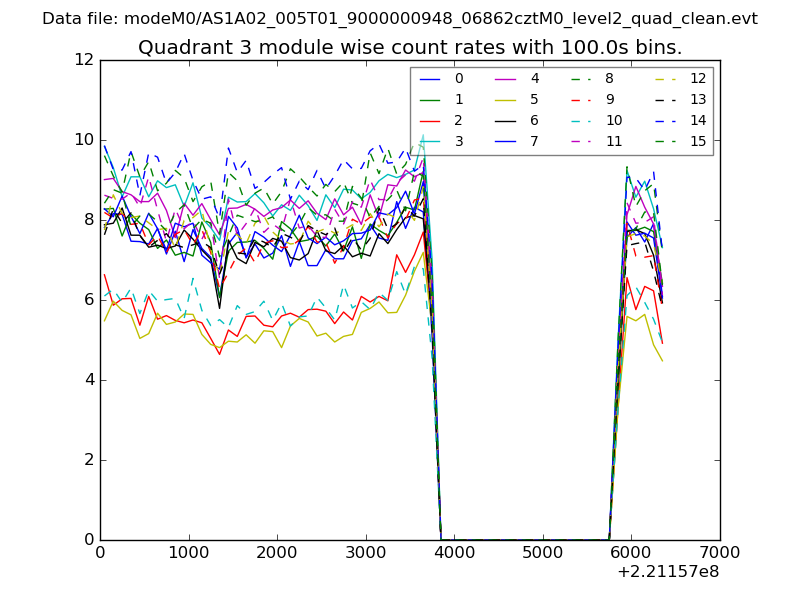
| Module-wise count rates for Quadrant C Data is divided into 100 sec bins |
 |
 |
| Module-wise count rates for Quadrant D Data is divided into 100 sec bins |
 |
 |
| Parameter | Plot |
|---|---|
| CZT HV Monitor | 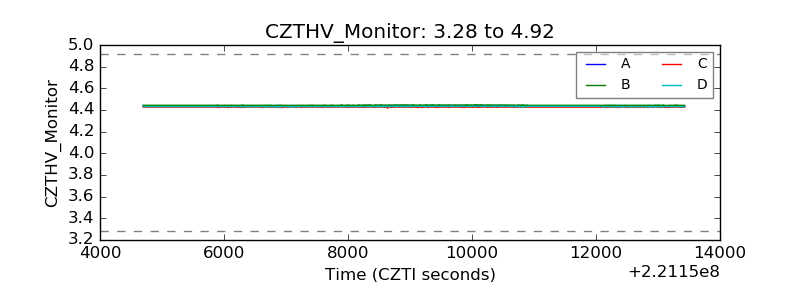 |
| D_VDD | 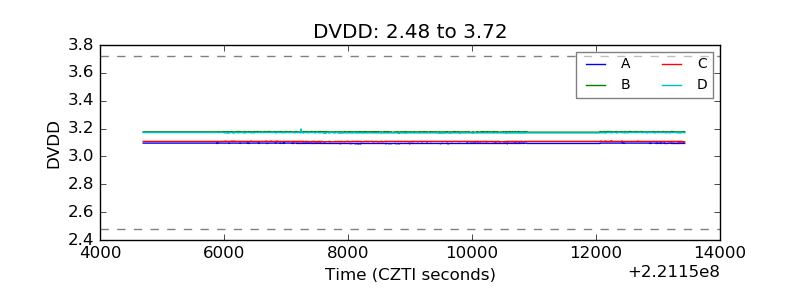 |
| Temperature 1 | 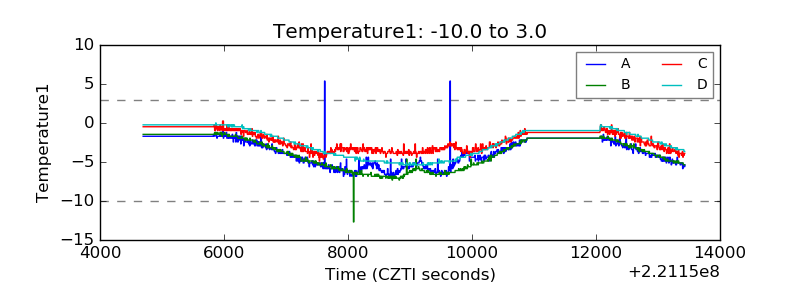 |
| Veto HV Monitor | 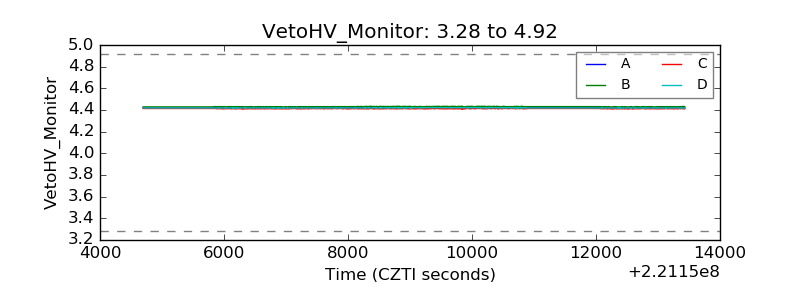 |
| Veto LLD | 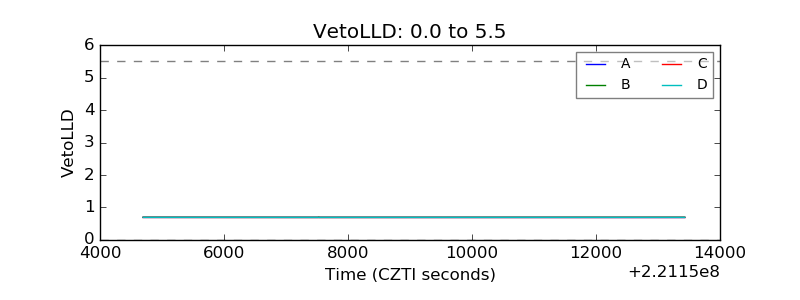 |
| Alpha Counter | 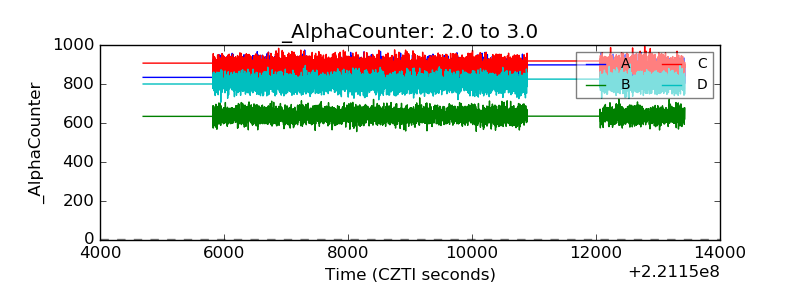 |
| _CPM_Rate | 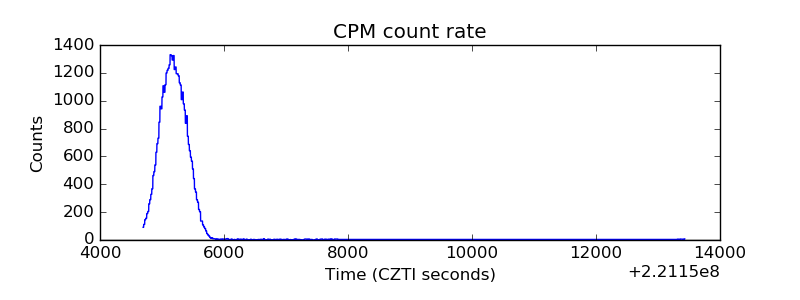 |
| CZT Counter | 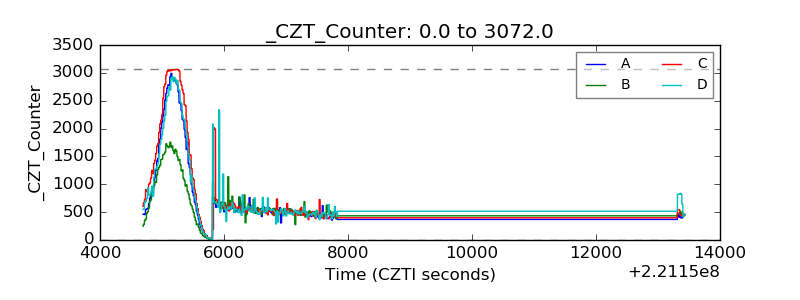 |
| +2.5 Volts monitor | 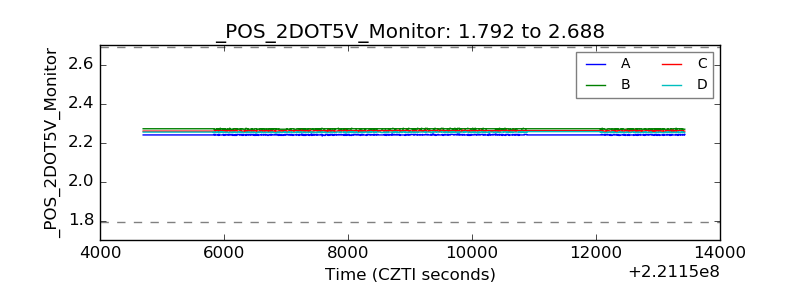 |
| +5 Volts monitor |  |
| _ROLL_ROT | 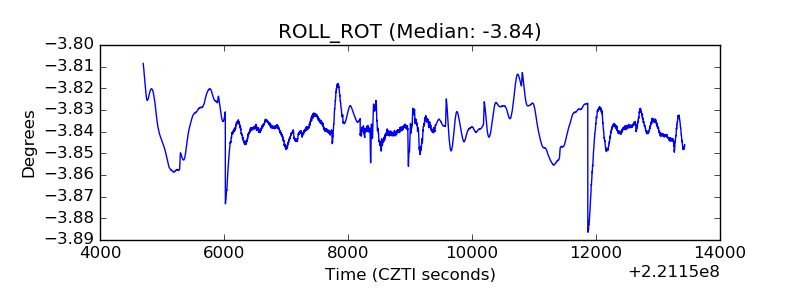 |
| _Roll_DEC | 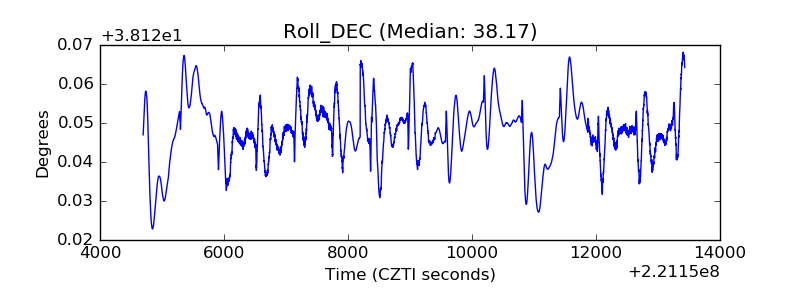 |
| _Roll_RA | 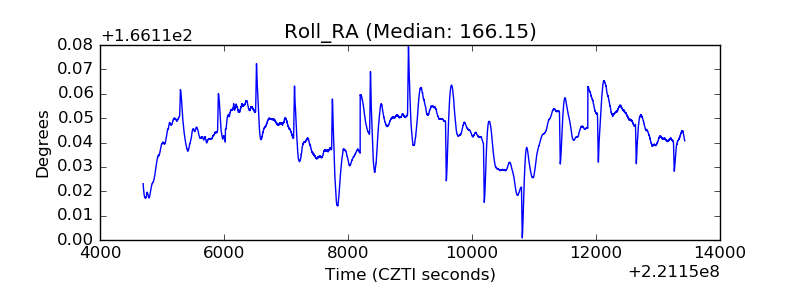 |
| Veto Counter | 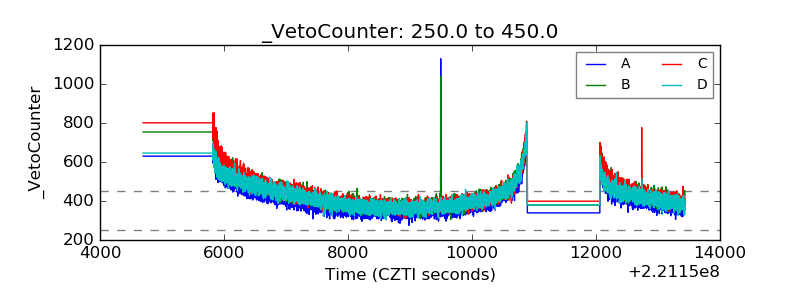 |