| Param | Original file | Final file |
|---|---|---|
| Filename | modeM0/AS1A02_005T01_9000000948_06863cztM0_level2.evt | modeM0/AS1A02_005T01_9000000948_06863cztM0_level2_quad_clean.evt |
| Size (bytes) | 466,214,400 | 88,355,520 |
| Size | 444.6 MB | 84.3 MB |
| Events in quadrant A | 3,148,865 | 553,820 |
| Events in quadrant B | 3,533,626 | 561,727 |
| Events in quadrant C | 3,235,445 | 557,703 |
| Events in quadrant D | 3,744,332 | 533,562 |
| Mode SS | |||
|---|---|---|---|
| Quadrant | BADHDUFLAG | Total packets | Discarded packets |
| A | 0 | 136 | 0 |
| B | 0 | 136 | 0 |
| C | 0 | 136 | 0 |
| D | 0 | 136 | 0 |
| Mode M0 | |||
|---|---|---|---|
| Quadrant | BADHDUFLAG | Total packets | Discarded packets |
| A | 0 | 14012 | 3 |
| B | 0 | 15129 | 2 |
| C | 0 | 13981 | 2 |
| D | 0 | 15673 | 2 |
| Mode M9 | |||
|---|---|---|---|
| Quadrant | BADHDUFLAG | Total packets | Discarded packets |
| A | 0 | 17 | 0 |
| B | 0 | 17 | 0 |
| C | 0 | 17 | 0 |
| D | 0 | 18 | 0 |
| Quadrant | Total seconds | Saturated seconds | Saturation percentage |
|---|---|---|---|
| A | 6728 | 85 | 1.263377% |
| B | 6728 | 131 | 1.947087% |
| C | 6728 | 61 | 0.906659% |
| D | 6728 | 151 | 2.244352% |
Noise dominated data is calculated using 1-second bins in cleaned event files. If a bin has >2000 counts, and if more than 50% of those come from <1% of pixels, then it is considered to be noise-dominated and hence unusable.
| Quadrant | # 1 sec bins | Bins with >0 counts | Bins with >2000 counts | High rate bins dominated by noise | Noise dominated (total time) | Noise dominated (detector-on time) | Marked lightcurve |
|---|---|---|---|---|---|---|---|
| A | 7513 | 6729 | 1 | 1 | 0.01% | 0.01% | 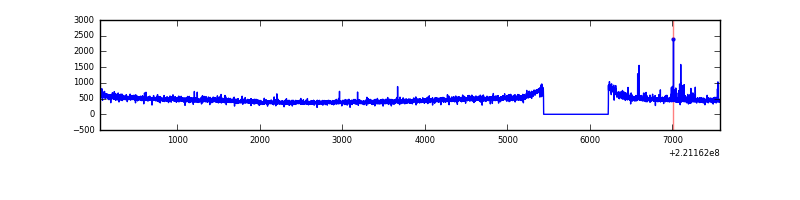 |
| B | 7513 | 6729 | 9 | 9 | 0.12% | 0.13% | 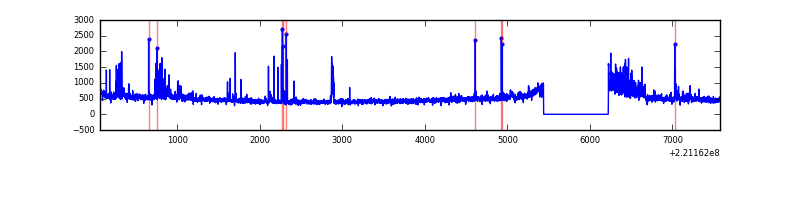 |
| C | 7513 | 6729 | 0 | 0 | 0.00% | 0.00% | 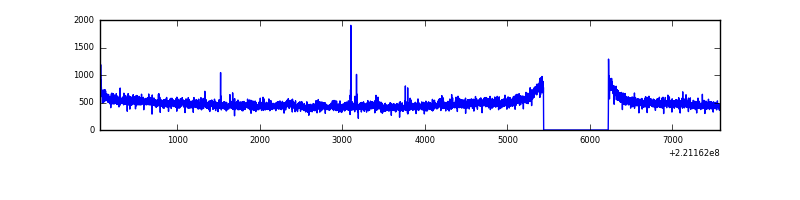 |
| D | 7513 | 6729 | 63 | 63 | 0.84% | 0.94% | 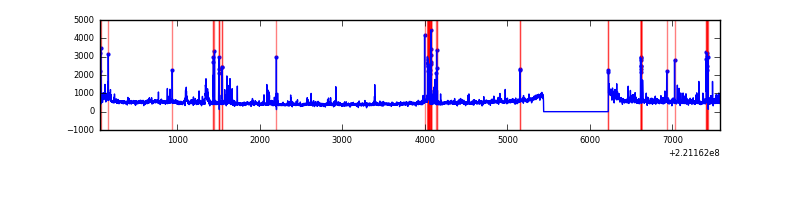 |
Top three noisy pixels from each quadrant. If the there are fewer than three noisy pixels in the level2.evt file, extra rows are filled as -1
| Pixel properties | Quadrant properties | ||||||
|---|---|---|---|---|---|---|---|
| Quadrant | DetID | PixID | Counts | Sigma | Mean | Median | Sigma |
| A | 0 | 23 | 15918 | 91.85 | 807 | 789 | 164.7 |
| A | 4 | 2 | 11534 | 65.23 | 807 | 789 | 164.7 |
| A | 13 | 248 | 9596 | 53.47 | 807 | 789 | 164.7 |
| B | 4 | 80 | 180134 | 1160.66 | 811 | 790 | 154.5 |
| B | 4 | 48 | 59613 | 380.68 | 811 | 790 | 154.5 |
| B | 0 | 214 | 33238 | 209.99 | 811 | 790 | 154.5 |
| C | 9 | 247 | 131205 | 710.57 | 790 | 793 | 183.5 |
| C | 12 | 4 | 9402 | 46.91 | 790 | 793 | 183.5 |
| C | 13 | 61 | 6287 | 29.93 | 790 | 793 | 183.5 |
| D | 2 | 152 | 227107 | 1170.9 | 785 | 763 | 193.3 |
| D | 13 | 169 | 144850 | 745.37 | 785 | 763 | 193.3 |
| D | 2 | 216 | 132440 | 681.18 | 785 | 763 | 193.3 |
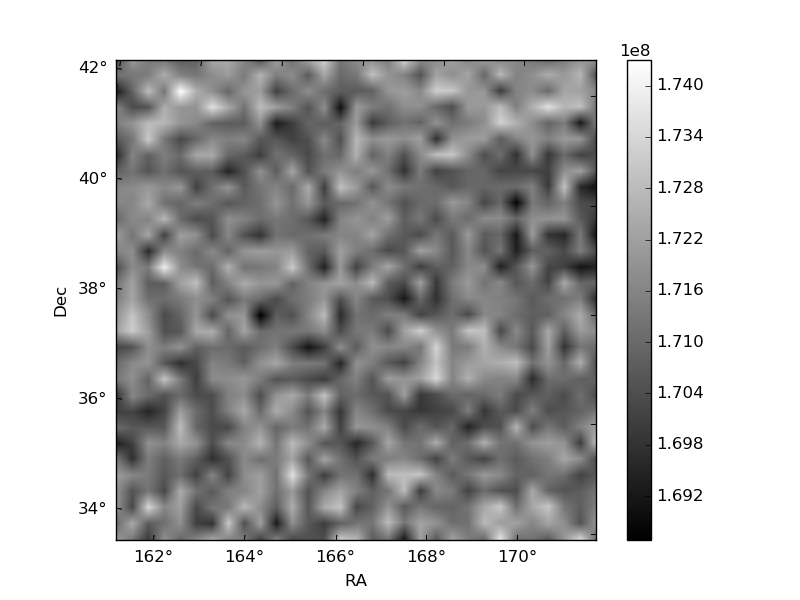
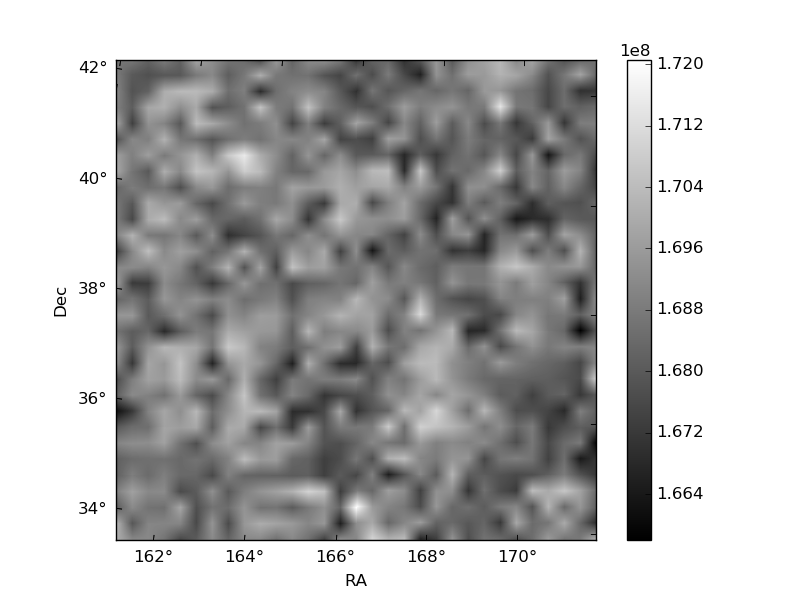
Histogram calculated using DETX and DETY for each event in the final _common_clean file
| Quadrant A | 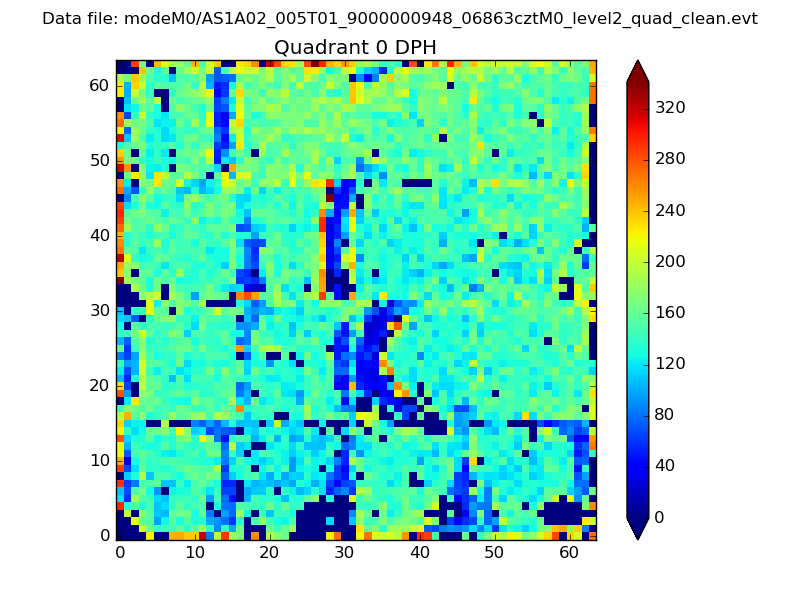 |
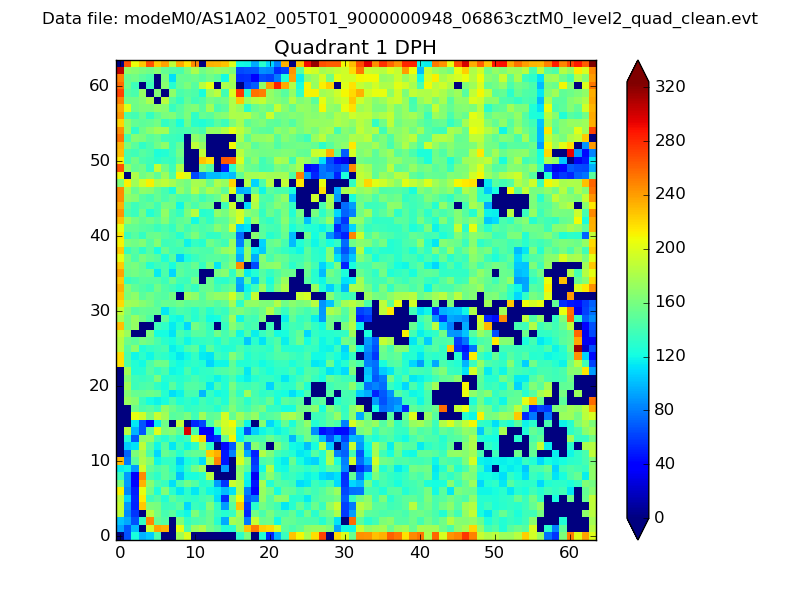 |
Quadrant B |
|---|---|---|---|
| Quadrant D | 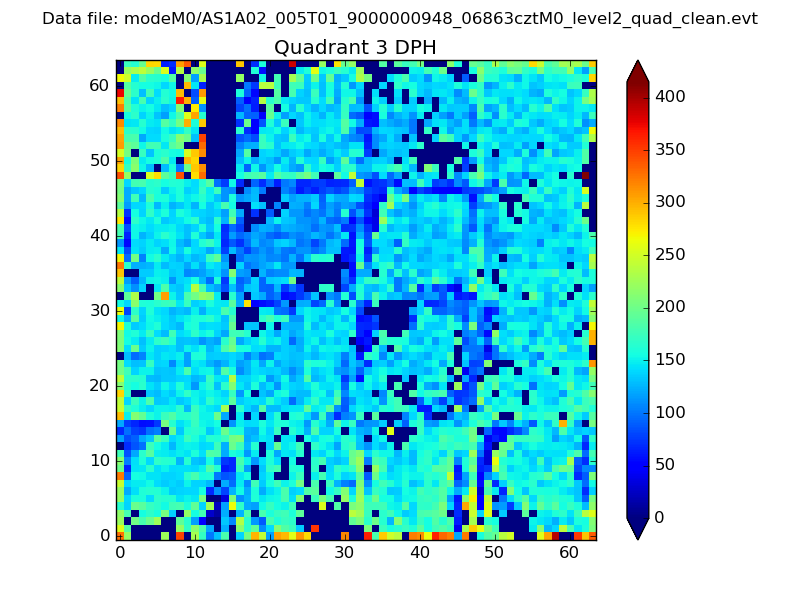 |
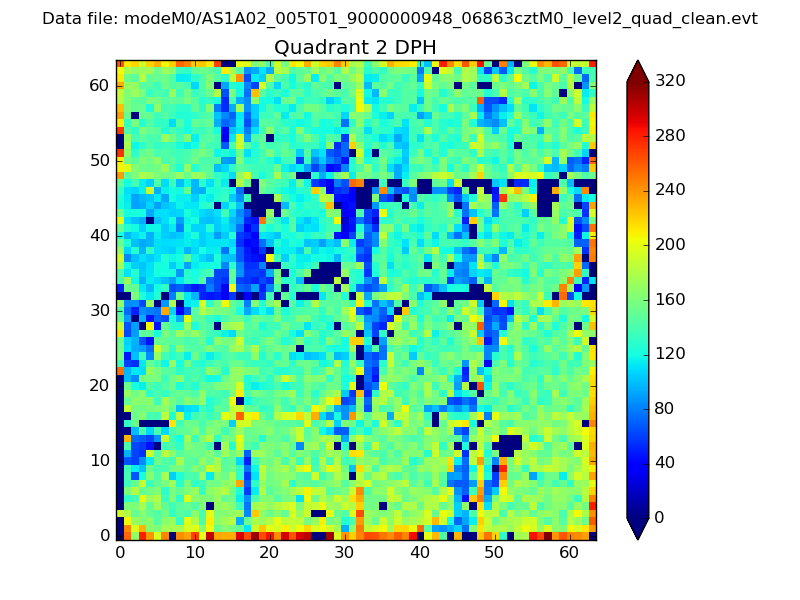 |
Quadrant C |
| Plot type | Count rate plots | Images |
|---|---|---|
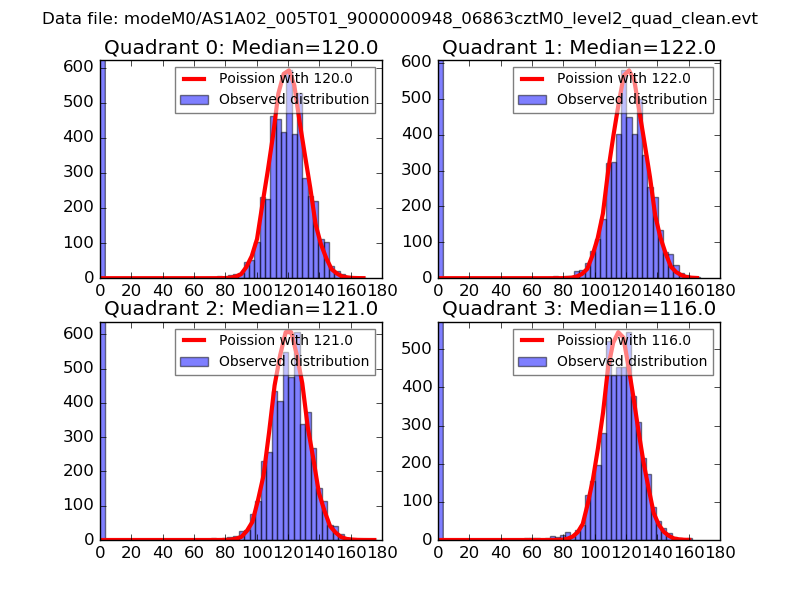
| Comparison with Poisson distribution Blue bars denote a histogram of data divided into 1 sec bins. Red curve is a Poisson curve with rate = median count rate of data. |
 |
 |
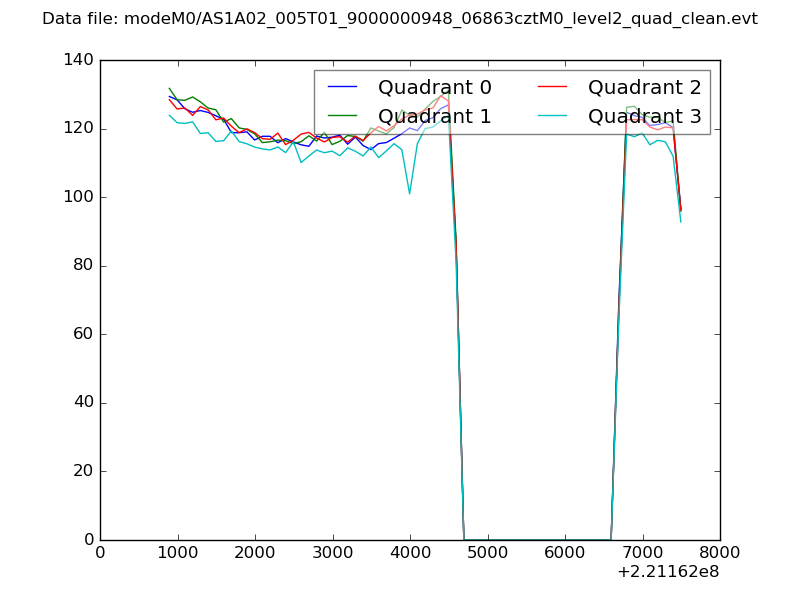
| Quadrant-wise count rates Data is divided into 100 sec bins |
 |
|
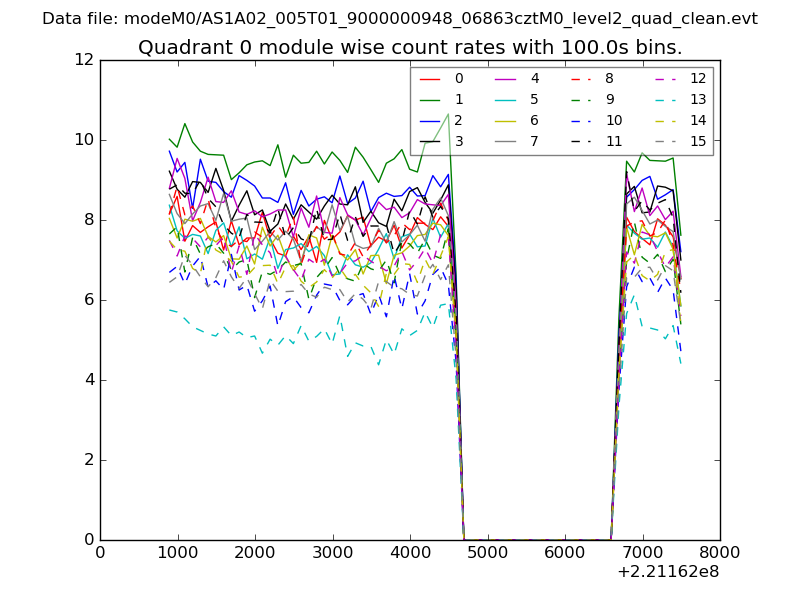
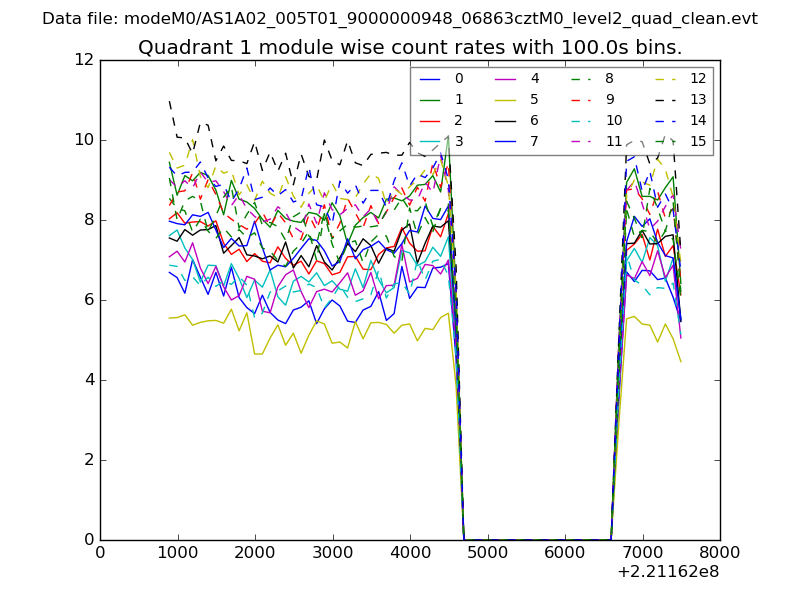
| Module-wise count rates for Quadrant A Data is divided into 100 sec bins |
 |
 |
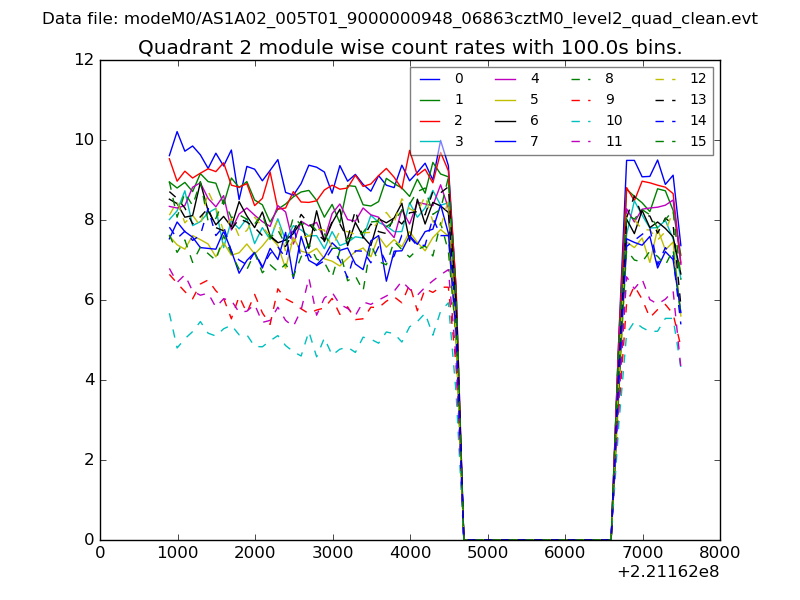
| Module-wise count rates for Quadrant B Data is divided into 100 sec bins |
 |
 |
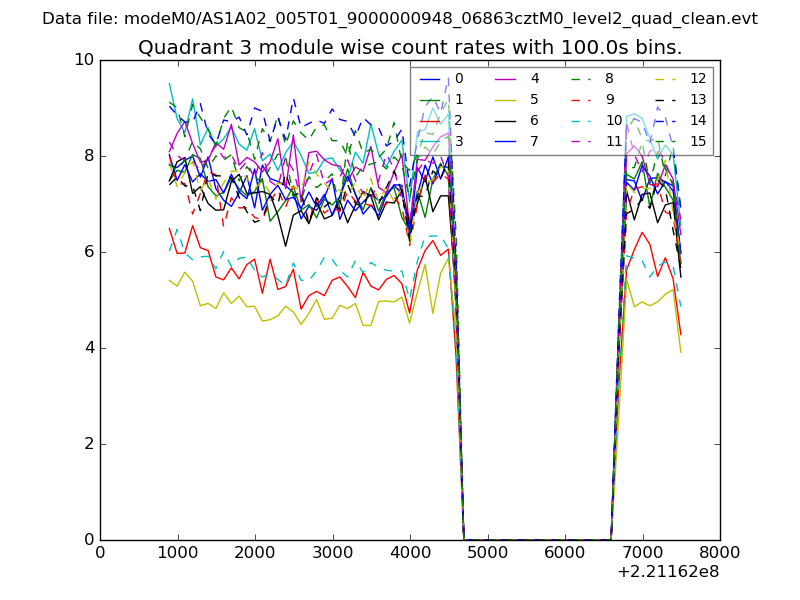
| Module-wise count rates for Quadrant C Data is divided into 100 sec bins |
 |
 |
| Module-wise count rates for Quadrant D Data is divided into 100 sec bins |
 |
 |
| Parameter | Plot |
|---|---|
| CZT HV Monitor | 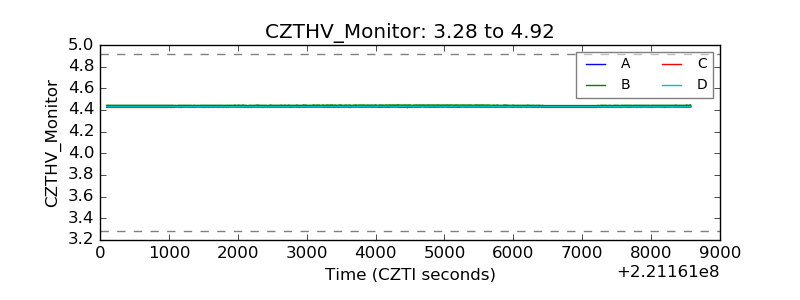 |
| D_VDD | 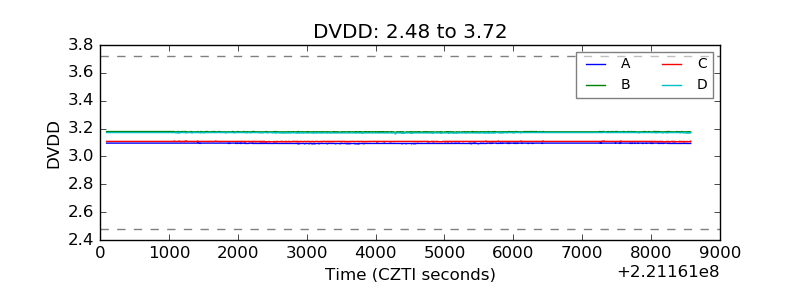 |
| Temperature 1 | 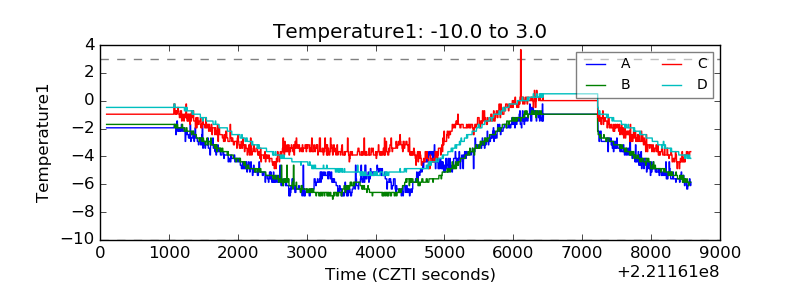 |
| Veto HV Monitor | 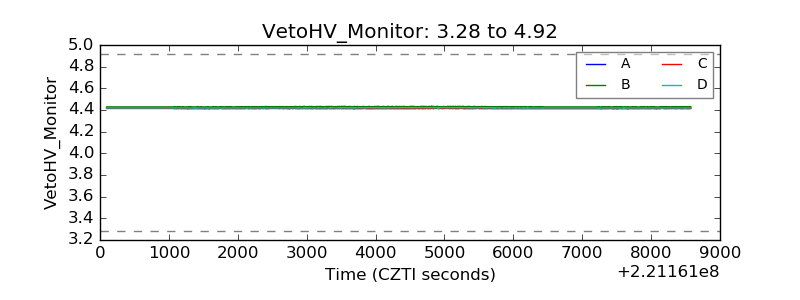 |
| Veto LLD | 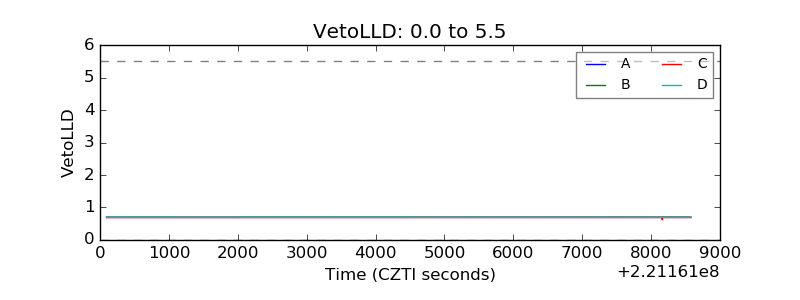 |
| Alpha Counter | 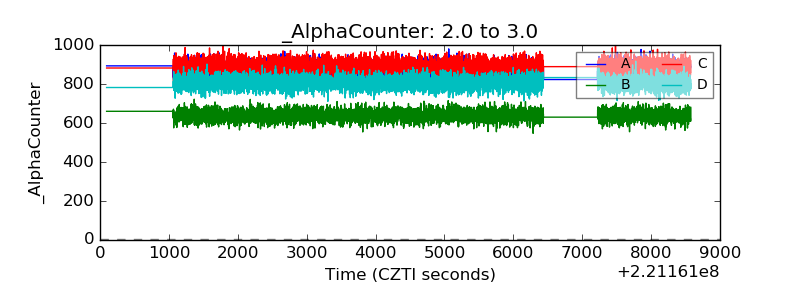 |
| _CPM_Rate | 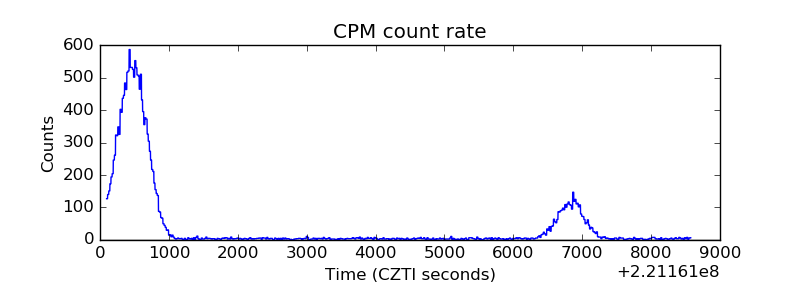 |
| CZT Counter | 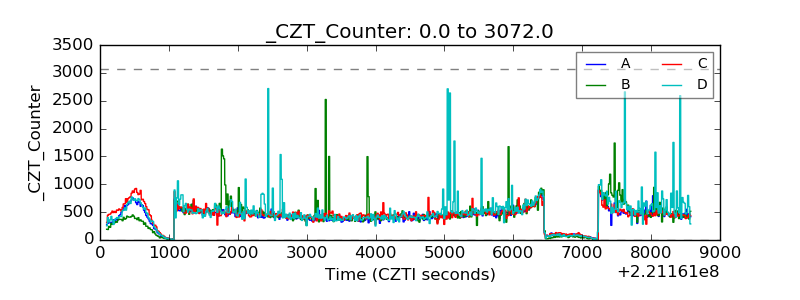 |
| +2.5 Volts monitor | 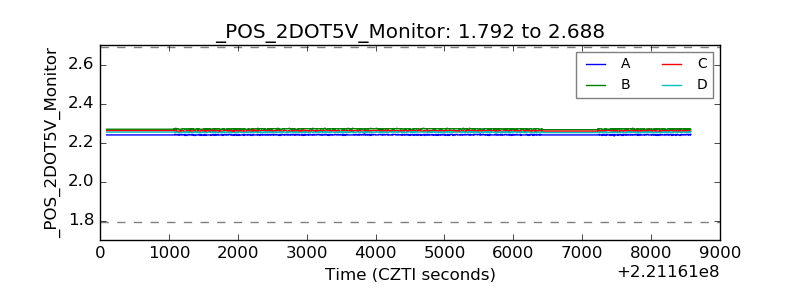 |
| +5 Volts monitor | 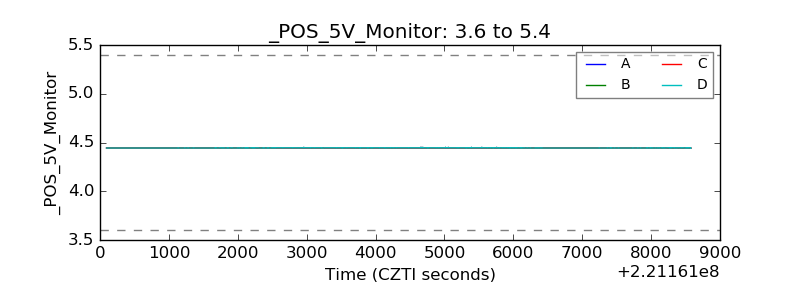 |
| _ROLL_ROT | 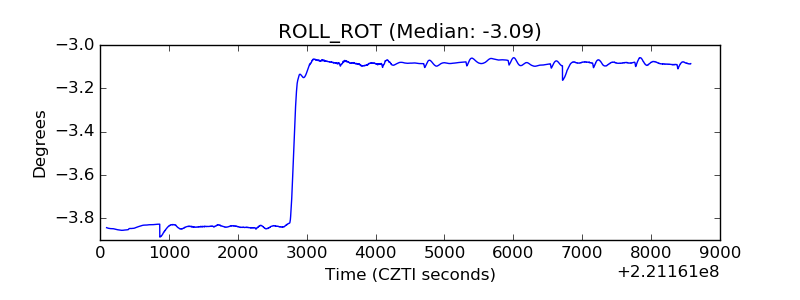 |
| _Roll_DEC | 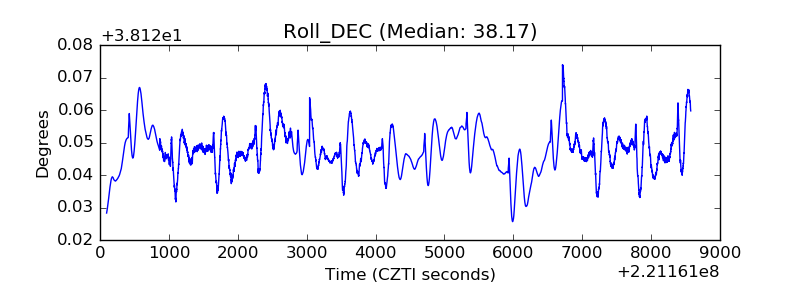 |
| _Roll_RA | 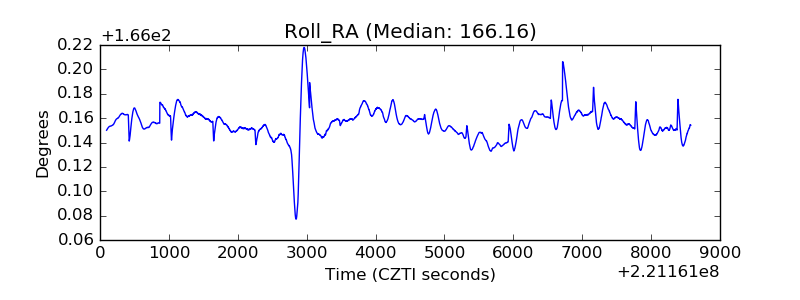 |
| Veto Counter | 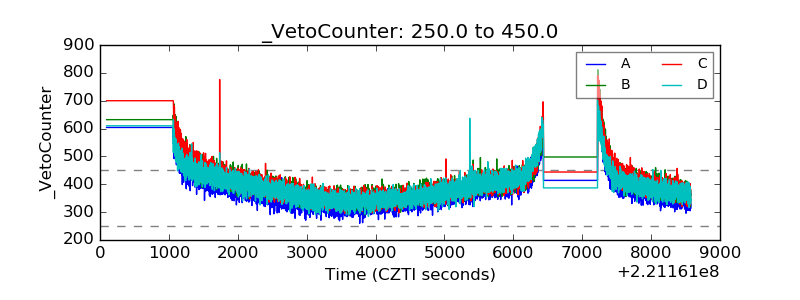 |