| Param | Original file | Final file |
|---|---|---|
| Filename | modeM0/AS1A02_005T01_9000000948_06868cztM0_level2.evt | modeM0/AS1A02_005T01_9000000948_06868cztM0_level2_quad_clean.evt |
| Size (bytes) | 590,253,120 | 124,715,520 |
| Size | 562.9 MB | 118.9 MB |
| Events in quadrant A | 4,160,899 | 785,767 |
| Events in quadrant B | 4,349,353 | 800,430 |
| Events in quadrant C | 4,312,799 | 789,826 |
| Events in quadrant D | 4,422,034 | 756,651 |
| Mode SS | |||
|---|---|---|---|
| Quadrant | BADHDUFLAG | Total packets | Discarded packets |
| A | 0 | 192 | 0 |
| B | 0 | 192 | 0 |
| C | 0 | 192 | 0 |
| D | 0 | 192 | 0 |
| Mode M0 | |||
|---|---|---|---|
| Quadrant | BADHDUFLAG | Total packets | Discarded packets |
| A | 0 | 19093 | 3 |
| B | 0 | 19513 | 2 |
| C | 0 | 19167 | 2 |
| D | 0 | 19863 | 2 |
| Mode M9 | |||
|---|---|---|---|
| Quadrant | BADHDUFLAG | Total packets | Discarded packets |
| A | 0 | 7 | 0 |
| B | 0 | 7 | 0 |
| C | 0 | 7 | 0 |
| D | 0 | 7 | 0 |
| Quadrant | Total seconds | Saturated seconds | Saturation percentage |
|---|---|---|---|
| A | 9285 | 65 | 0.700054% |
| B | 9285 | 98 | 1.055466% |
| C | 9285 | 74 | 0.796984% |
| D | 9285 | 66 | 0.710824% |
Noise dominated data is calculated using 1-second bins in cleaned event files. If a bin has >2000 counts, and if more than 50% of those come from <1% of pixels, then it is considered to be noise-dominated and hence unusable.
| Quadrant | # 1 sec bins | Bins with >0 counts | Bins with >2000 counts | High rate bins dominated by noise | Noise dominated (total time) | Noise dominated (detector-on time) | Marked lightcurve |
|---|---|---|---|---|---|---|---|
| A | 10020 | 9288 | 0 | 0 | 0.00% | 0.00% | 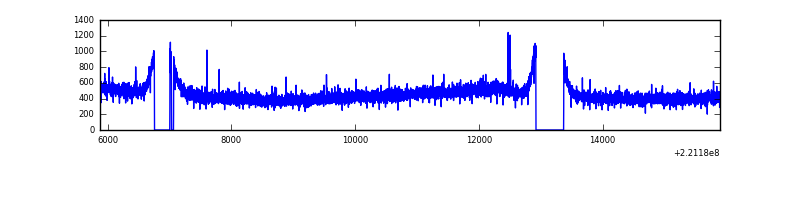 |
| B | 10020 | 9288 | 1 | 1 | 0.01% | 0.01% | 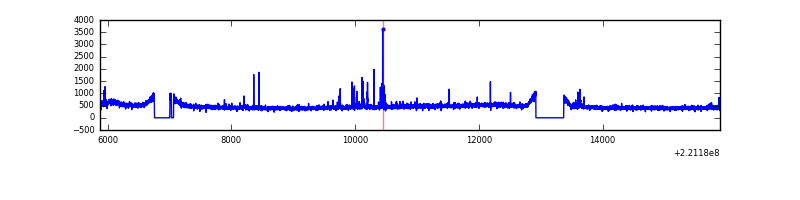 |
| C | 10020 | 9288 | 2 | 2 | 0.02% | 0.02% | 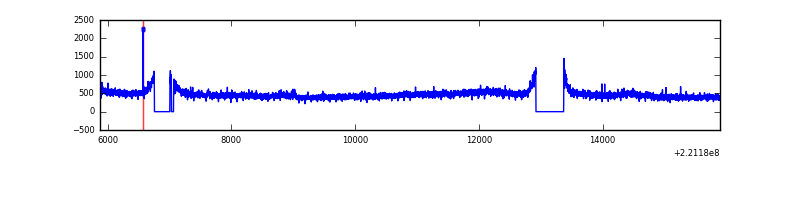 |
| D | 10020 | 9288 | 33 | 33 | 0.33% | 0.36% | 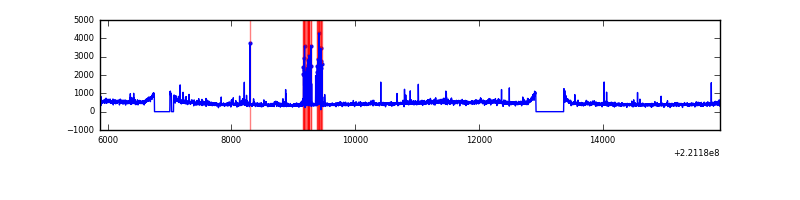 |
Top three noisy pixels from each quadrant. If the there are fewer than three noisy pixels in the level2.evt file, extra rows are filled as -1
| Pixel properties | Quadrant properties | ||||||
|---|---|---|---|---|---|---|---|
| Quadrant | DetID | PixID | Counts | Sigma | Mean | Median | Sigma |
| A | 13 | 248 | 14653 | 61.65 | 1074 | 1050 | 220.6 |
| A | 0 | 226 | 10135 | 41.18 | 1074 | 1050 | 220.6 |
| A | 12 | 194 | 9948 | 40.33 | 1074 | 1050 | 220.6 |
| B | 4 | 48 | 77414 | 366.53 | 1086 | 1059 | 208.3 |
| B | 0 | 187 | 27414 | 126.51 | 1086 | 1059 | 208.3 |
| B | 12 | 111 | 21845 | 99.78 | 1086 | 1059 | 208.3 |
| C | 9 | 247 | 215620 | 884.43 | 1042 | 1048 | 242.6 |
| C | 8 | 128 | 9301 | 34.02 | 1042 | 1048 | 242.6 |
| C | 12 | 4 | 8852 | 32.17 | 1042 | 1048 | 242.6 |
| D | 13 | 169 | 209809 | 816.92 | 1039 | 1006 | 255.6 |
| D | 8 | 195 | 109745 | 425.43 | 1039 | 1006 | 255.6 |
| D | 2 | 152 | 83583 | 323.07 | 1039 | 1006 | 255.6 |
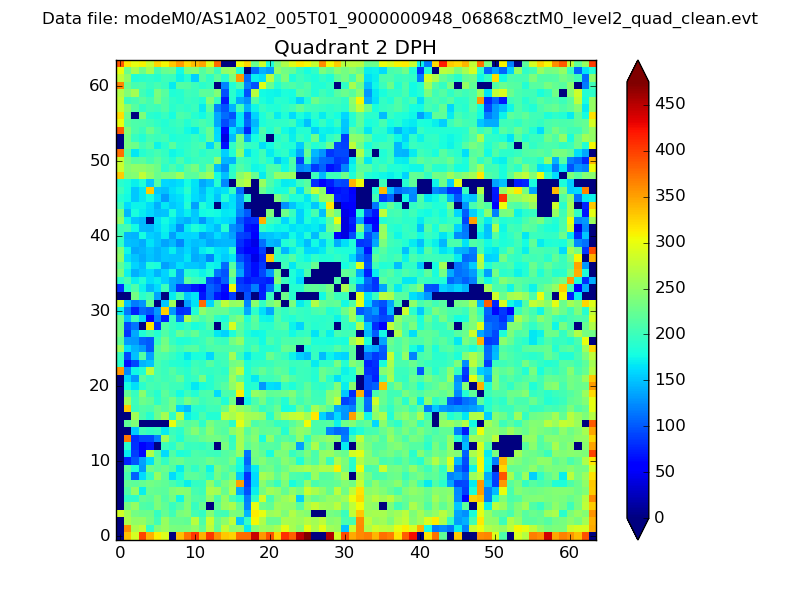
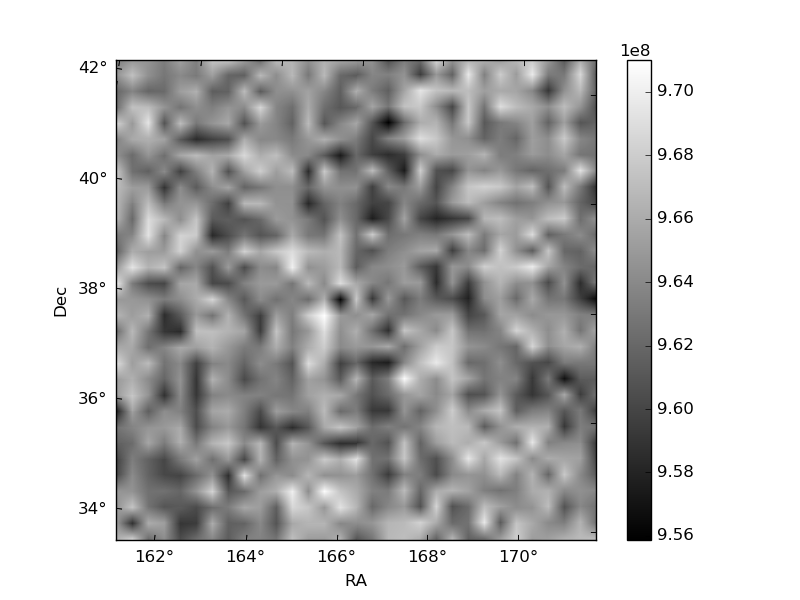
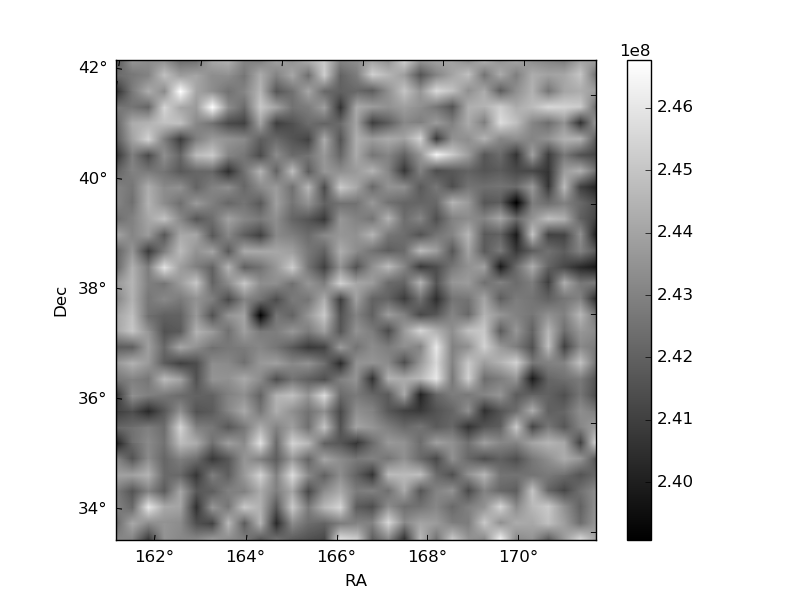
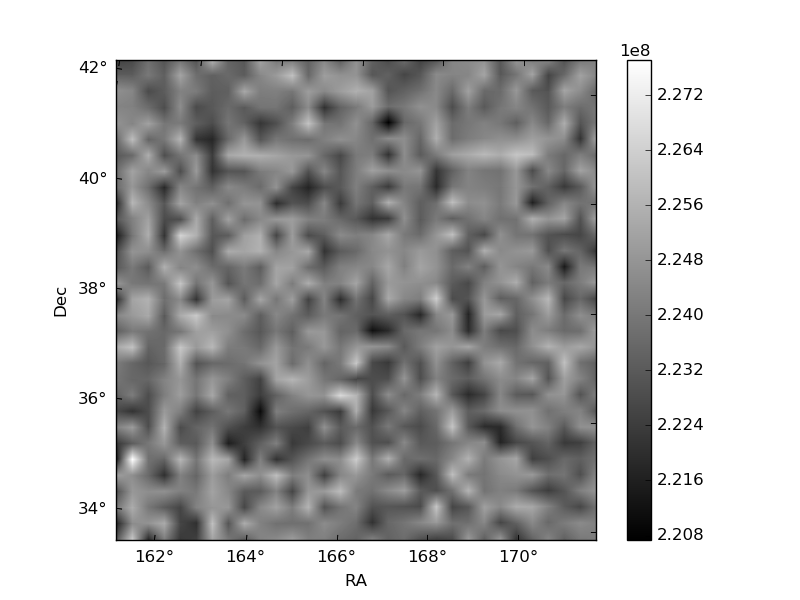
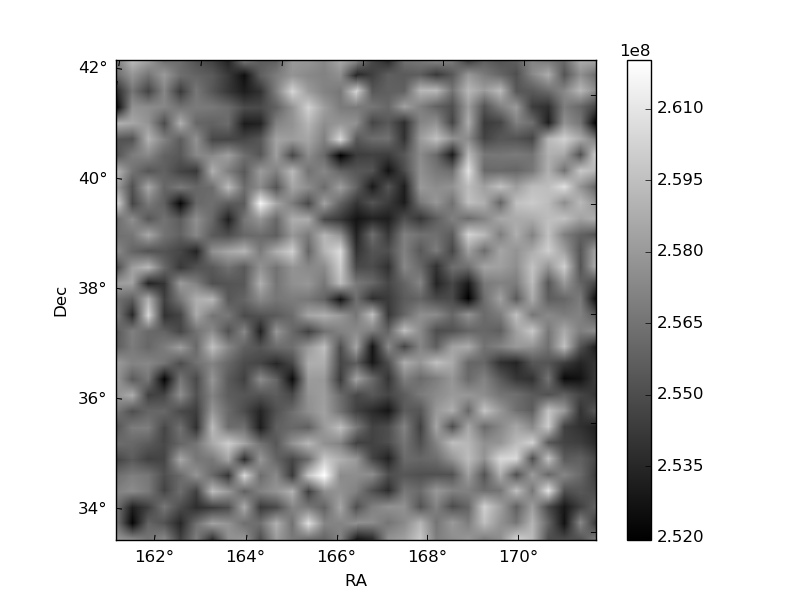
Histogram calculated using DETX and DETY for each event in the final _common_clean file
| Quadrant A | 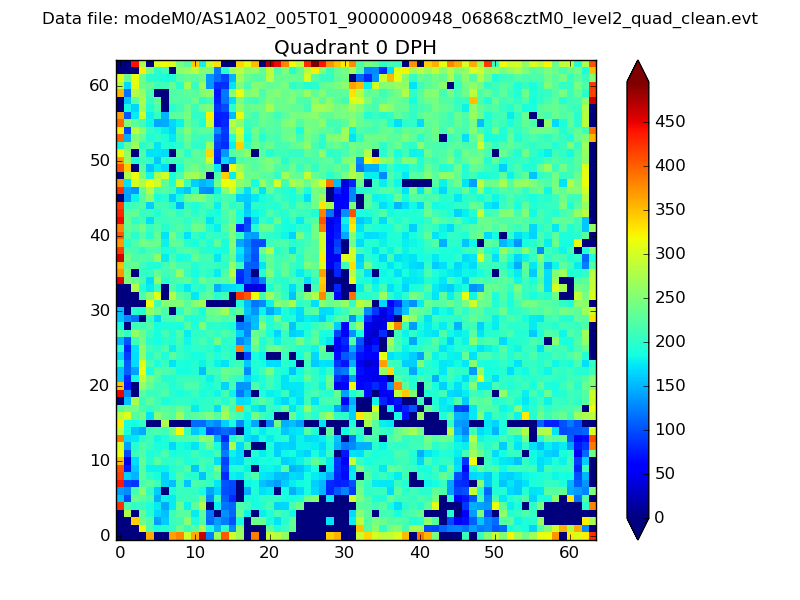 |
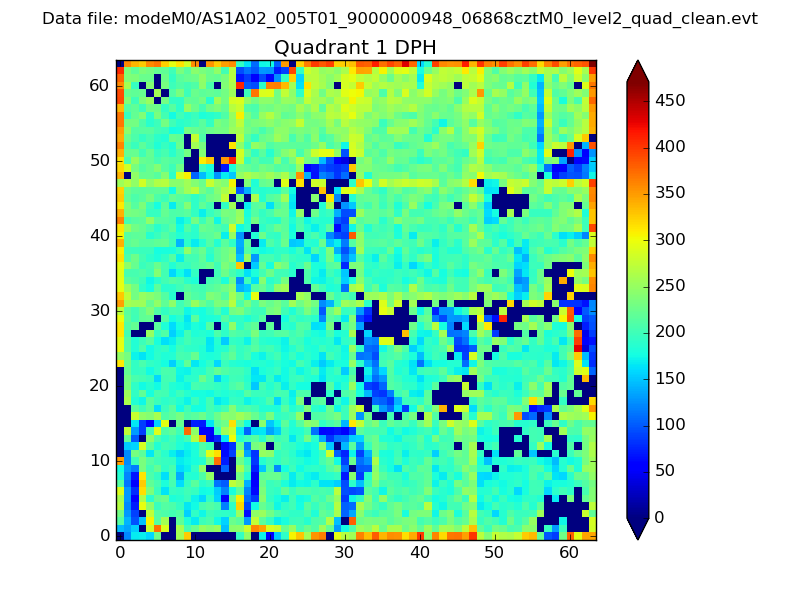 |
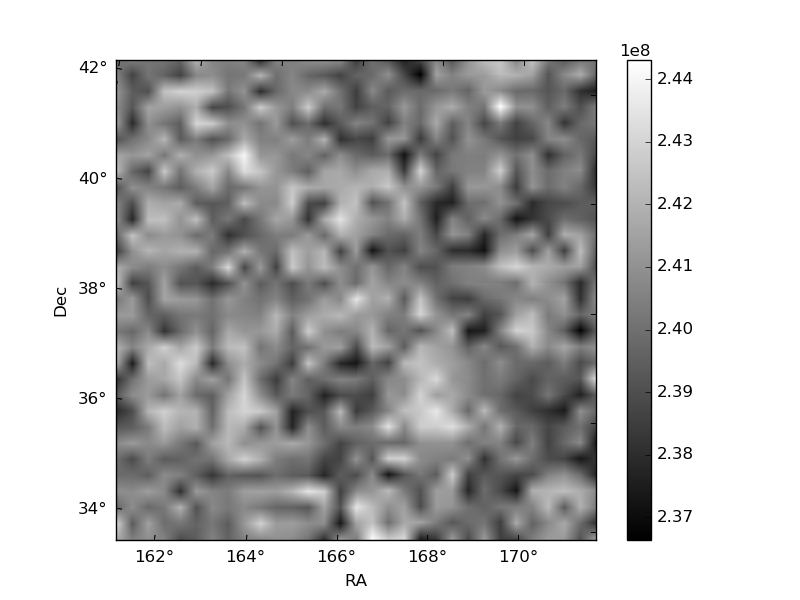
Quadrant B |
|---|---|---|---|
| Quadrant D | 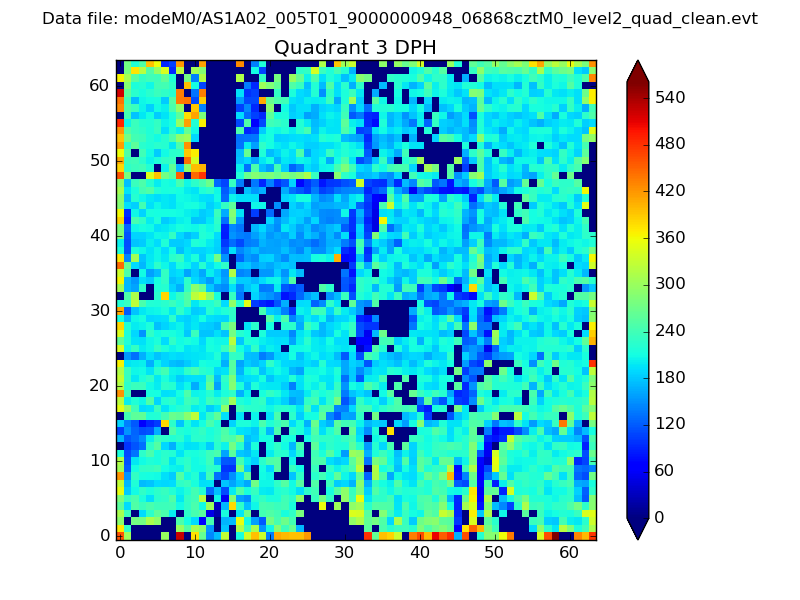 |
 |
Quadrant C |
| Plot type | Count rate plots | Images |
|---|---|---|
| Comparison with Poisson distribution Blue bars denote a histogram of data divided into 1 sec bins. Red curve is a Poisson curve with rate = median count rate of data. |
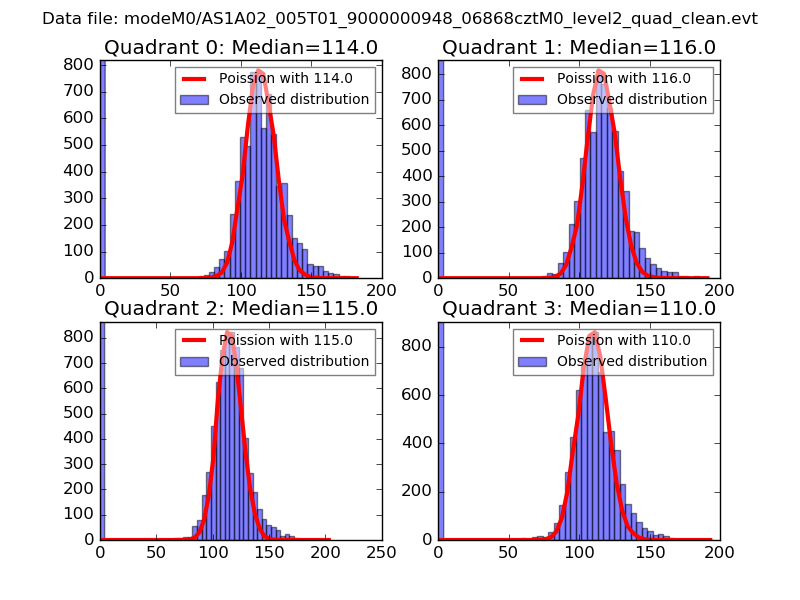 |
 |
| Quadrant-wise count rates Data is divided into 100 sec bins |
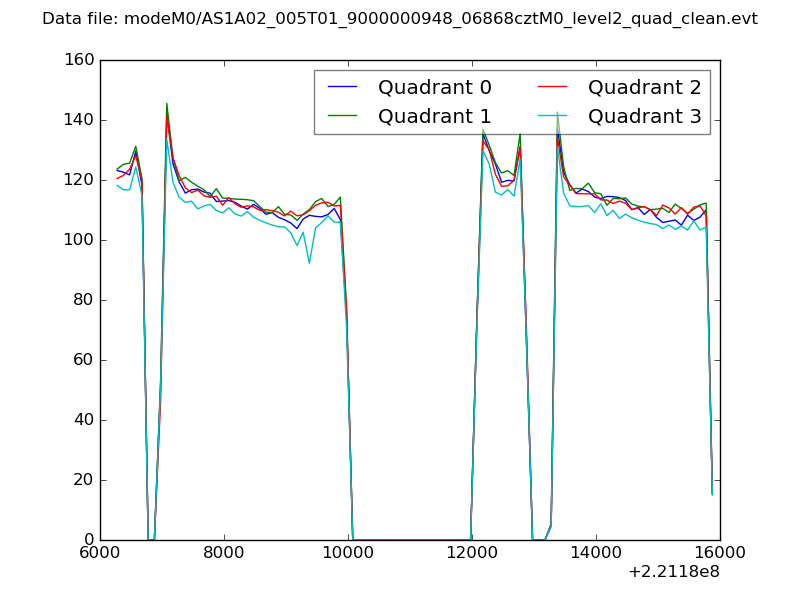 |
|
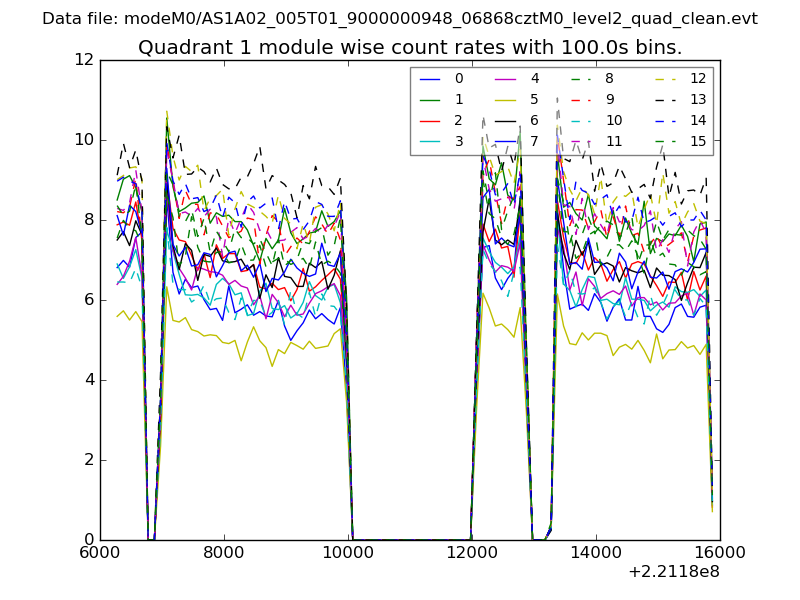
| Module-wise count rates for Quadrant A Data is divided into 100 sec bins |
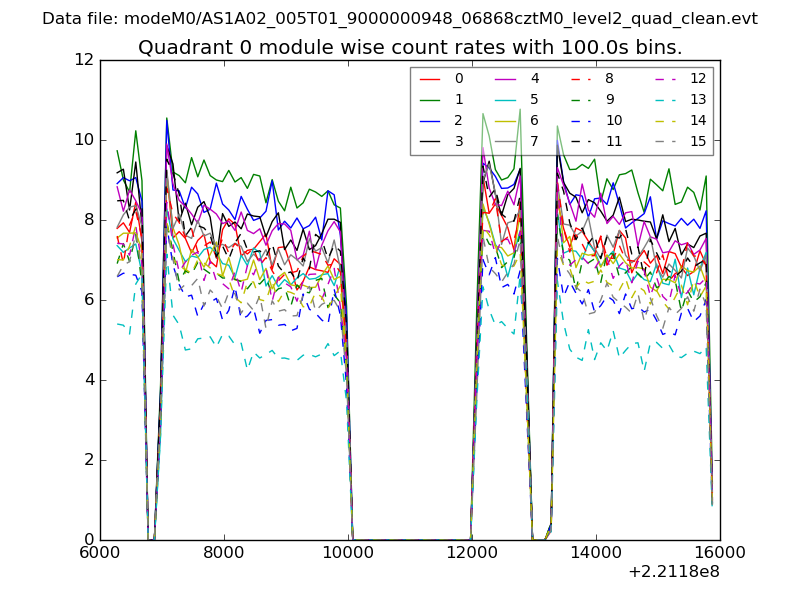 |
 |
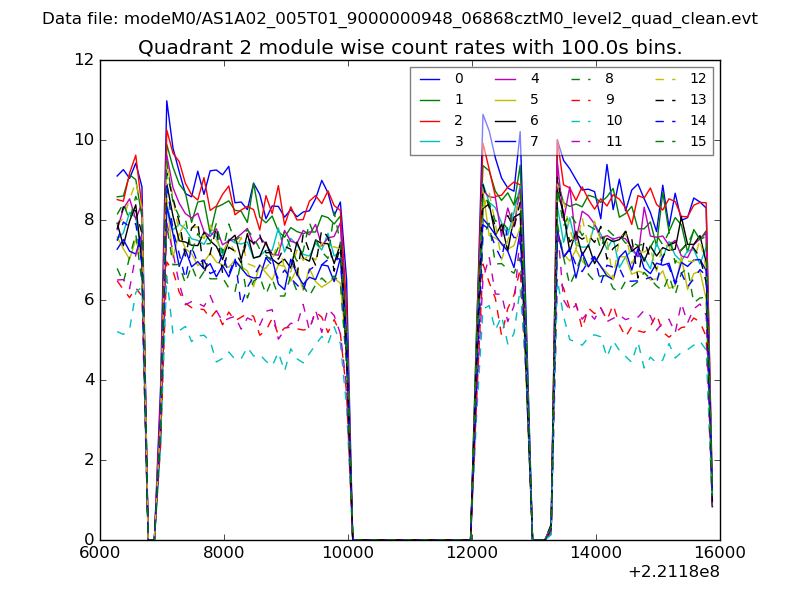
| Module-wise count rates for Quadrant B Data is divided into 100 sec bins |
 |
 |
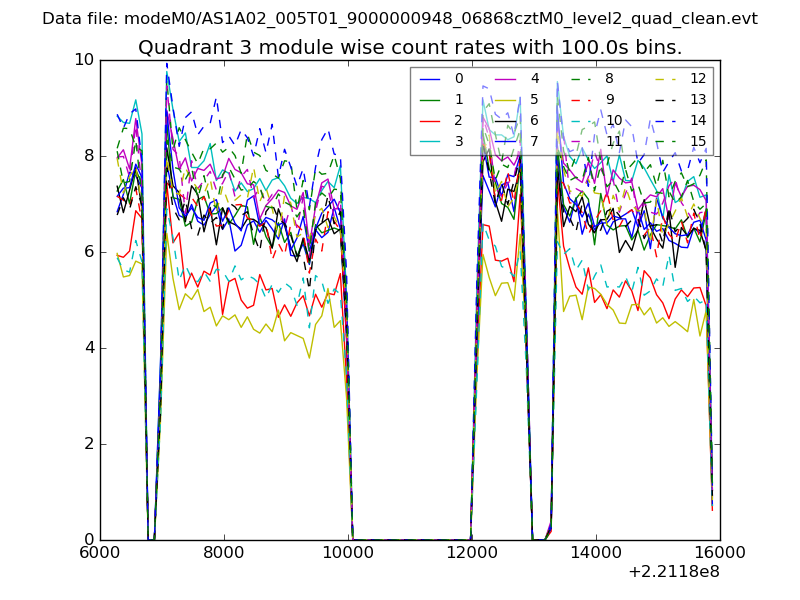
| Module-wise count rates for Quadrant C Data is divided into 100 sec bins |
 |
 |
| Module-wise count rates for Quadrant D Data is divided into 100 sec bins |
 |
 |
| Parameter | Plot |
|---|---|
| CZT HV Monitor | 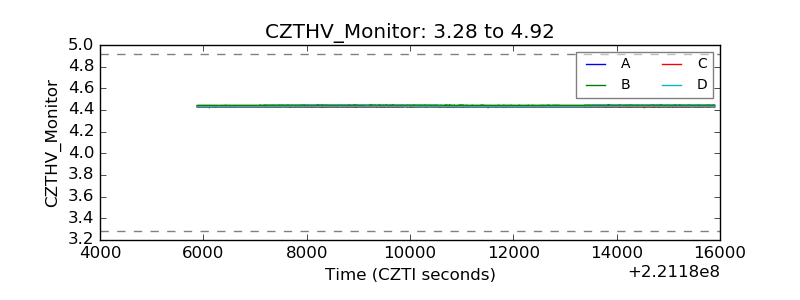 |
| D_VDD | 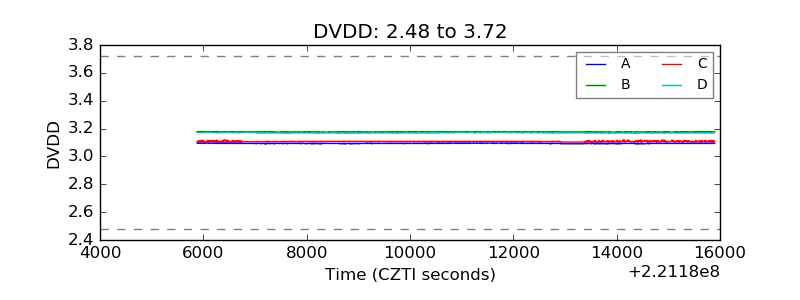 |
| Temperature 1 | 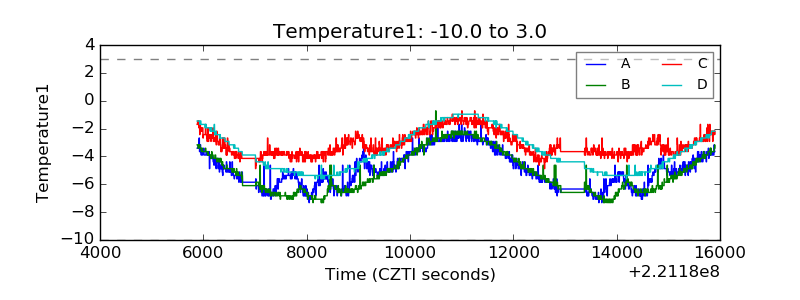 |
| Veto HV Monitor | 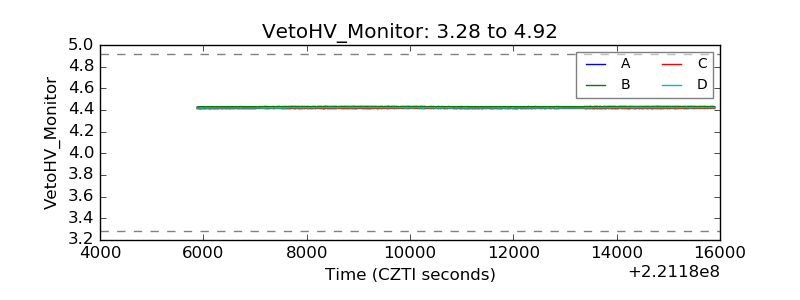 |
| Veto LLD | 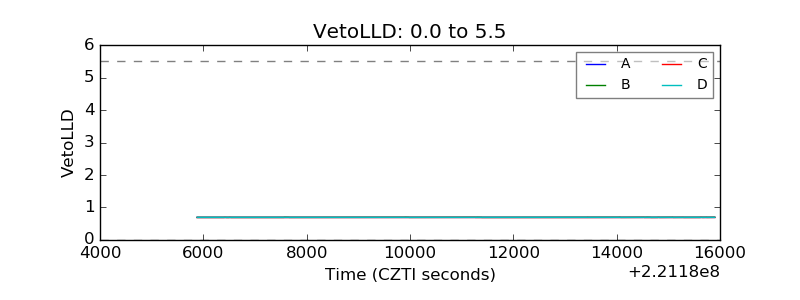 |
| Alpha Counter | 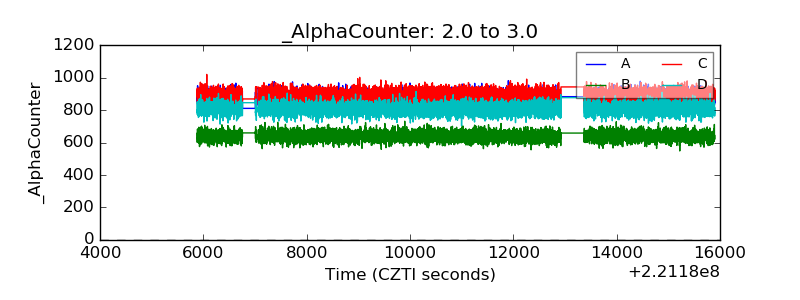 |
| _CPM_Rate | 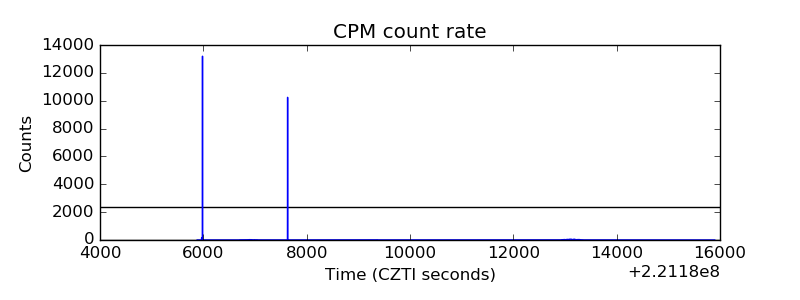 |
| CZT Counter | 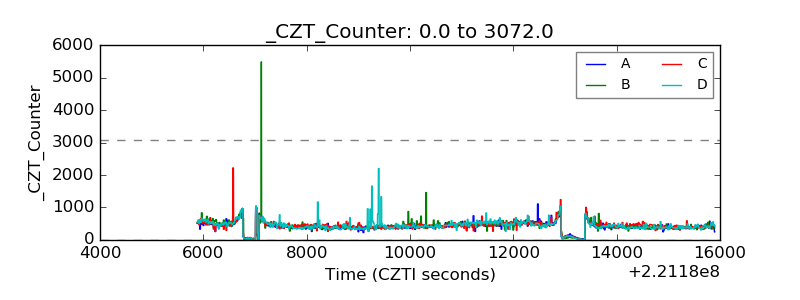 |
| +2.5 Volts monitor | 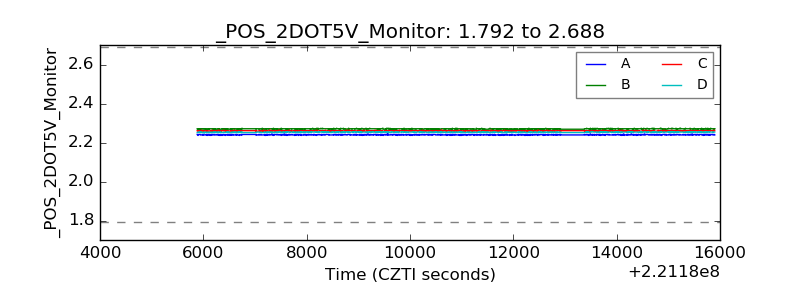 |
| +5 Volts monitor | 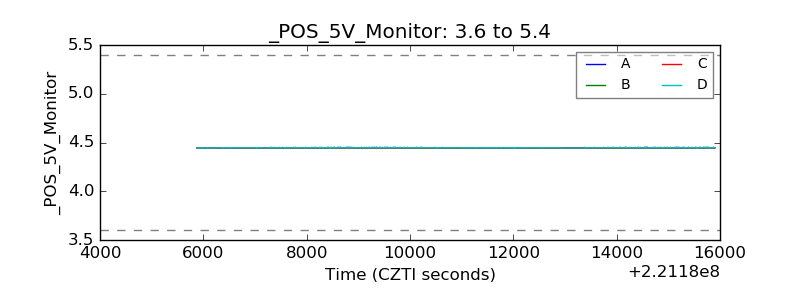 |
| _ROLL_ROT | 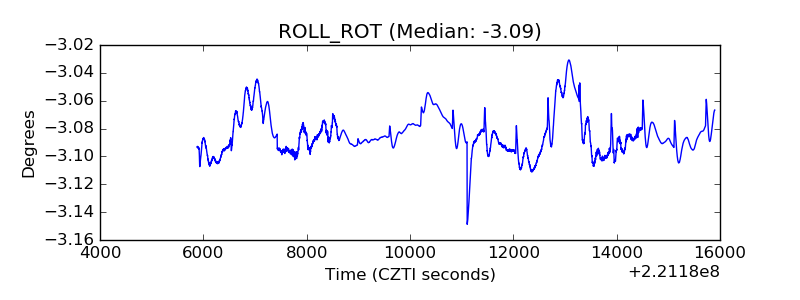 |
| _Roll_DEC | 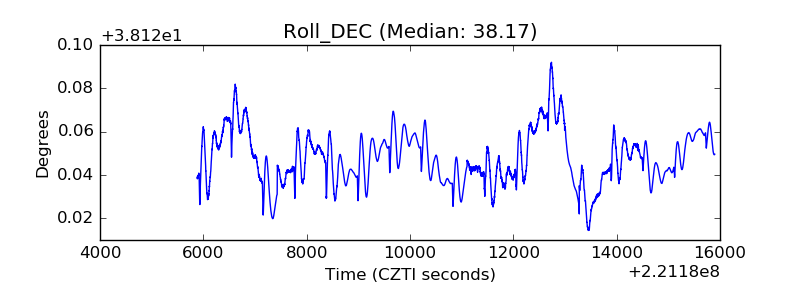 |
| _Roll_RA | 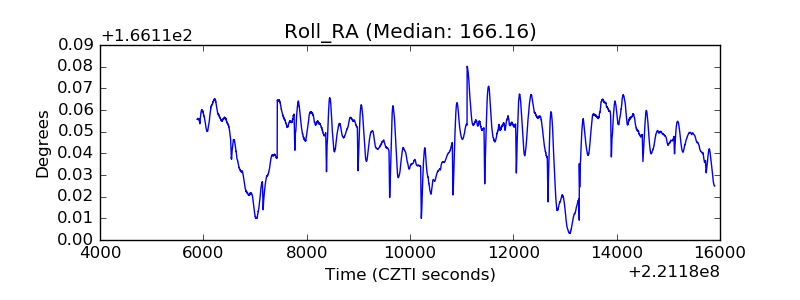 |
| Veto Counter | 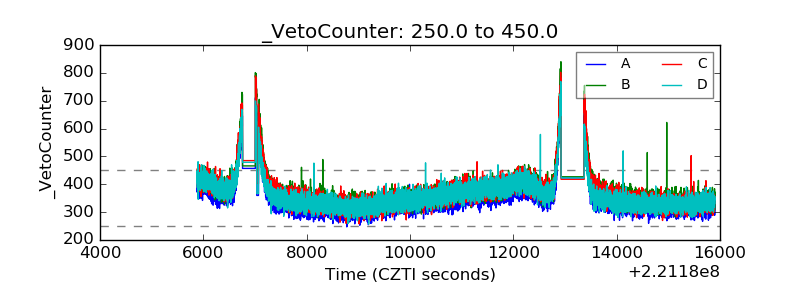 |