| Param | Original file | Final file |
|---|---|---|
| Filename | modeM0/AS1A02_005T01_9000000948_06873cztM0_level2.evt | modeM0/AS1A02_005T01_9000000948_06873cztM0_level2_quad_clean.evt |
| Size (bytes) | 437,431,680 | 70,099,200 |
| Size | 417.2 MB | 66.9 MB |
| Events in quadrant A | 3,141,542 | 423,345 |
| Events in quadrant B | 3,188,699 | 426,114 |
| Events in quadrant C | 3,189,936 | 419,550 |
| Events in quadrant D | 3,294,048 | 408,537 |
| Mode SS | |||
|---|---|---|---|
| Quadrant | BADHDUFLAG | Total packets | Discarded packets |
| A | 0 | 130 | 0 |
| B | 0 | 130 | 0 |
| C | 0 | 130 | 0 |
| D | 0 | 130 | 0 |
| Mode M0 | |||
|---|---|---|---|
| Quadrant | BADHDUFLAG | Total packets | Discarded packets |
| A | 0 | 13398 | 2 |
| B | 0 | 13420 | 1 |
| C | 0 | 13364 | 1 |
| D | 0 | 13735 | 1 |
| Mode M9 | |||
|---|---|---|---|
| Quadrant | BADHDUFLAG | Total packets | Discarded packets |
| A | 0 | 12 | 0 |
| B | 0 | 12 | 0 |
| C | 0 | 12 | 0 |
| D | 0 | 12 | 0 |
| Quadrant | Total seconds | Saturated seconds | Saturation percentage |
|---|---|---|---|
| A | 6374 | 54 | 0.847192% |
| B | 6374 | 53 | 0.831503% |
| C | 6374 | 54 | 0.847192% |
| D | 6374 | 51 | 0.800126% |
Noise dominated data is calculated using 1-second bins in cleaned event files. If a bin has >2000 counts, and if more than 50% of those come from <1% of pixels, then it is considered to be noise-dominated and hence unusable.
| Quadrant | # 1 sec bins | Bins with >0 counts | Bins with >2000 counts | High rate bins dominated by noise | Noise dominated (total time) | Noise dominated (detector-on time) | Marked lightcurve |
|---|---|---|---|---|---|---|---|
| A | 7609 | 6375 | 0 | 0 | 0.00% | 0.00% | 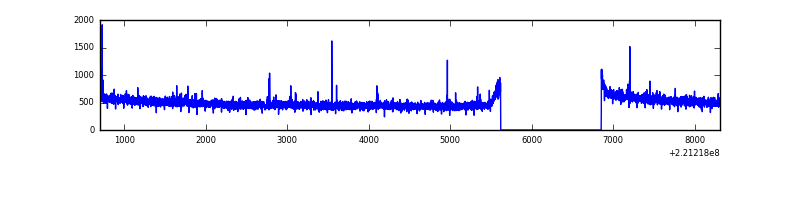 |
| B | 7609 | 6375 | 3 | 3 | 0.04% | 0.05% | 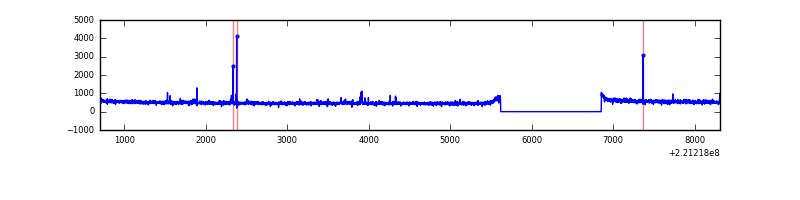 |
| C | 7609 | 6375 | 0 | 0 | 0.00% | 0.00% | 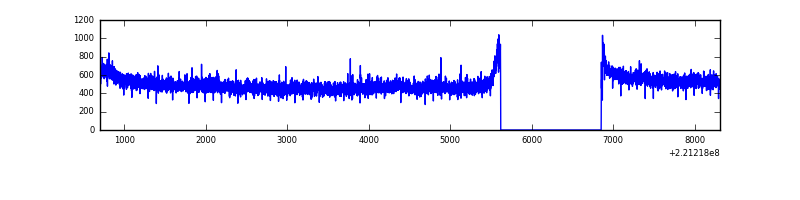 |
| D | 7609 | 6375 | 2 | 2 | 0.03% | 0.03% | 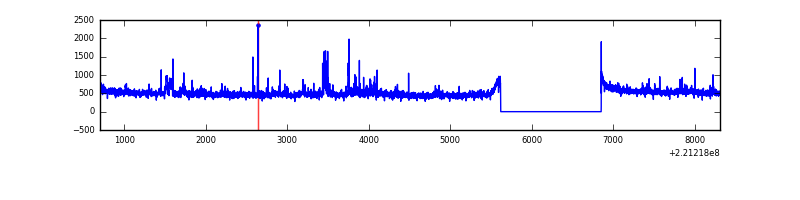 |
Top three noisy pixels from each quadrant. If the there are fewer than three noisy pixels in the level2.evt file, extra rows are filled as -1
| Pixel properties | Quadrant properties | ||||||
|---|---|---|---|---|---|---|---|
| Quadrant | DetID | PixID | Counts | Sigma | Mean | Median | Sigma |
| A | 15 | 223 | 15307 | 88.44 | 807 | 791 | 164.1 |
| A | 13 | 248 | 14585 | 84.04 | 807 | 791 | 164.1 |
| A | 0 | 226 | 7711 | 42.16 | 807 | 791 | 164.1 |
| B | 0 | 214 | 18533 | 117.13 | 804 | 787 | 151.5 |
| B | 4 | 48 | 16426 | 103.22 | 804 | 787 | 151.5 |
| B | 12 | 111 | 14173 | 88.35 | 804 | 787 | 151.5 |
| C | 9 | 247 | 147732 | 820.55 | 778 | 782 | 179.1 |
| C | 13 | 61 | 6205 | 30.28 | 778 | 782 | 179.1 |
| C | 7 | 159 | 2769 | 11.1 | 778 | 782 | 179.1 |
| D | 12 | 221 | 143175 | 737.58 | 788 | 764 | 193.1 |
| D | 8 | 195 | 56816 | 290.31 | 788 | 764 | 193.1 |
| D | 2 | 152 | 37771 | 191.67 | 788 | 764 | 193.1 |
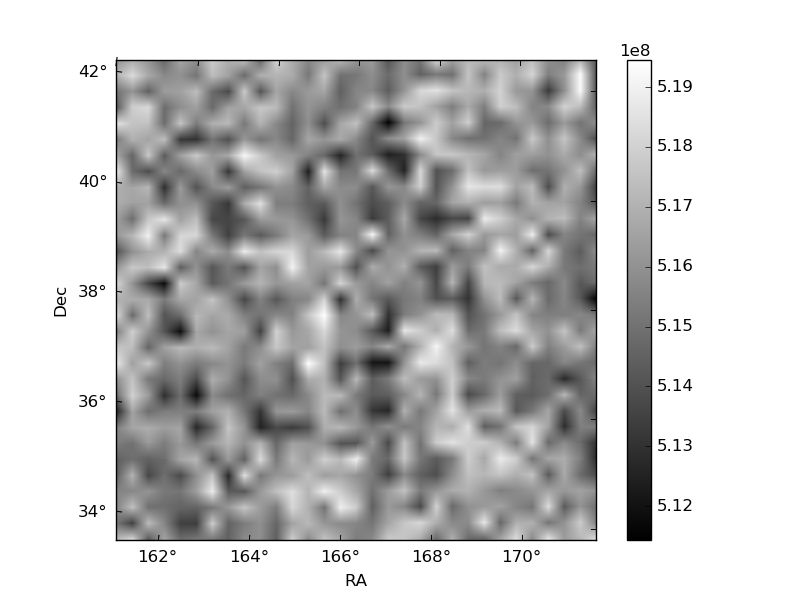
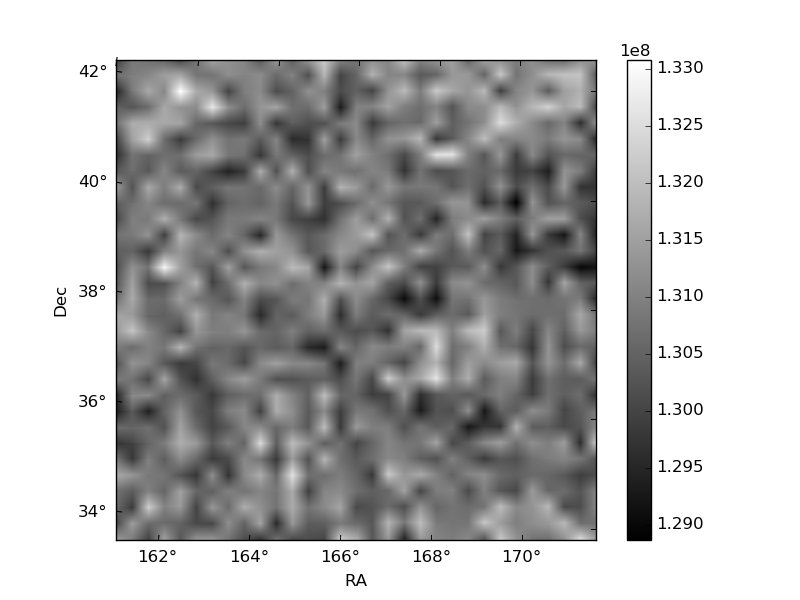
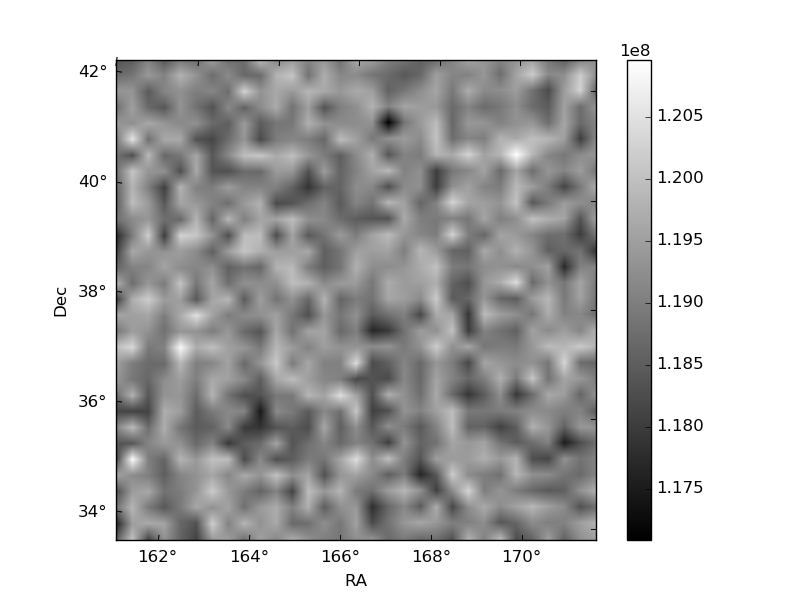
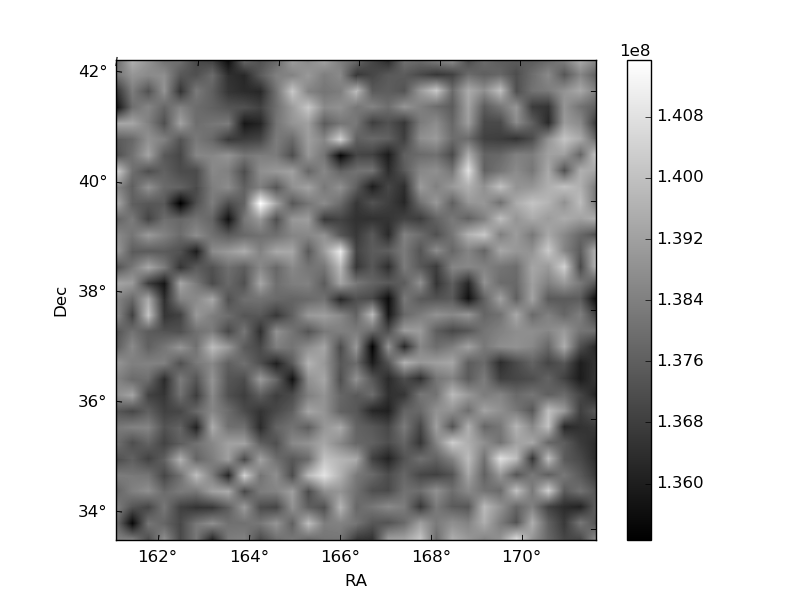
Histogram calculated using DETX and DETY for each event in the final _common_clean file
| Quadrant A | 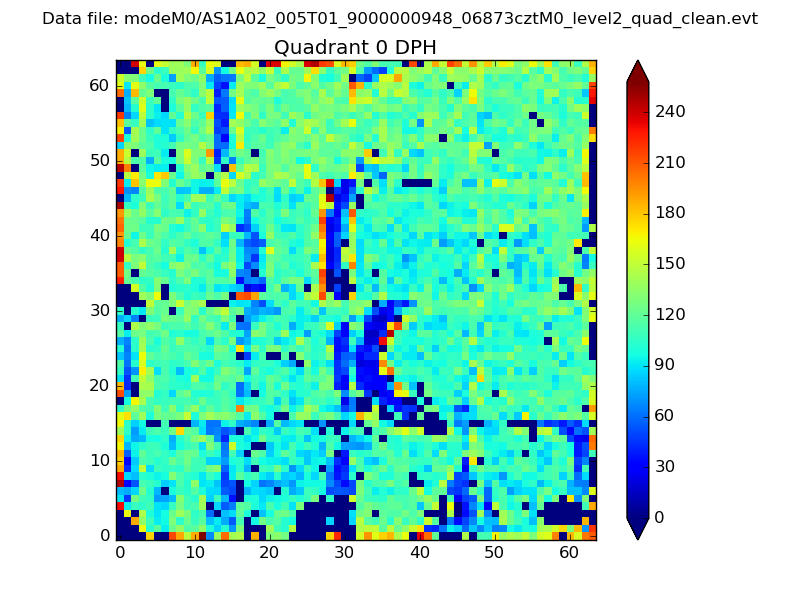 |
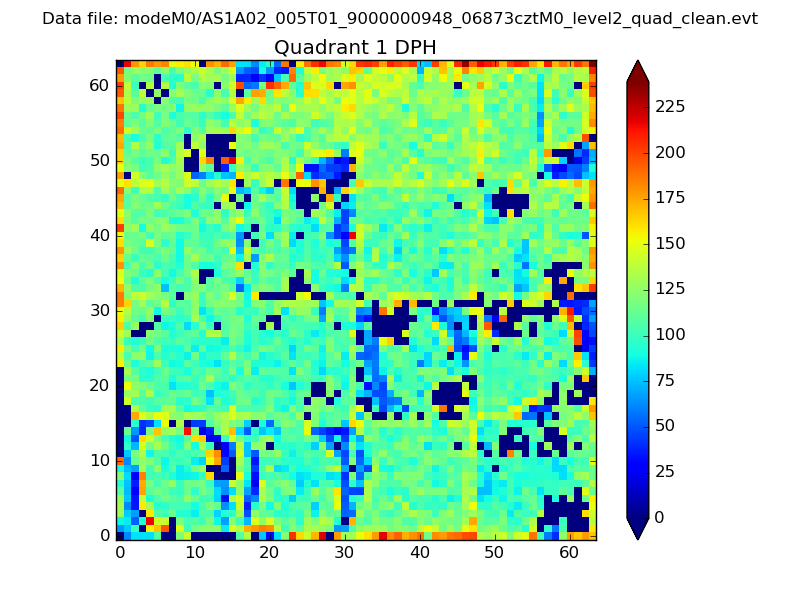 |
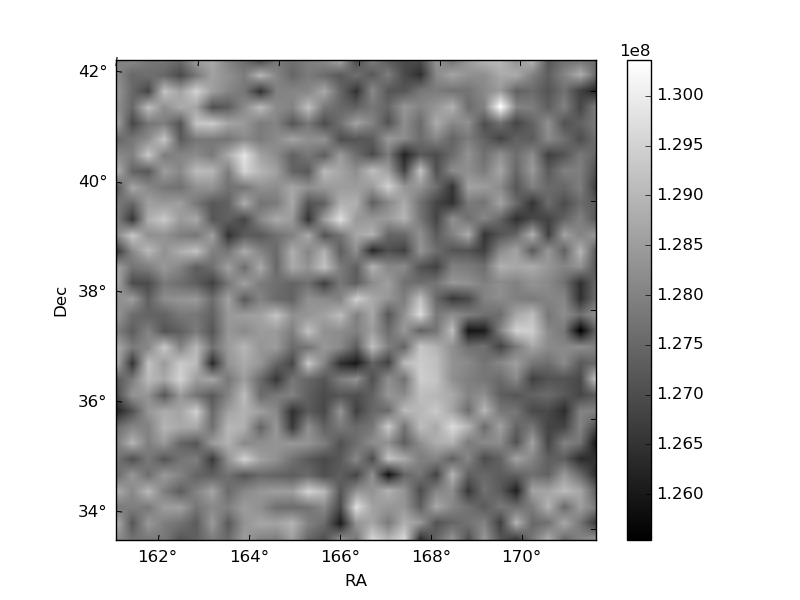
Quadrant B |
|---|---|---|---|
| Quadrant D | 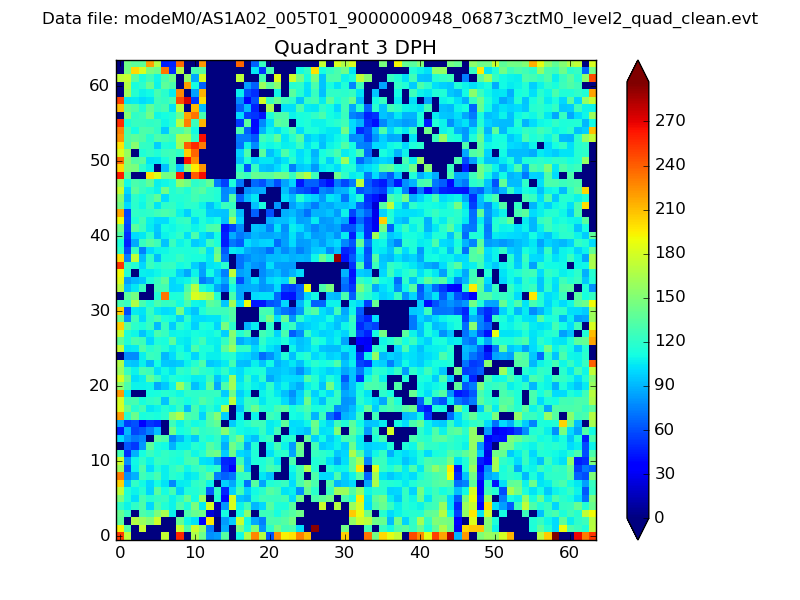 |
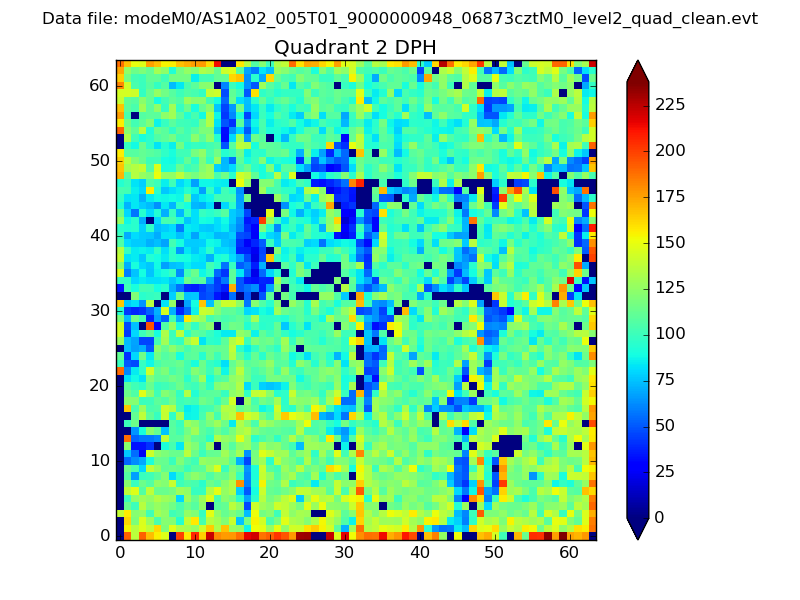 |
Quadrant C |
| Plot type | Count rate plots | Images |
|---|---|---|
| Comparison with Poisson distribution Blue bars denote a histogram of data divided into 1 sec bins. Red curve is a Poisson curve with rate = median count rate of data. |
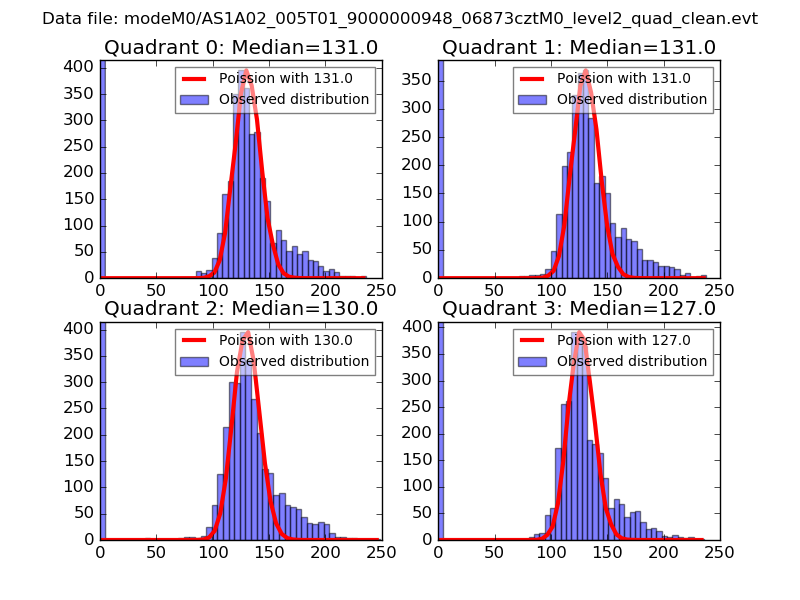 |
 |
| Quadrant-wise count rates Data is divided into 100 sec bins |
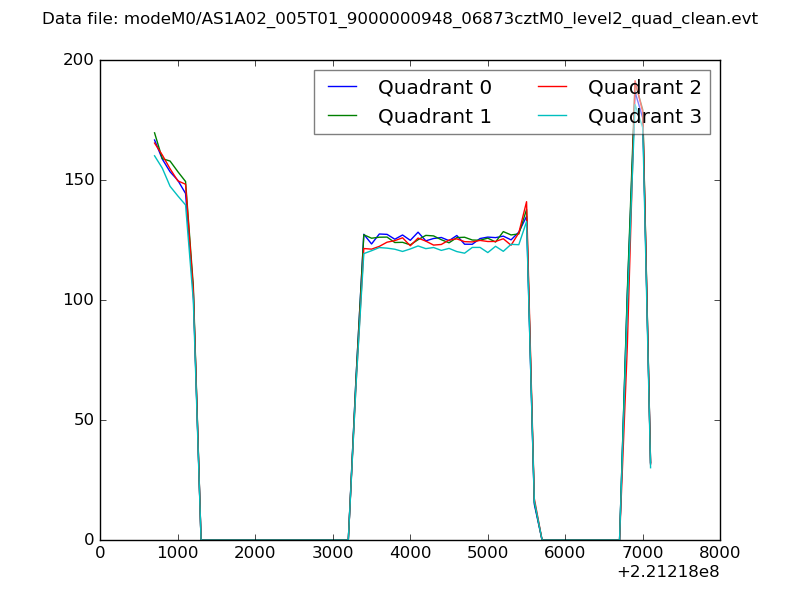 |
|
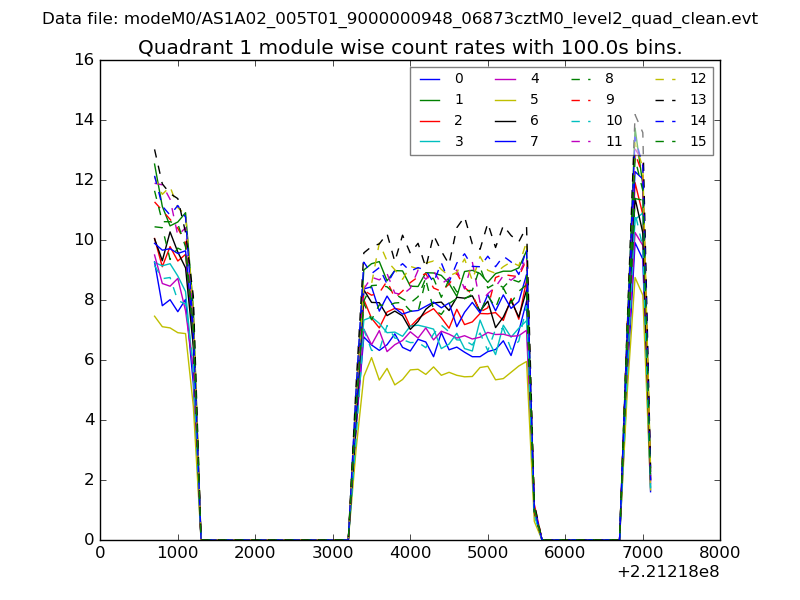
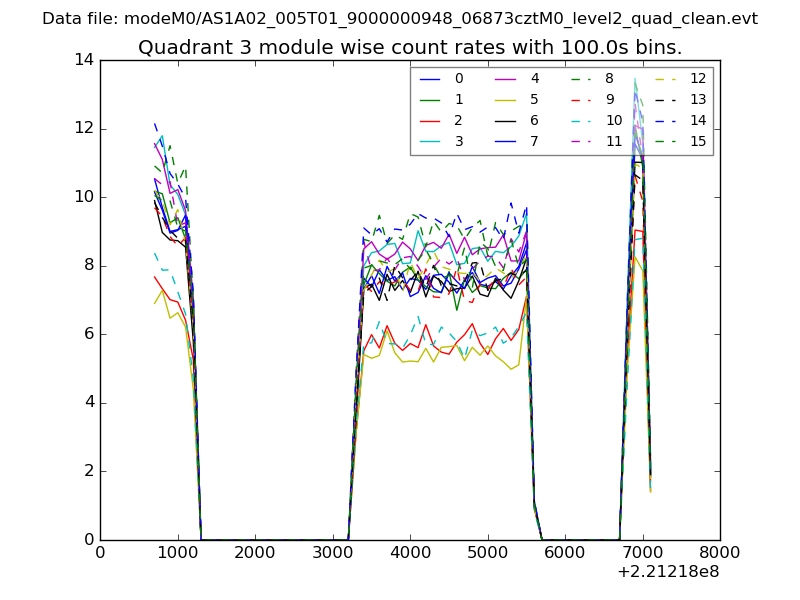
| Module-wise count rates for Quadrant A Data is divided into 100 sec bins |
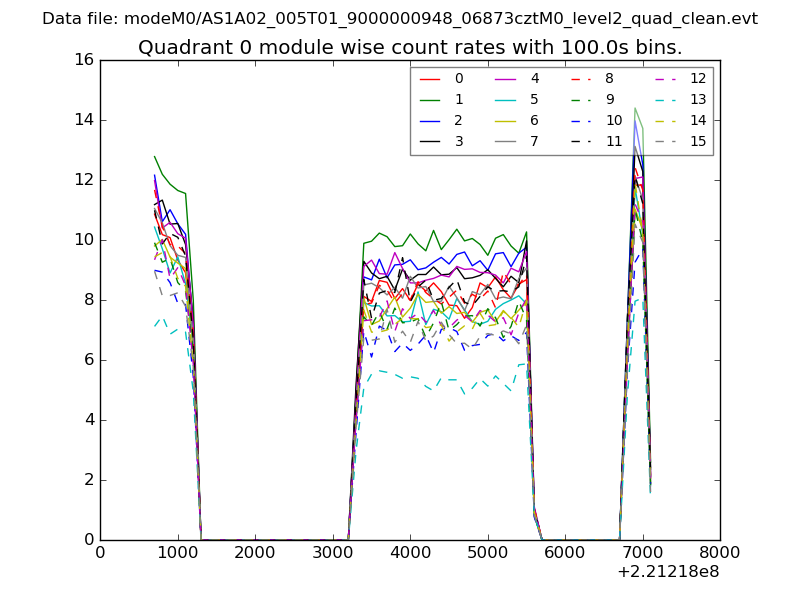 |
 |
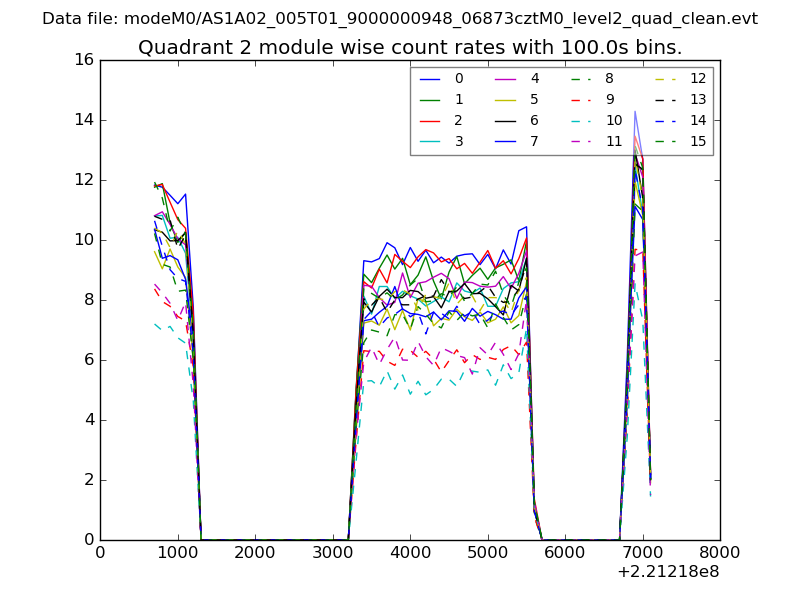
| Module-wise count rates for Quadrant B Data is divided into 100 sec bins |
 |
 |
| Module-wise count rates for Quadrant C Data is divided into 100 sec bins |
 |
 |
| Module-wise count rates for Quadrant D Data is divided into 100 sec bins |
 |
 |
| Parameter | Plot |
|---|---|
| CZT HV Monitor | 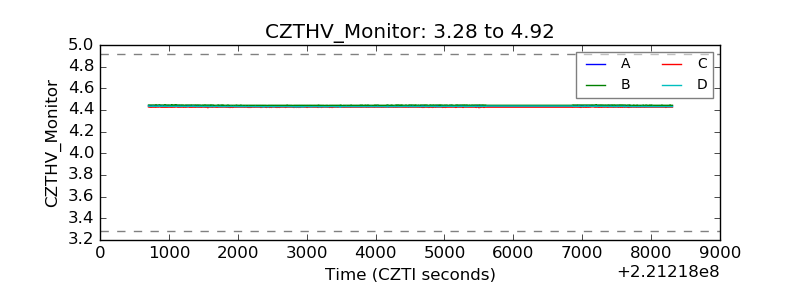 |
| D_VDD | 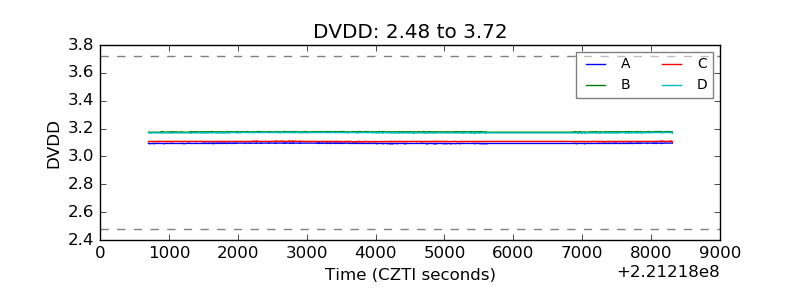 |
| Temperature 1 | 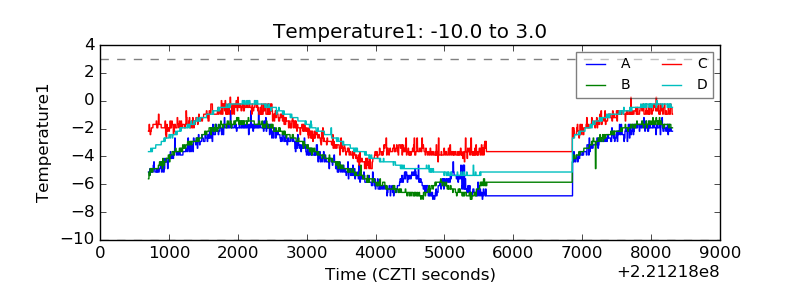 |
| Veto HV Monitor | 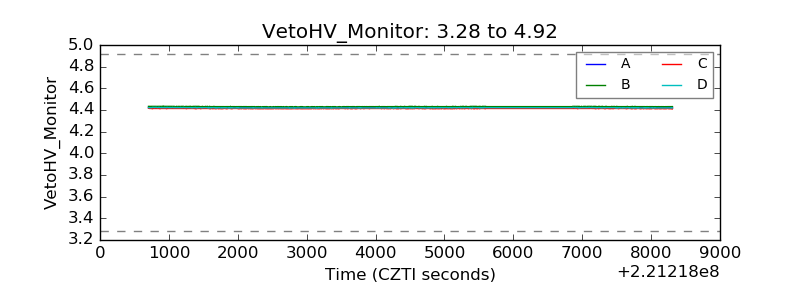 |
| Veto LLD | 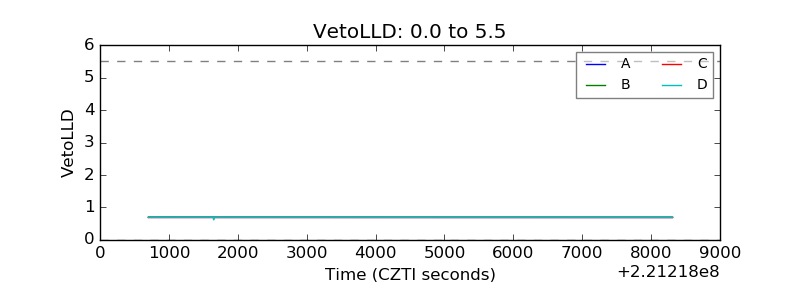 |
| Alpha Counter | 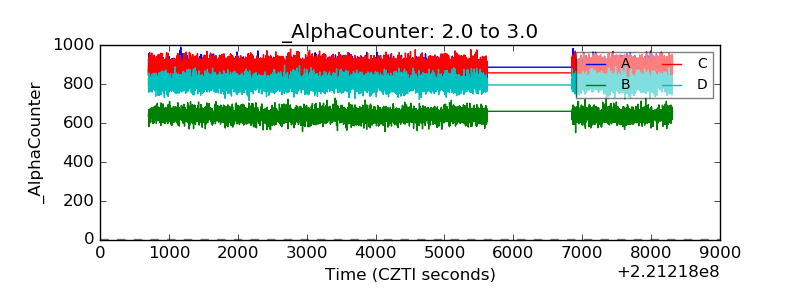 |
| _CPM_Rate | 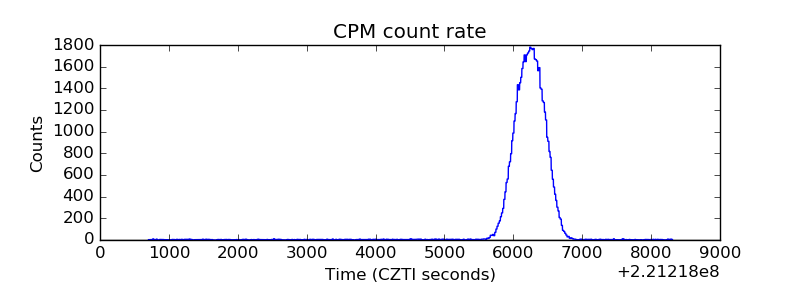 |
| CZT Counter | 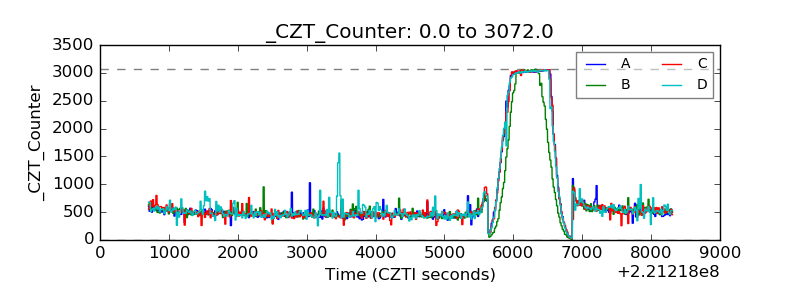 |
| +2.5 Volts monitor | 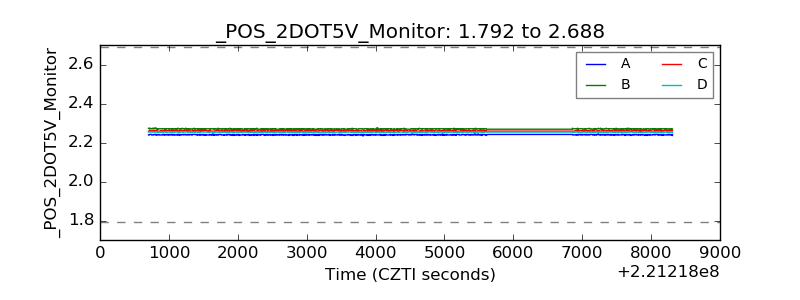 |
| +5 Volts monitor | 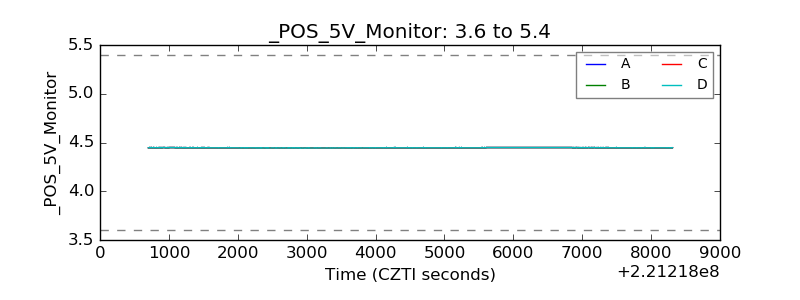 |
| _ROLL_ROT | 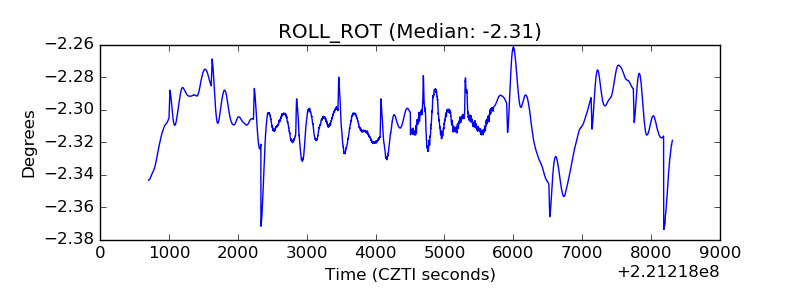 |
| _Roll_DEC | 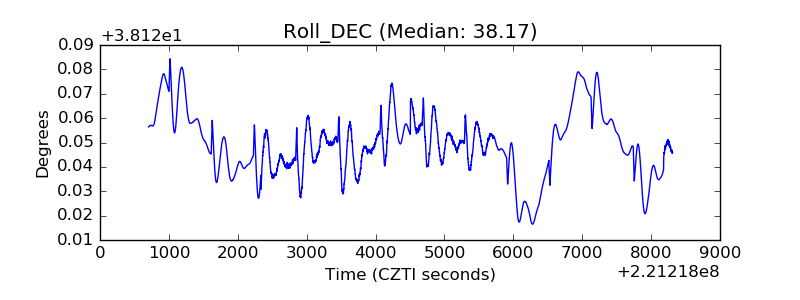 |
| _Roll_RA | 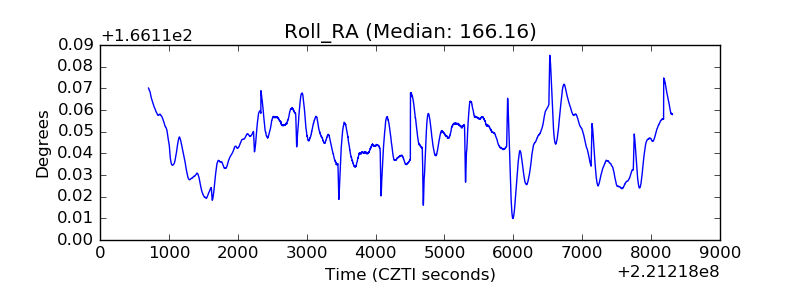 |
| Veto Counter | 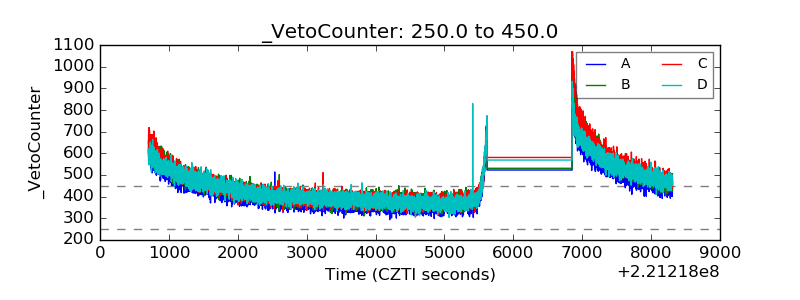 |