| Param | Original file | Final file |
|---|---|---|
| Filename | modeM0/AS1A02_005T01_9000000948_06874cztM0_level2.evt | modeM0/AS1A02_005T01_9000000948_06874cztM0_level2_quad_clean.evt |
| Size (bytes) | 461,096,640 | 65,721,600 |
| Size | 439.7 MB | 62.7 MB |
| Events in quadrant A | 3,266,151 | 389,198 |
| Events in quadrant B | 3,406,349 | 391,314 |
| Events in quadrant C | 3,345,130 | 385,490 |
| Events in quadrant D | 3,511,798 | 377,102 |
| Mode SS | |||
|---|---|---|---|
| Quadrant | BADHDUFLAG | Total packets | Discarded packets |
| A | 0 | 128 | 0 |
| B | 0 | 128 | 0 |
| C | 0 | 128 | 0 |
| D | 0 | 128 | 0 |
| Mode M0 | |||
|---|---|---|---|
| Quadrant | BADHDUFLAG | Total packets | Discarded packets |
| A | 0 | 13777 | 3 |
| B | 0 | 14271 | 2 |
| C | 0 | 13802 | 2 |
| D | 0 | 14515 | 2 |
| Mode M9 | |||
|---|---|---|---|
| Quadrant | BADHDUFLAG | Total packets | Discarded packets |
| A | 0 | 20 | 0 |
| B | 0 | 20 | 0 |
| C | 0 | 20 | 0 |
| D | 0 | 21 | 0 |
| Quadrant | Total seconds | Saturated seconds | Saturation percentage |
|---|---|---|---|
| A | 6410 | 74 | 1.154446% |
| B | 6410 | 77 | 1.201248% |
| C | 6410 | 81 | 1.263651% |
| D | 6410 | 67 | 1.045242% |
Noise dominated data is calculated using 1-second bins in cleaned event files. If a bin has >2000 counts, and if more than 50% of those come from <1% of pixels, then it is considered to be noise-dominated and hence unusable.
| Quadrant | # 1 sec bins | Bins with >0 counts | Bins with >2000 counts | High rate bins dominated by noise | Noise dominated (total time) | Noise dominated (detector-on time) | Marked lightcurve |
|---|---|---|---|---|---|---|---|
| A | 7720 | 6411 | 0 | 0 | 0.00% | 0.00% | 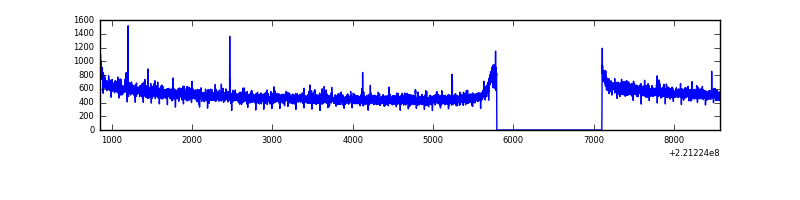 |
| B | 7720 | 6411 | 3 | 3 | 0.04% | 0.05% | 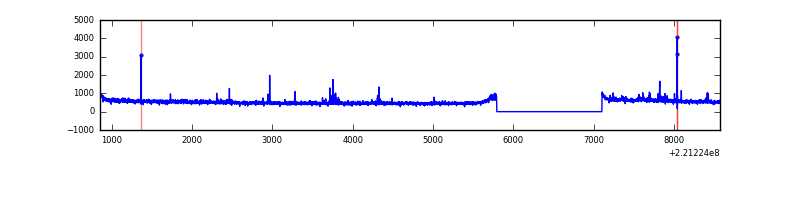 |
| C | 7720 | 6411 | 0 | 0 | 0.00% | 0.00% | 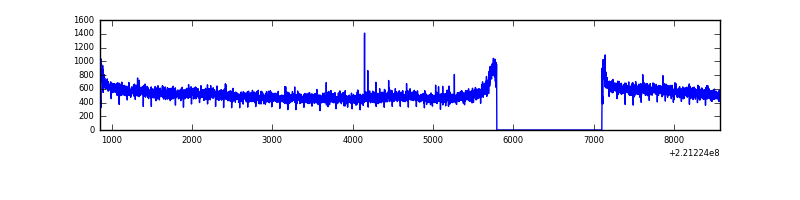 |
| D | 7720 | 6411 | 9 | 9 | 0.12% | 0.14% | 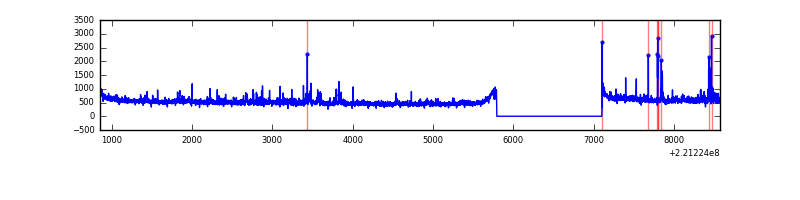 |
Top three noisy pixels from each quadrant. If the there are fewer than three noisy pixels in the level2.evt file, extra rows are filled as -1
| Pixel properties | Quadrant properties | ||||||
|---|---|---|---|---|---|---|---|
| Quadrant | DetID | PixID | Counts | Sigma | Mean | Median | Sigma |
| A | 13 | 248 | 11414 | 62.24 | 842 | 826 | 170.1 |
| A | 0 | 226 | 8151 | 43.06 | 842 | 826 | 170.1 |
| A | 12 | 194 | 7847 | 41.27 | 842 | 826 | 170.1 |
| B | 0 | 219 | 51866 | 321.35 | 842 | 824 | 158.8 |
| B | 15 | 204 | 37248 | 229.32 | 842 | 824 | 158.8 |
| B | 4 | 48 | 19353 | 116.66 | 842 | 824 | 158.8 |
| C | 9 | 247 | 143472 | 762.16 | 816 | 822 | 187.2 |
| C | 13 | 61 | 6597 | 30.85 | 816 | 822 | 187.2 |
| C | 12 | 4 | 4616 | 20.27 | 816 | 822 | 187.2 |
| D | 12 | 221 | 164727 | 817.12 | 825 | 799 | 200.6 |
| D | 8 | 195 | 99999 | 494.48 | 825 | 799 | 200.6 |
| D | 13 | 169 | 51786 | 254.15 | 825 | 799 | 200.6 |
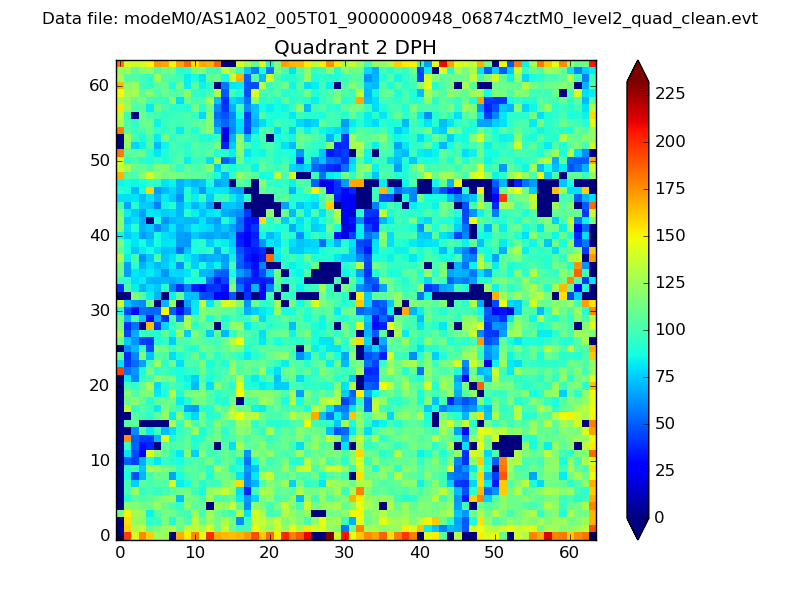
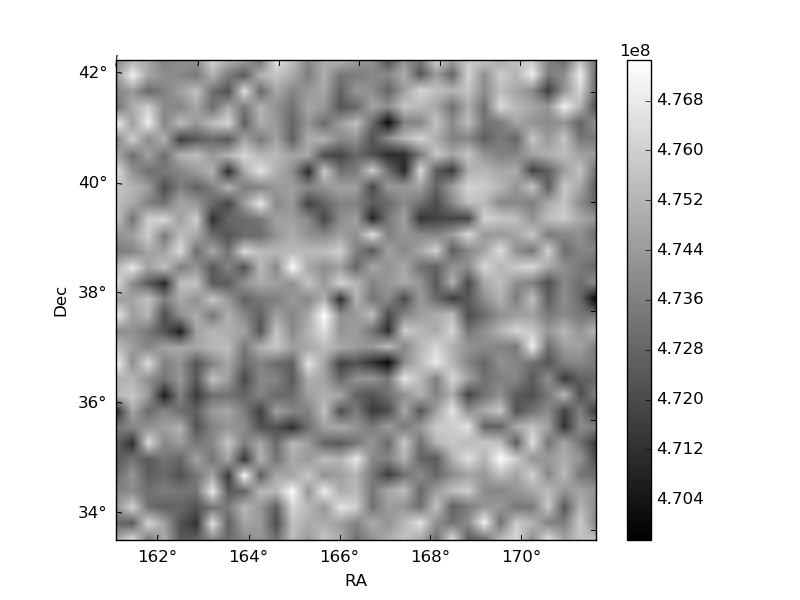
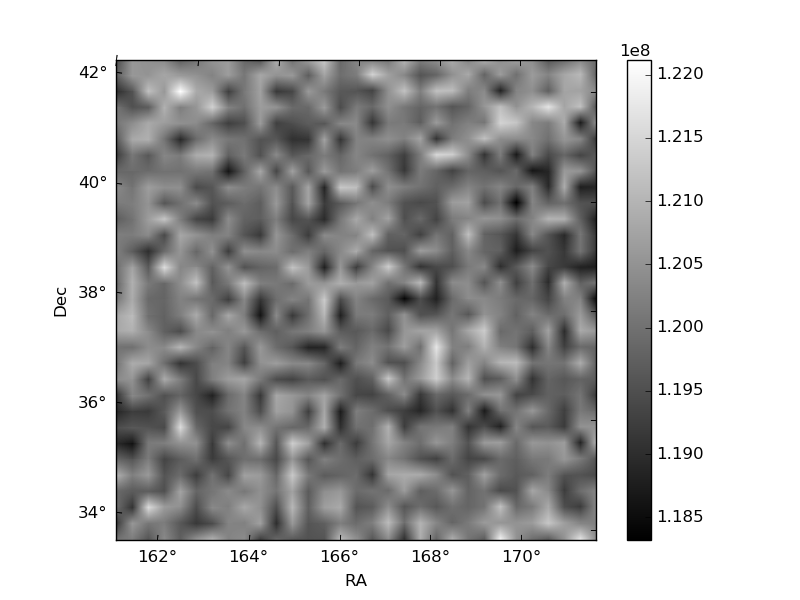
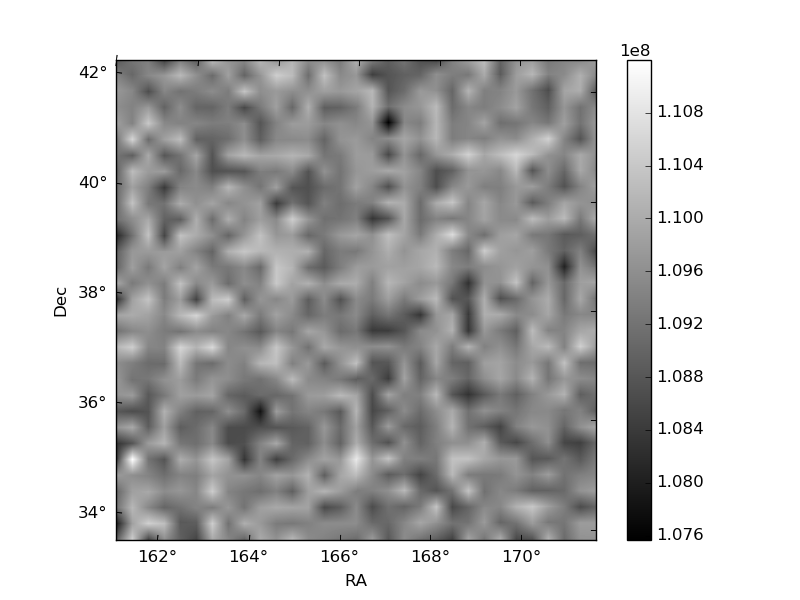
Histogram calculated using DETX and DETY for each event in the final _common_clean file
| Quadrant A | 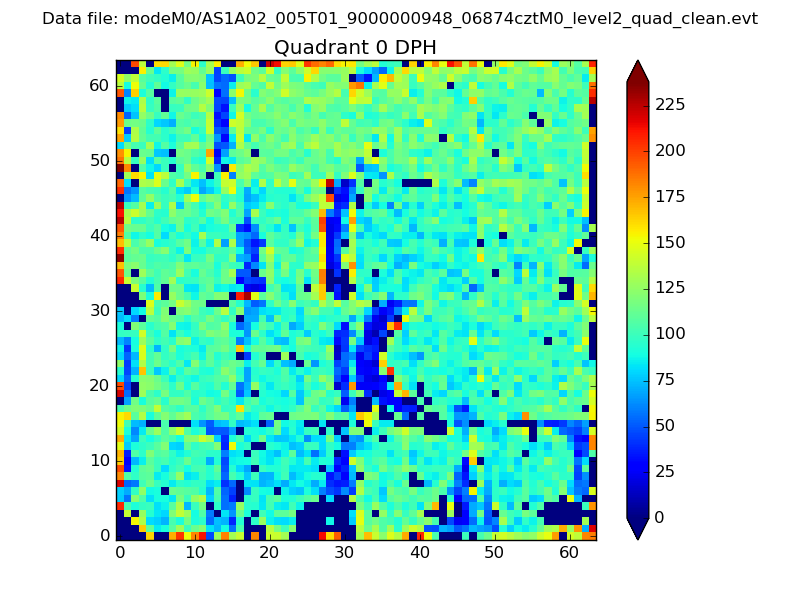 |
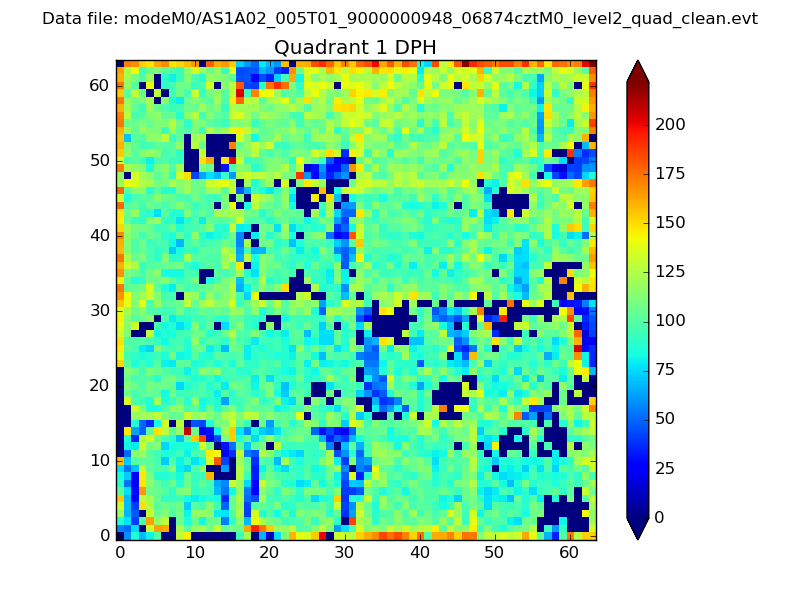 |
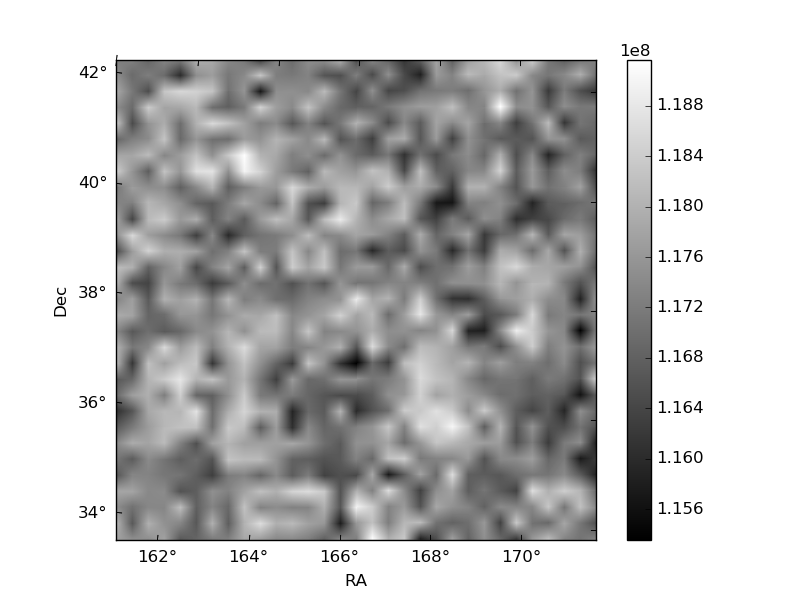
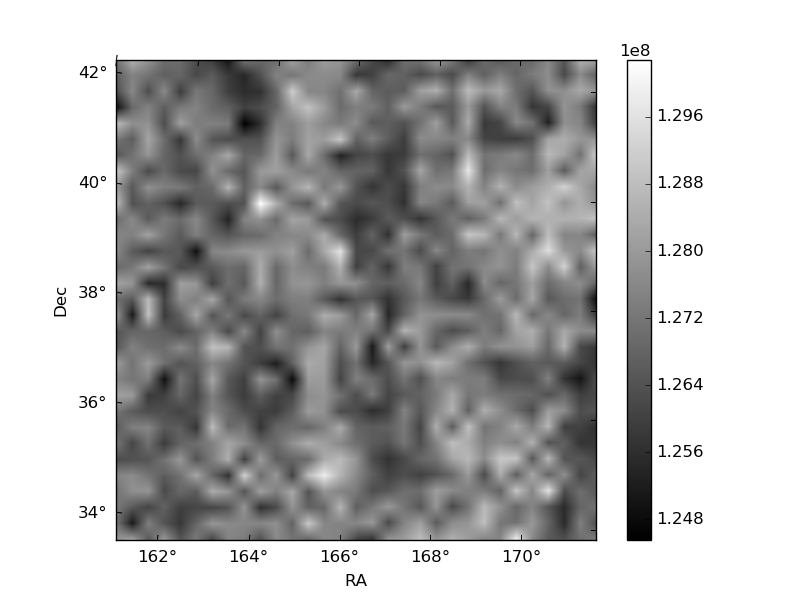
Quadrant B |
|---|---|---|---|
| Quadrant D | 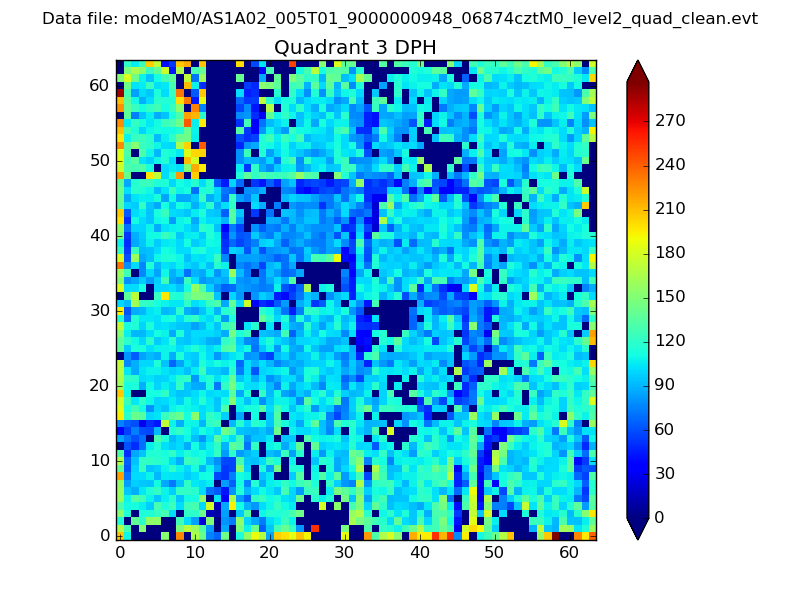 |
 |
Quadrant C |
| Plot type | Count rate plots | Images |
|---|---|---|
| Comparison with Poisson distribution Blue bars denote a histogram of data divided into 1 sec bins. Red curve is a Poisson curve with rate = median count rate of data. |
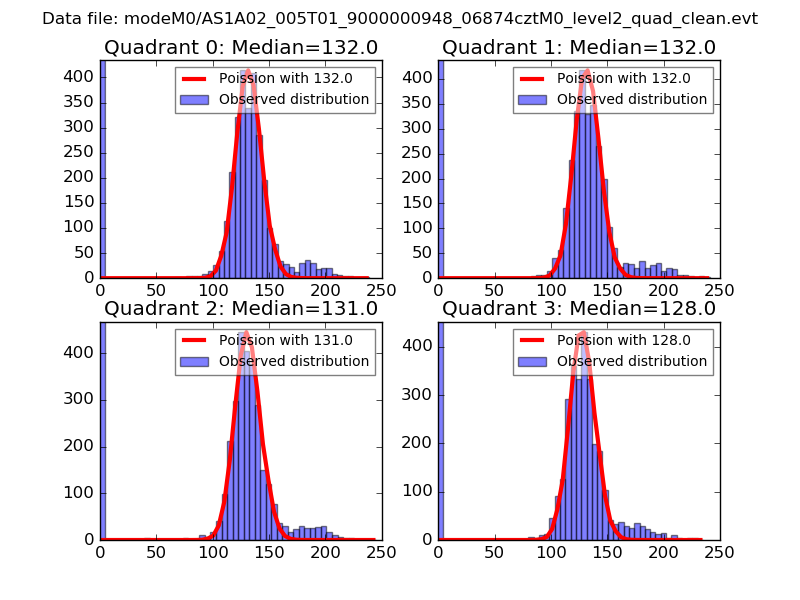 |
 |
| Quadrant-wise count rates Data is divided into 100 sec bins |
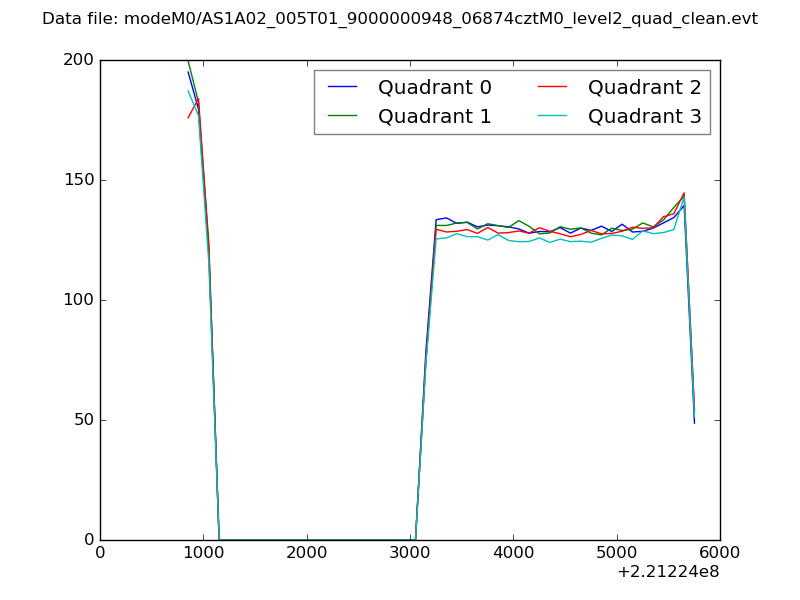 |
|
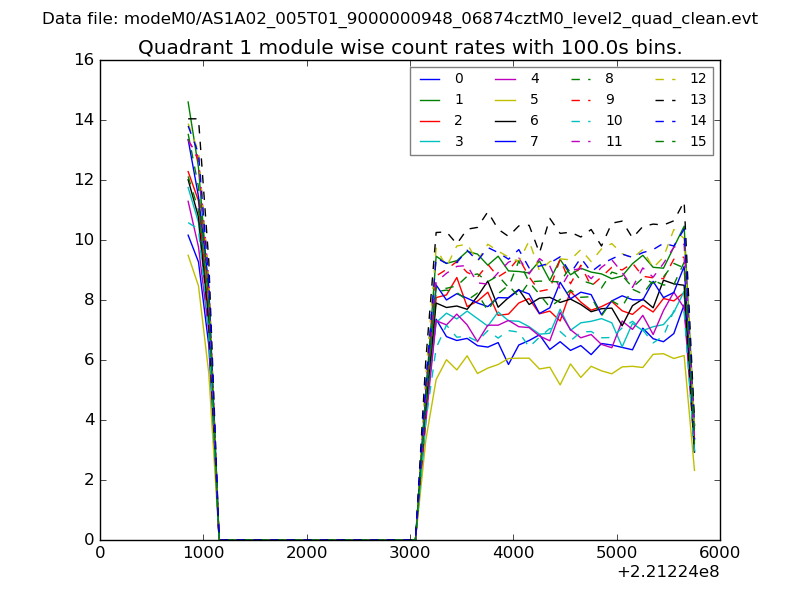
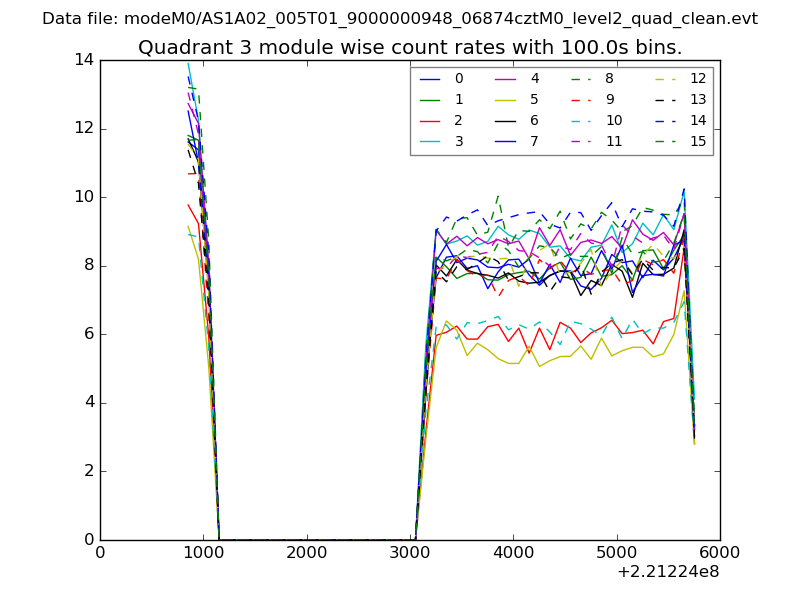
| Module-wise count rates for Quadrant A Data is divided into 100 sec bins |
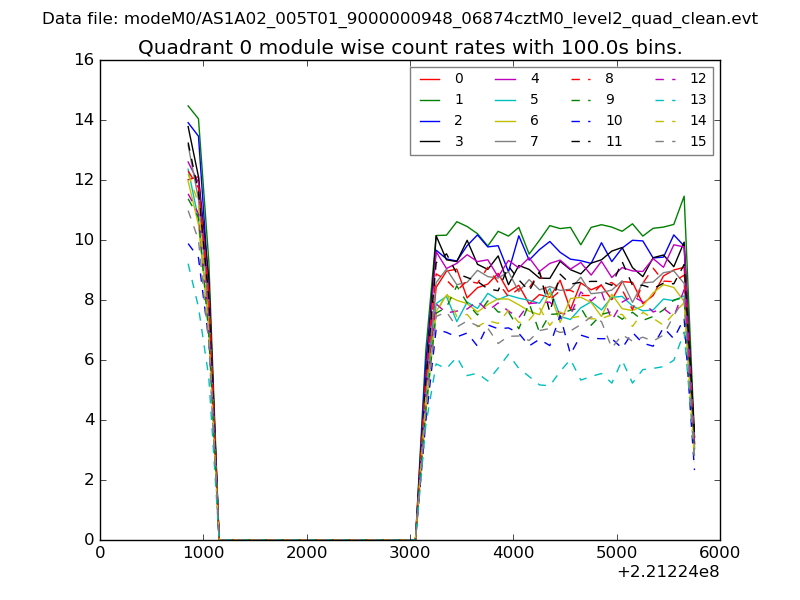 |
 |
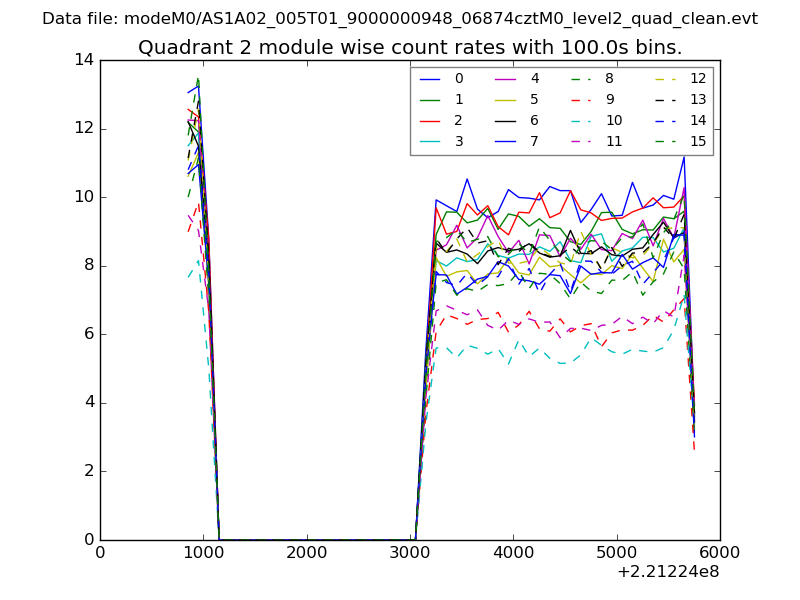
| Module-wise count rates for Quadrant B Data is divided into 100 sec bins |
 |
 |
| Module-wise count rates for Quadrant C Data is divided into 100 sec bins |
 |
 |
| Module-wise count rates for Quadrant D Data is divided into 100 sec bins |
 |
 |
| Parameter | Plot |
|---|---|
| CZT HV Monitor | 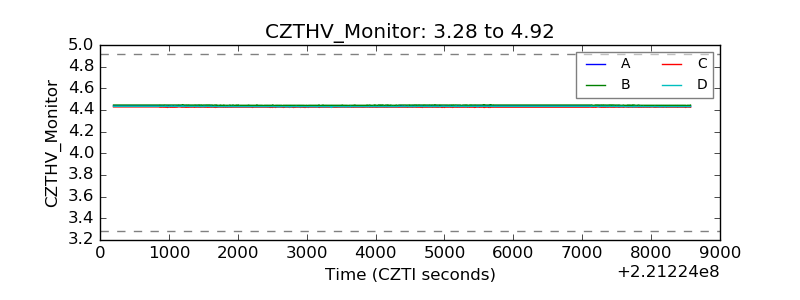 |
| D_VDD | 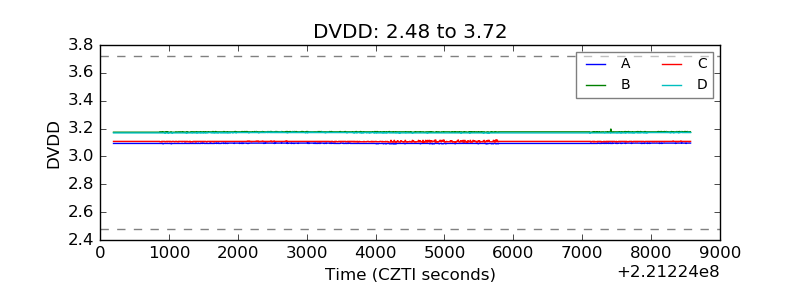 |
| Temperature 1 | 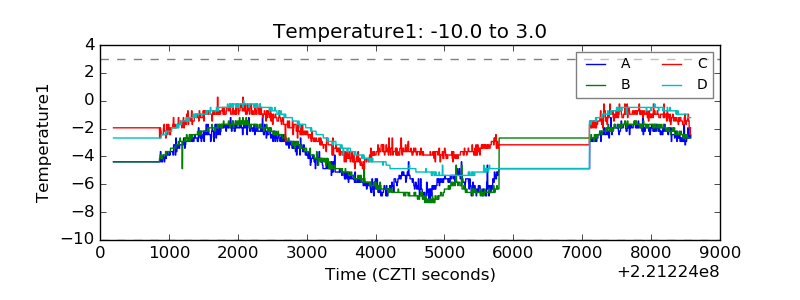 |
| Veto HV Monitor | 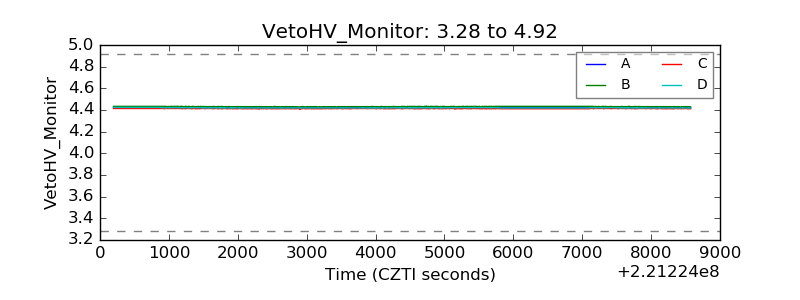 |
| Veto LLD | 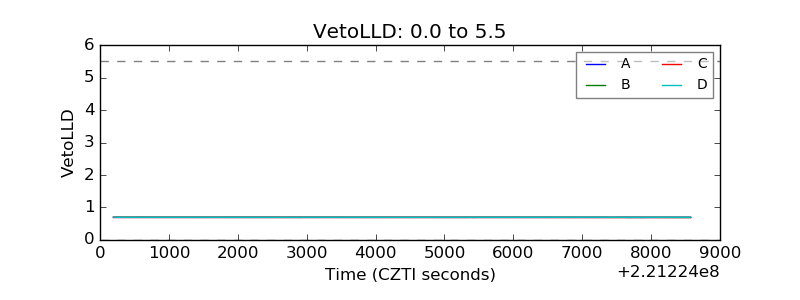 |
| Alpha Counter | 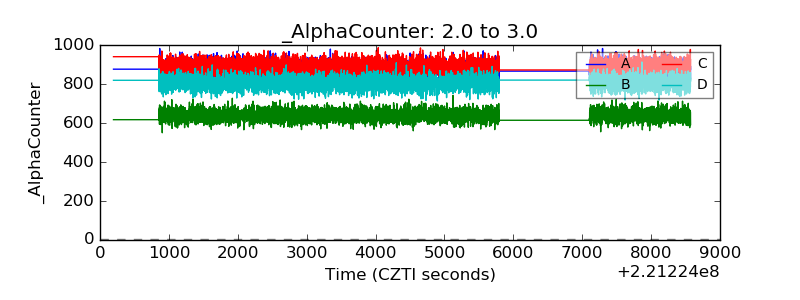 |
| _CPM_Rate | 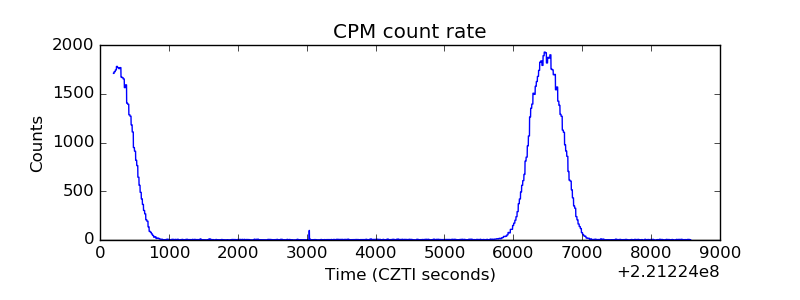 |
| CZT Counter | 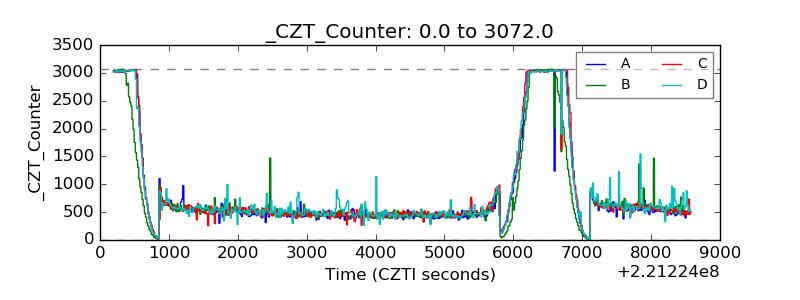 |
| +2.5 Volts monitor | 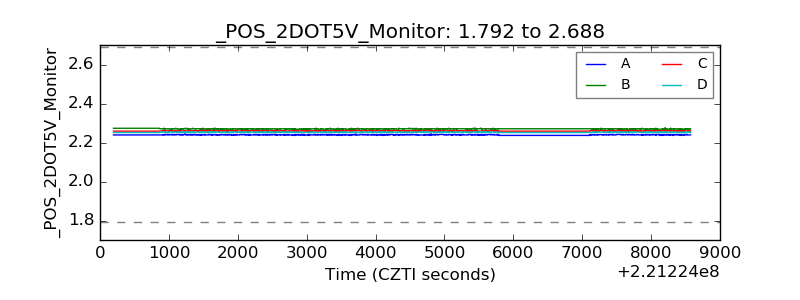 |
| +5 Volts monitor | 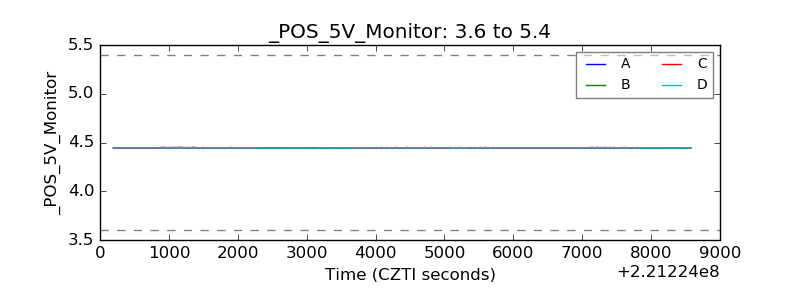 |
| _ROLL_ROT | 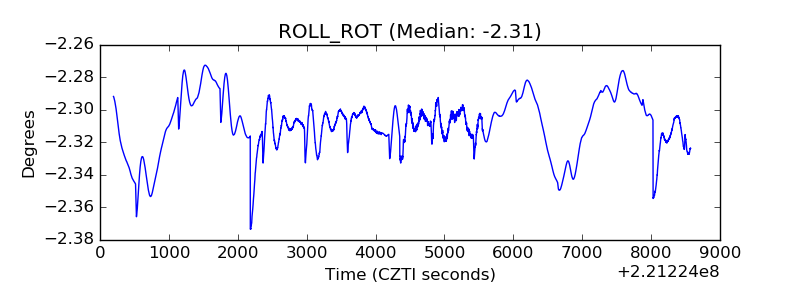 |
| _Roll_DEC | 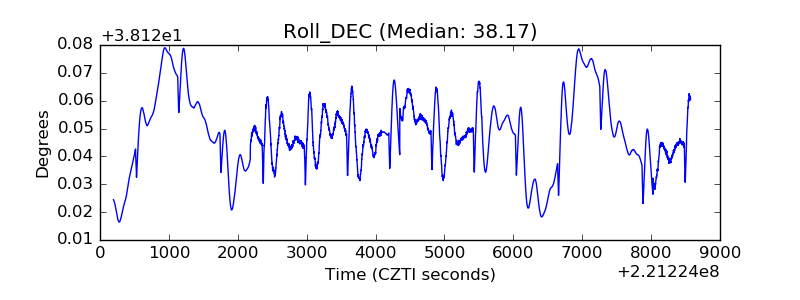 |
| _Roll_RA | 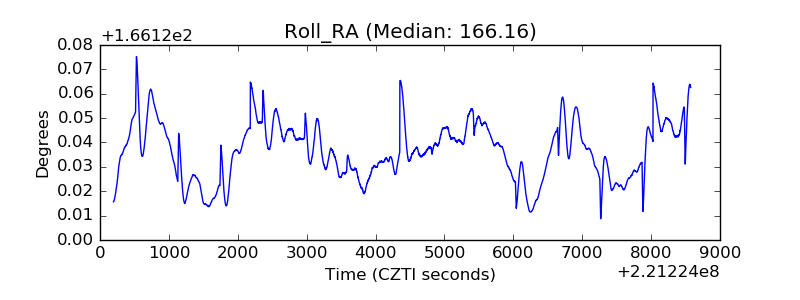 |
| Veto Counter | 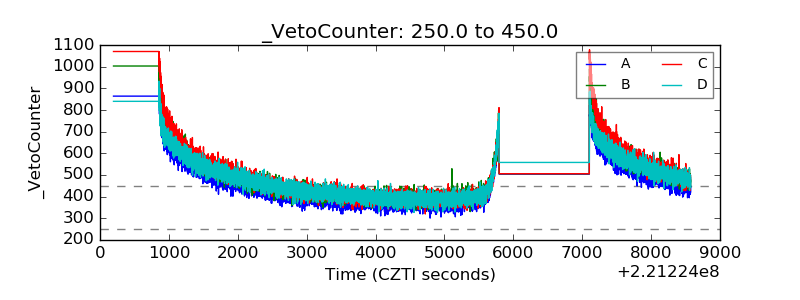 |