| Param | Original file | Final file |
|---|---|---|
| Filename | modeM0/AS1A02_005T01_9000000948_06875cztM0_level2.evt | modeM0/AS1A02_005T01_9000000948_06875cztM0_level2_quad_clean.evt |
| Size (bytes) | 468,498,240 | 66,576,960 |
| Size | 446.8 MB | 63.5 MB |
| Events in quadrant A | 3,267,514 | 394,728 |
| Events in quadrant B | 3,449,905 | 398,637 |
| Events in quadrant C | 3,375,064 | 396,230 |
| Events in quadrant D | 3,665,122 | 383,380 |
| Mode SS | |||
|---|---|---|---|
| Quadrant | BADHDUFLAG | Total packets | Discarded packets |
| A | 0 | 128 | 0 |
| B | 0 | 128 | 0 |
| C | 0 | 128 | 0 |
| D | 0 | 128 | 0 |
| Mode M0 | |||
|---|---|---|---|
| Quadrant | BADHDUFLAG | Total packets | Discarded packets |
| A | 0 | 13773 | 3 |
| B | 0 | 14495 | 2 |
| C | 0 | 13909 | 2 |
| D | 0 | 14976 | 2 |
| Mode M9 | |||
|---|---|---|---|
| Quadrant | BADHDUFLAG | Total packets | Discarded packets |
| A | 0 | 17 | 0 |
| B | 0 | 17 | 0 |
| C | 0 | 17 | 0 |
| D | 0 | 18 | 0 |
| Quadrant | Total seconds | Saturated seconds | Saturation percentage |
|---|---|---|---|
| A | 6348 | 98 | 1.543793% |
| B | 6348 | 90 | 1.417769% |
| C | 6348 | 101 | 1.591052% |
| D | 6348 | 102 | 1.606805% |
Noise dominated data is calculated using 1-second bins in cleaned event files. If a bin has >2000 counts, and if more than 50% of those come from <1% of pixels, then it is considered to be noise-dominated and hence unusable.
| Quadrant | # 1 sec bins | Bins with >0 counts | Bins with >2000 counts | High rate bins dominated by noise | Noise dominated (total time) | Noise dominated (detector-on time) | Marked lightcurve |
|---|---|---|---|---|---|---|---|
| A | 7678 | 6349 | 1 | 1 | 0.01% | 0.02% | 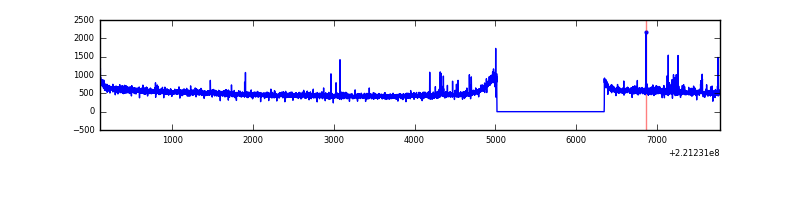 |
| B | 7678 | 6349 | 4 | 4 | 0.05% | 0.06% | 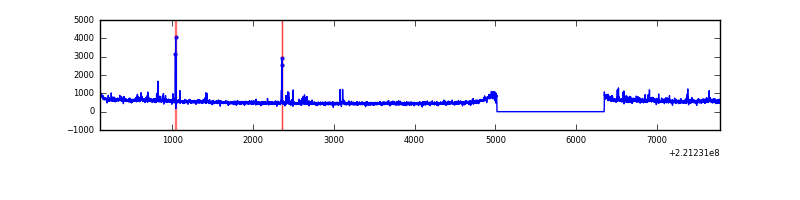 |
| C | 7678 | 6349 | 0 | 0 | 0.00% | 0.00% | 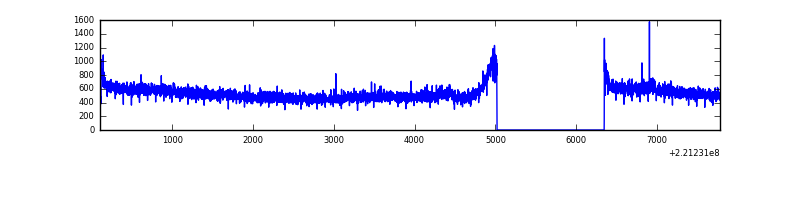 |
| D | 7678 | 6349 | 19 | 19 | 0.25% | 0.30% | 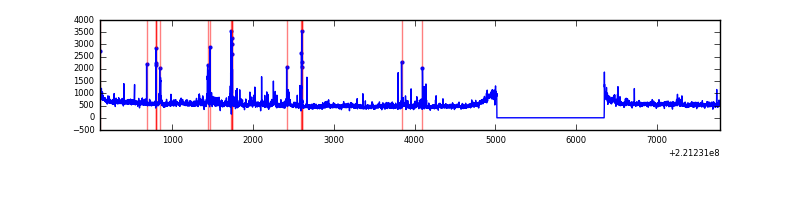 |
Top three noisy pixels from each quadrant. If the there are fewer than three noisy pixels in the level2.evt file, extra rows are filled as -1
| Pixel properties | Quadrant properties | ||||||
|---|---|---|---|---|---|---|---|
| Quadrant | DetID | PixID | Counts | Sigma | Mean | Median | Sigma |
| A | 15 | 223 | 45522 | 265.16 | 834 | 817 | 168.6 |
| A | 13 | 248 | 8410 | 45.04 | 834 | 817 | 168.6 |
| A | 0 | 226 | 8072 | 43.03 | 834 | 817 | 168.6 |
| B | 0 | 219 | 66204 | 421.56 | 836 | 817 | 155.1 |
| B | 0 | 214 | 61186 | 389.21 | 836 | 817 | 155.1 |
| B | 15 | 204 | 43925 | 277.92 | 836 | 817 | 155.1 |
| C | 9 | 247 | 188304 | 1008.24 | 813 | 817 | 186.0 |
| C | 13 | 61 | 6559 | 30.88 | 813 | 817 | 186.0 |
| C | 9 | 16 | 5398 | 24.63 | 813 | 817 | 186.0 |
| D | 12 | 221 | 258894 | 1304.4 | 818 | 795 | 197.9 |
| D | 13 | 169 | 138372 | 695.3 | 818 | 795 | 197.9 |
| D | 8 | 195 | 91020 | 455.99 | 818 | 795 | 197.9 |
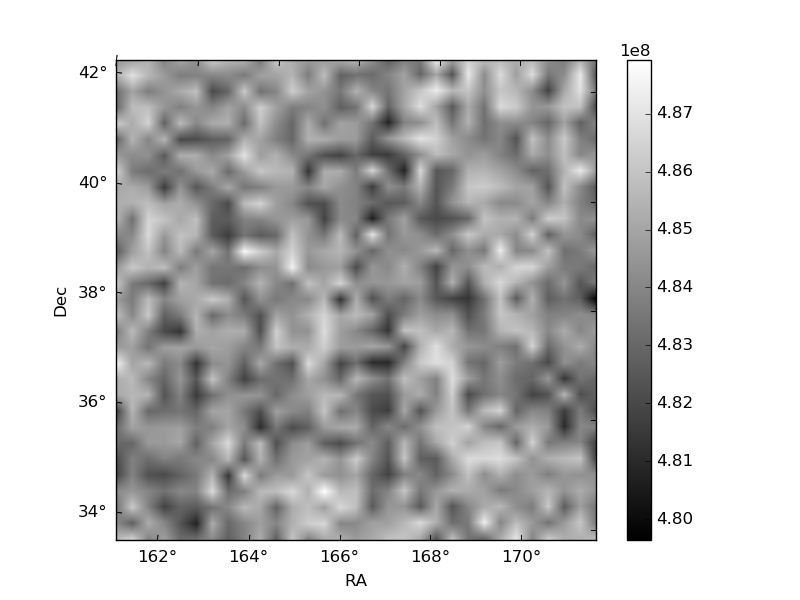
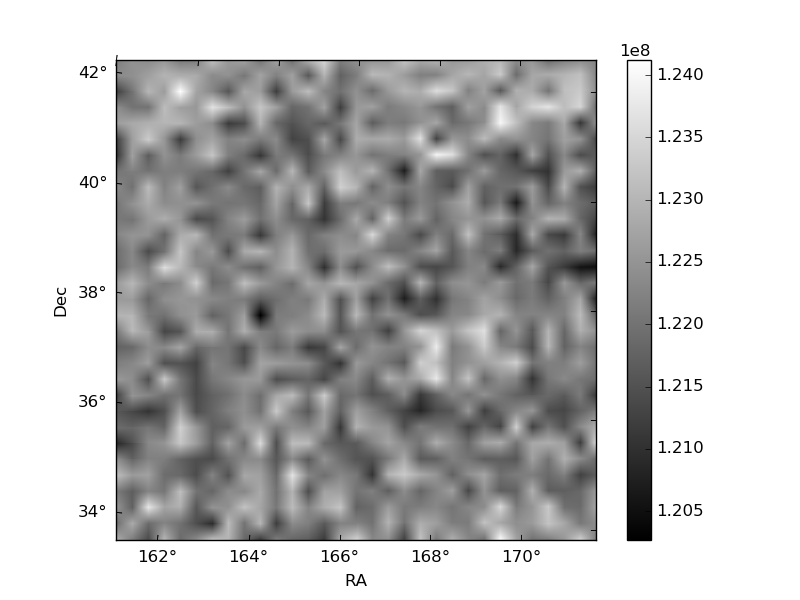
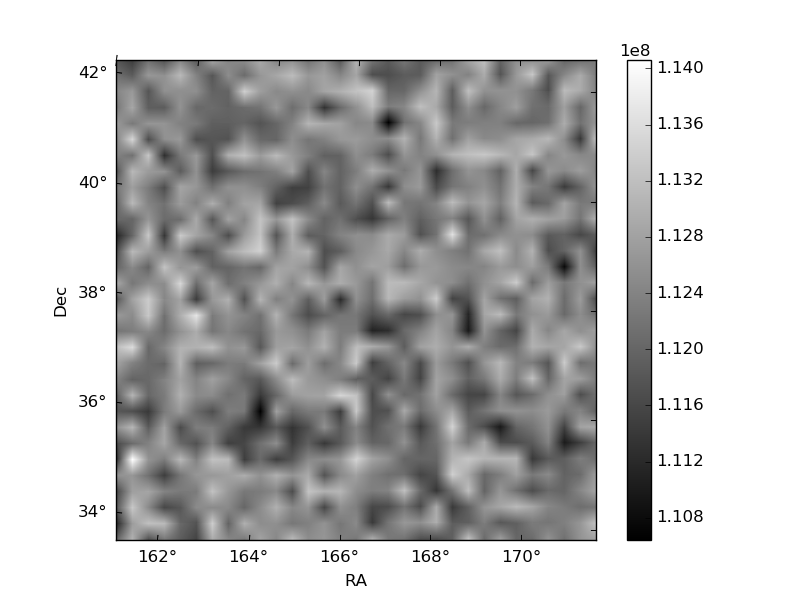
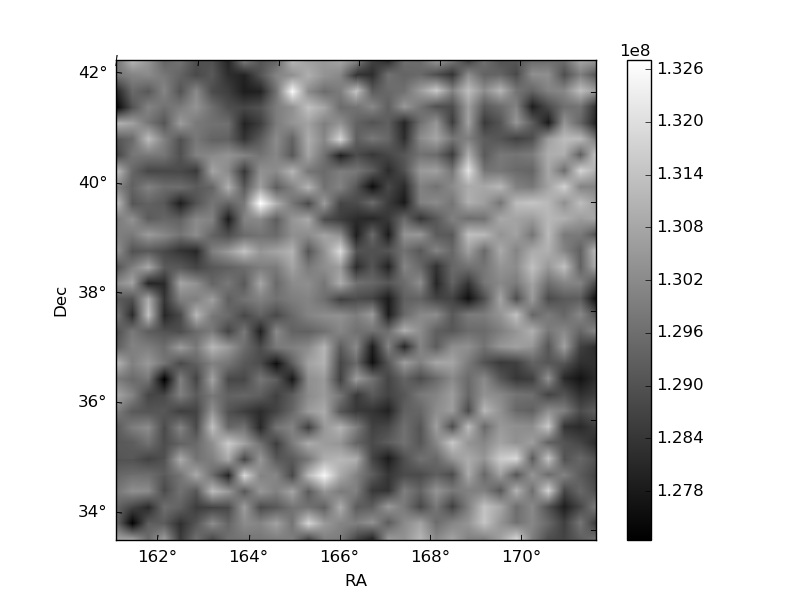
Histogram calculated using DETX and DETY for each event in the final _common_clean file
| Quadrant A | 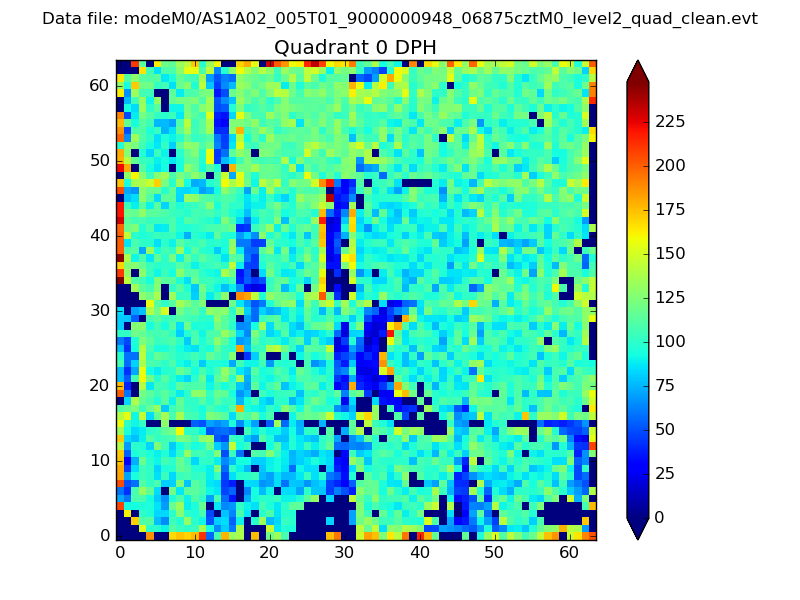 |
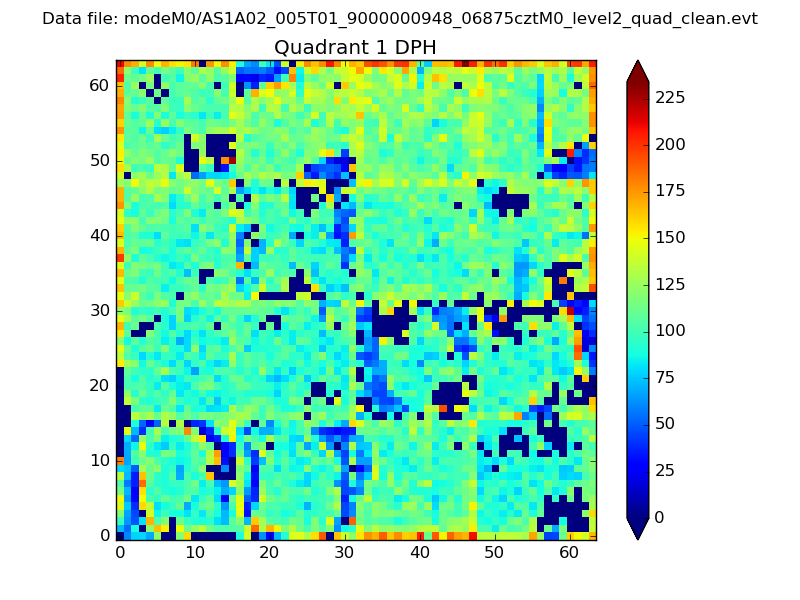 |
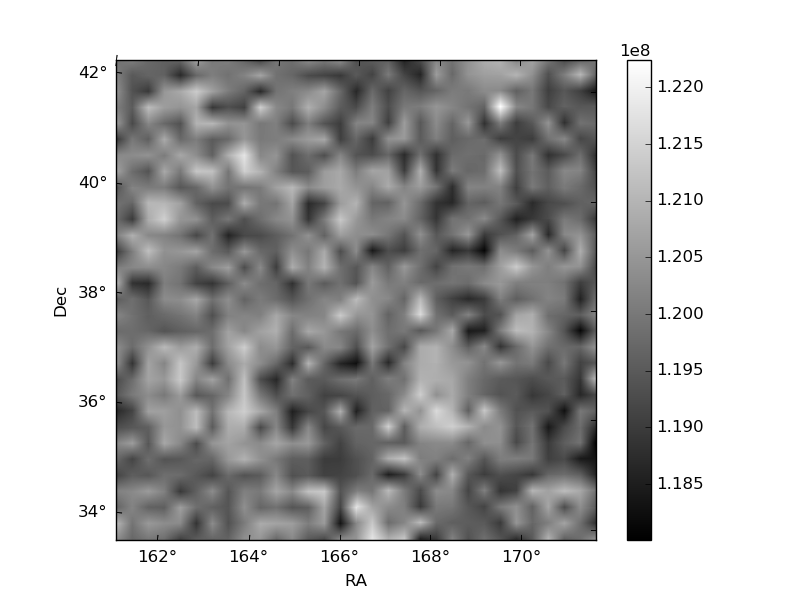
Quadrant B |
|---|---|---|---|
| Quadrant D | 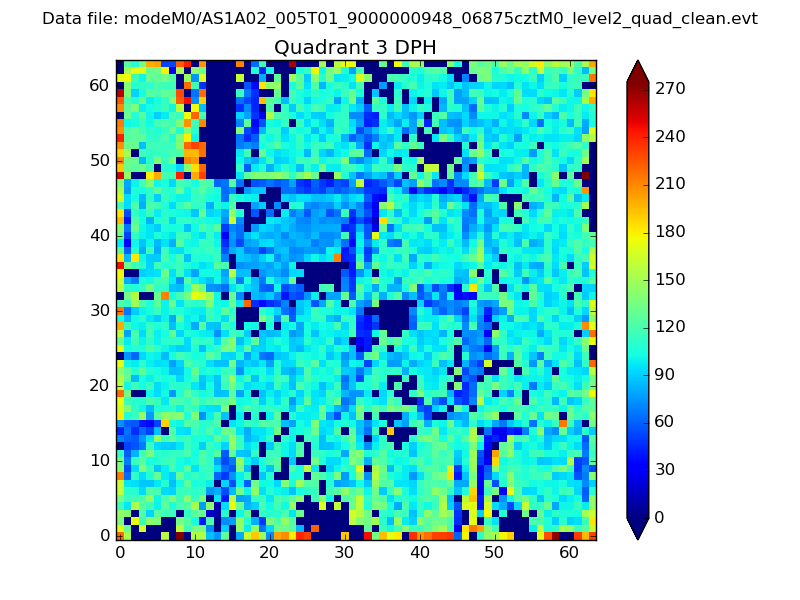 |
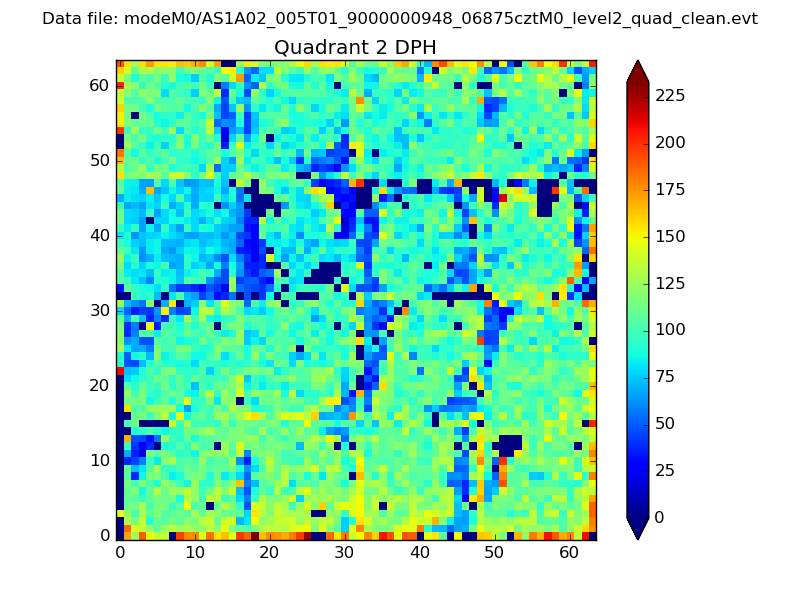 |
Quadrant C |
| Plot type | Count rate plots | Images |
|---|---|---|
| Comparison with Poisson distribution Blue bars denote a histogram of data divided into 1 sec bins. Red curve is a Poisson curve with rate = median count rate of data. |
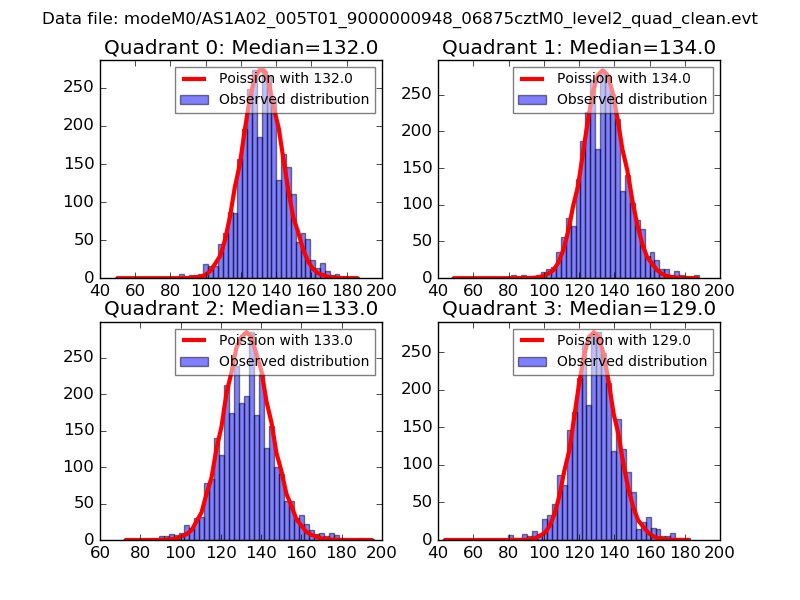 |
 |
| Quadrant-wise count rates Data is divided into 100 sec bins |
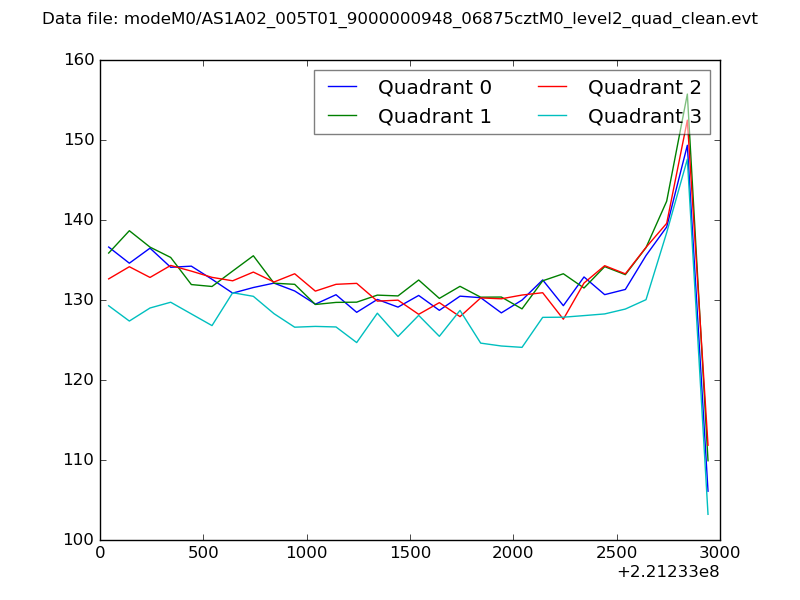 |
|
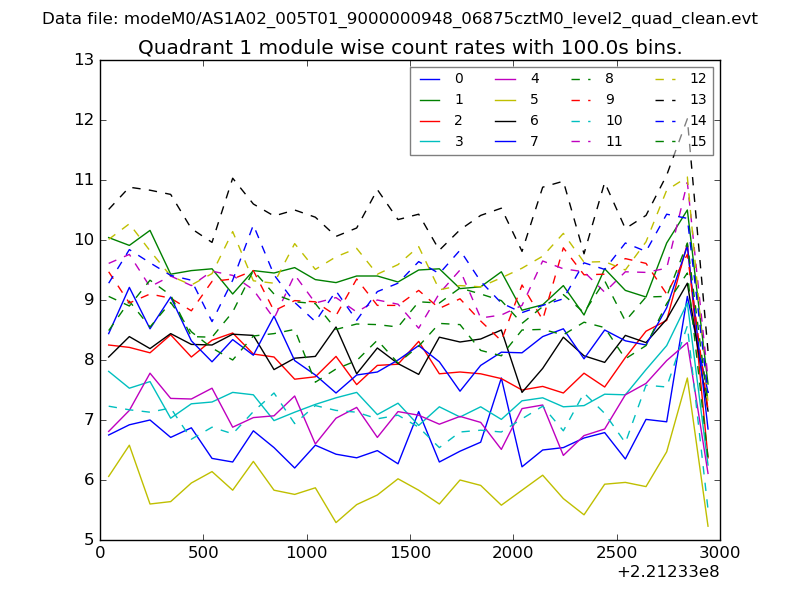
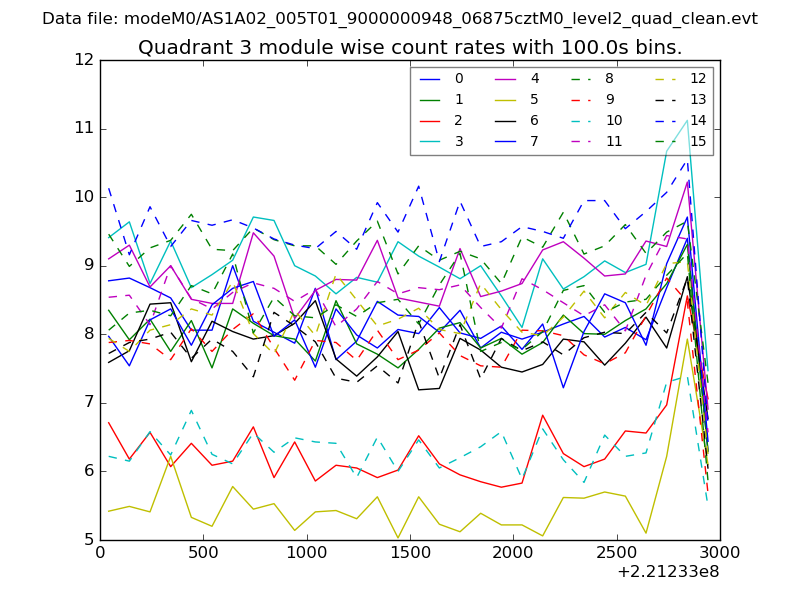
| Module-wise count rates for Quadrant A Data is divided into 100 sec bins |
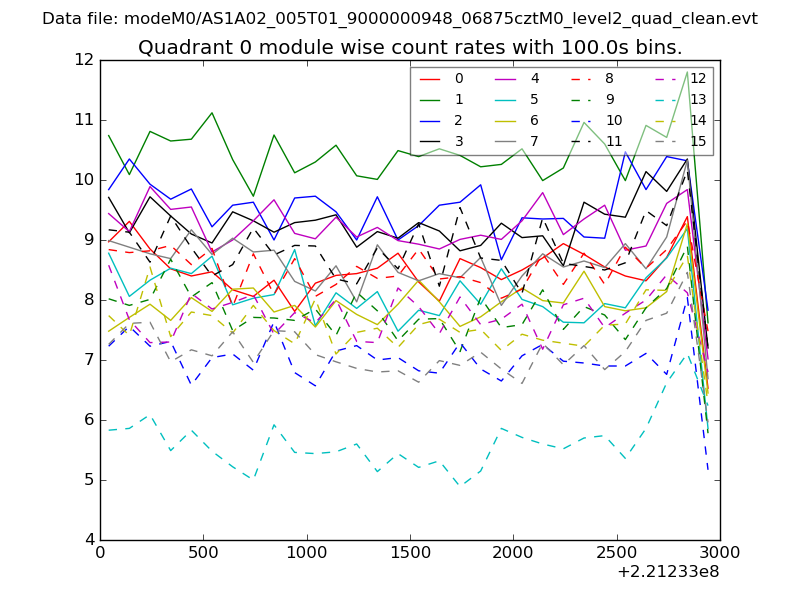 |
 |
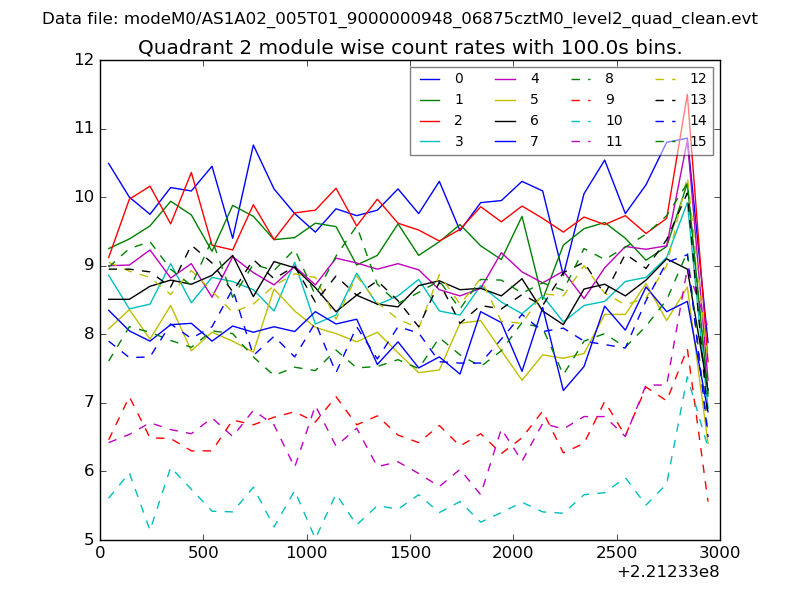
| Module-wise count rates for Quadrant B Data is divided into 100 sec bins |
 |
 |
| Module-wise count rates for Quadrant C Data is divided into 100 sec bins |
 |
 |
| Module-wise count rates for Quadrant D Data is divided into 100 sec bins |
 |
 |
| Parameter | Plot |
|---|---|
| CZT HV Monitor | 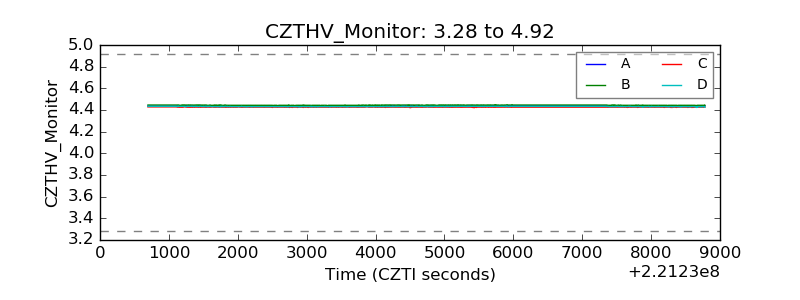 |
| D_VDD | 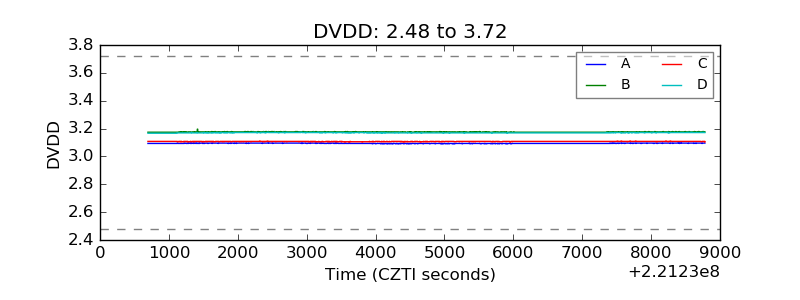 |
| Temperature 1 | 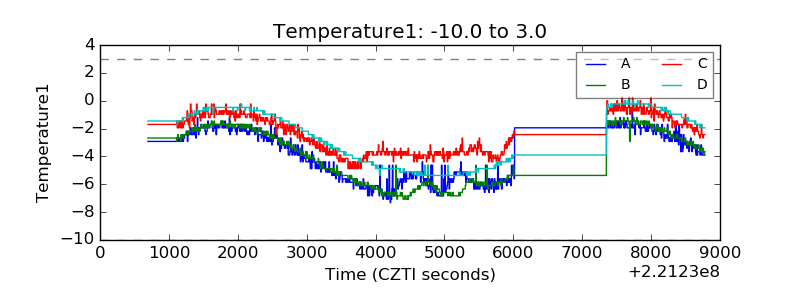 |
| Veto HV Monitor | 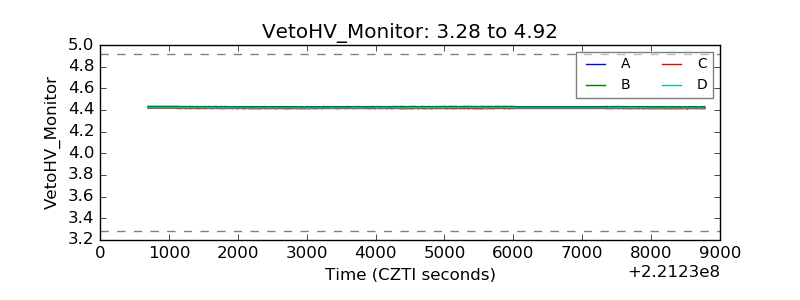 |
| Veto LLD | 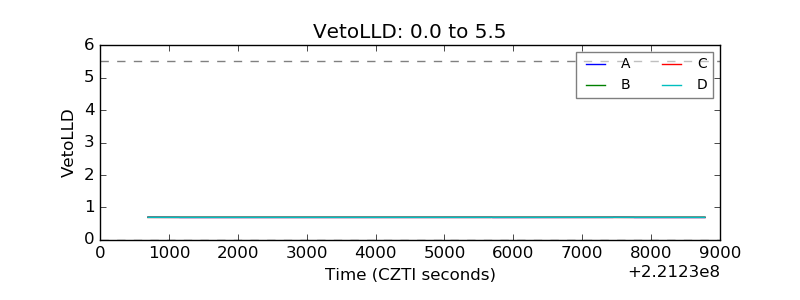 |
| Alpha Counter | 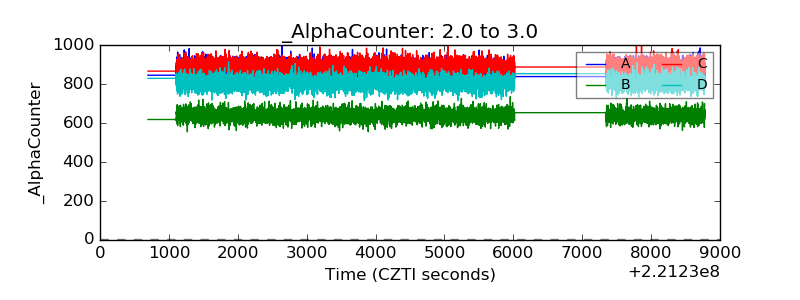 |
| _CPM_Rate | 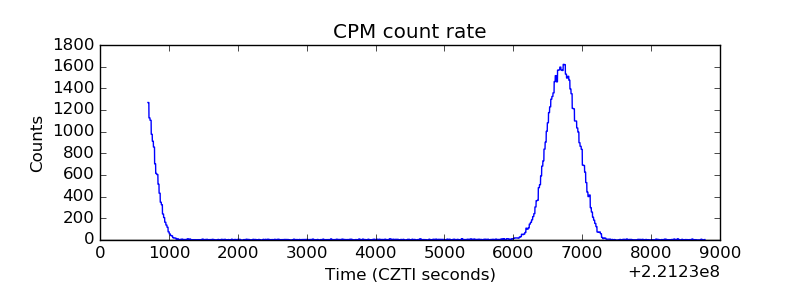 |
| CZT Counter | 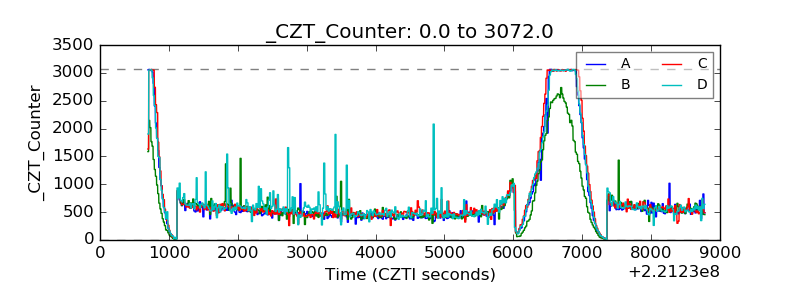 |
| +2.5 Volts monitor | 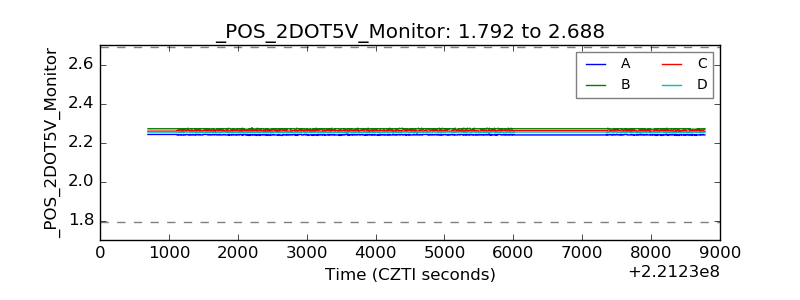 |
| +5 Volts monitor | 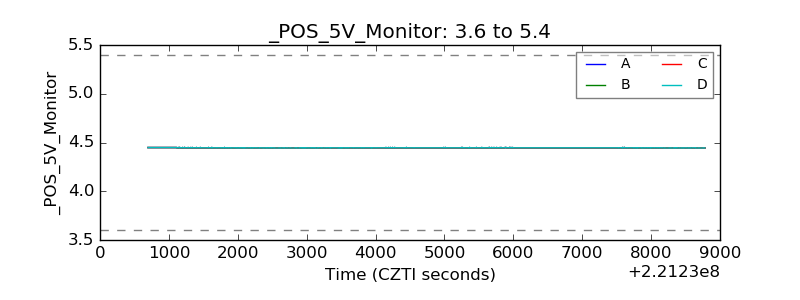 |
| _ROLL_ROT | 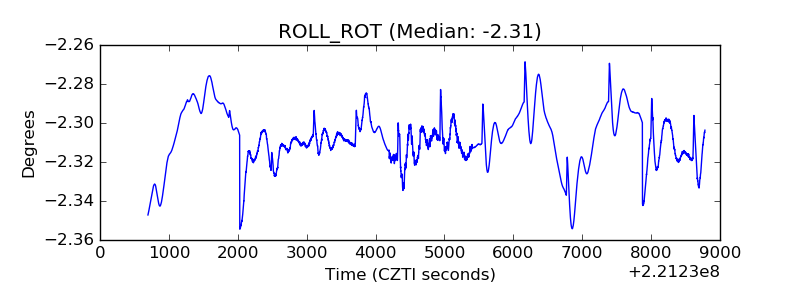 |
| _Roll_DEC | 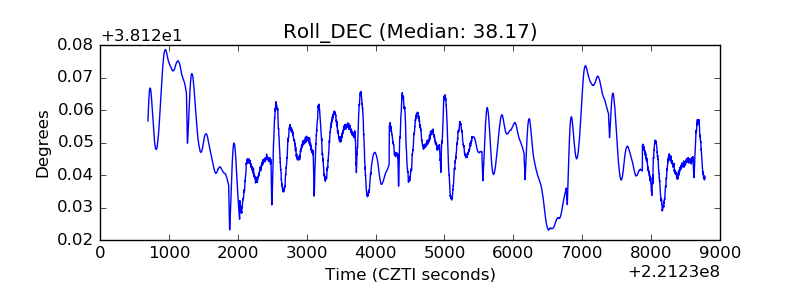 |
| _Roll_RA | 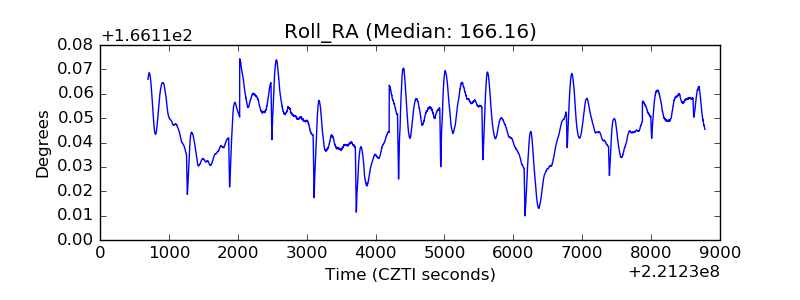 |
| Veto Counter | 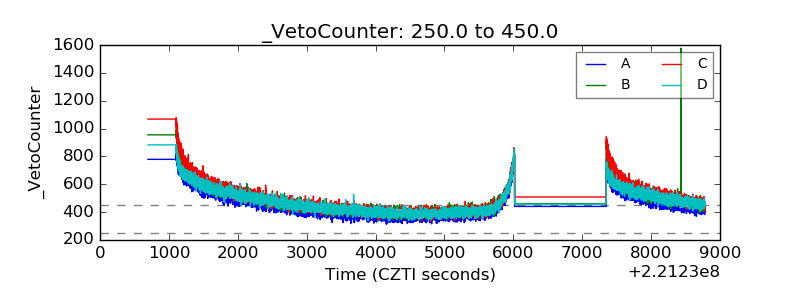 |